. 2024 Nov 29;10(48):eado5982.
doi: 10.1126/sciadv.ado5982. Epub 2024 Nov 27.

TCF1 dosage determines cell fate during T cell development

Affiliations

TCF1 dosage determines cell fate during T cell development

Anjali Verma et al. Sci Adv. .

Abstract

Loss-of-function studies have shown that transcription factor T cell factor-1 (TCF1), encoded by the Tcf7 gene, is essential for T cell development in the thymus. We discovered that the Tcf7 expression level is regulated by E box DNA binding proteins, independent of Notch, and regulates αβ and γδ T cell development. Systematic interrogation of the five E protein binding elements (EPE1-5) in the Tcf7 enhancer region showed lineage-specific utilization. Specifically, loss-of-function analysis revealed that only EPE3 plays a critical role in supporting αβ T cell development, while EPE1, 3, and 5 regulate the γδ T cell maturation and functional cell fate decision. The importance of EPE3 in supporting both lineages may stem from its unique capacity to interact with the Tcf7 transcriptional start site. Together, these studies demonstrate that the precise dosage of TCF1 expression mediated by distinct EPEs generates a balanced output of T cells from the thymus.


Figures
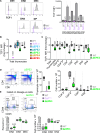
Fig. 1.
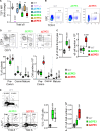
Fig. 1.. E protein–dependent modest reduction in TCF1 expression markedly attenuates αβ T cell development.
(A) Intracellular flow cytometry analysis of expression of TCF1 in lineage DN1 (CD44+CD25), DN2 (CD44+CD25+), DN3 (CD44CD25+), DN4 (CD44CD25) cells, and DP (CD4+CD8+) thymocytes from WT and Tcf7−/− mice. Graph represents TCF1 MFI in the indicated population in WT (n = 4) and Tcf7−/− (n = 3) mice. (B) Graph represents fold change in MFI of TCF1 in total thymocytes from ΔEPE1, ΔEPE2, ΔEPE3, ΔEPE4, and ΔEPE5 mice. (C) Graph represents fold change in MFI of TCF1 in the indicated ΔEPE3 thymic subset relative to WT (n = 4) and ΔEPE3 (n = 8) mice. (D) Flow cytometry analysis of surface expression of CD4, and CD8 in total thymocytes. Graph represents the absolute number of total thymocytes in WT (n = 6), Tcf7/ (n = 3), and ΔEPE3 (n = 7) mice; and absolute number of DN (CD4CD8), DP (CD4+CD8+), single positive (CD4+CD8 and CD4CD8+) cells in WT (n = 11) and ΔEPE3 (n = 5) mice. (E) Flow cytometry analysis of surface expression of CD44, and CD25 in lineage negative thymocytes of WT, and ΔEPE3 mice. Graphical representation of the frequencies and number of DN2–4 cells in thymi of WT (n = 6), and ΔEPE3 mice (n = 12). Results are representative of three or more experiments performed and P values relative to WT are indicated.
Fig. 2.
Fig. 2.. Reduced TCF1 expression in progenitor thymocytes promotes development of γδ T cells and adoption of IL-17 producing cell fate.
(A) Graph represents the fold change in the TCF1 MFI in Tcf7−/− (n = 4), ΔEPE1 (n = 8), ΔEPE2 (n = 6), ΔEPE3 (n = 5), ΔEPE4 (n = 5), and ΔEPE5 (n = 10) relative to WT (n = 9) thymocytes. (B) Flow cytometric analysis of γδ T cells for the surface expression of TCRδ in the thymi of WT, ΔEPE3, and ΔEPE5 mice. (C) Graph represents the frequency (left) and absolute number (right) of γδ T cells in the thymi of WT (n = 13), ΔEPE3 (n = 11), and ΔEPE5 (n = 10) mice. (D) Flow cytometric analysis of surface expression of CD24 and CD73 on γδ T cells with developmental intermediates (precommitment, CD73CD24+; committed, CD73+CD24+; and mature, CD73+CD24) and graphical representation of frequency (left) and absolute number (right). WT (n = 13), ΔEPE3 mice (n = 10), and ΔEPE5 mice (n = 7). (E) Flow cytometric analysis of IL-17 producing γδ T cells from WT, ΔEPE3, and ΔEPE5 mice, following activation with phorbol 12-myristate 13-acetate and ionomycin for 6 hours. Graphical representation of the frequency and absolute number of IL-17 producing γδ T cells in the thymi of WT (n = 8), ΔEPE3 mice (n = 4), and ΔEPE5 mice (n = 3). Results are representative of three or more experiments performed and P values relative to WT are indicated as noted in methods.
Fig. 3.
Fig. 3.. Reduced expression of TCF1 in ΔEPE3 DN thymocytes impedes developmental transition to the DP stage.
(A) Schematic representation of the suspension culture experimental design. (B) The frequency of DN (top) and DP thymocytes (bottom) was determined by flow cytometry at the indicated times of culture and mean ± SD of triplicate measurements was depicted graphically. (C) Schematic representation of OP9-DL1 culture experiment. (D and E) Development of DN progenitors from WT and ΔEPE3 to the DP stage on OP9-DL1 monolayers was assessed by flow cytometry at the indicated times of culture. Representative dot pots of thymic subsets defined by CD4 and CD8 are depicted in (D) and graphical representation of the absolute numbers of DP thymocytes (E) on the indicated days of culture. (F) Schematic of the experiment to evaluate the effect of ectopic expression of TCF1 on rescue of the developmental defect in ΔEPE3 progenitor cells. (G) DN thymocytes were transduced with empty vector (pMiG) or TCF1 (pMiG-Tcf7) and cultured in triplicate for 2 days on OP9-DL1 monolayers, following which the fraction of DP thymocytes among transduced cells was determined by electronic gating on GFP. Representative flow profiles of CD4 and CD8 staining are depicted. (H) Percent of DP thymocytes in each sample is depicted after 1 and 2 days of culture. Results above are representative of at least three experiments performed; P values are indicated.
Fig. 4.
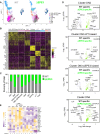
Fig. 4.. sc-RNAseq analysis of ΔEPE3 DN thymocytes shows a markedly altered transcriptome starting at the DN2 stage.
(A) Uniform manifold approximation and projections (UMAP) of clusters identified by sc-RNAseq analysis of DN thymocytes isolated from WT and ΔEPE3 mice. (B) Heatmap representation of genes used to define the clusters. (C) Bar graph illustrating relative proportions of each cluster among DN thymocytes from WT and ΔEPE3 mice. (D) Volcano plots displaying DEGs in DN2, DN3-WT biased, DN3-ΔEPE3 biased, and DN4 clusters. (E) Heatmap representation of expression changes of selected genes, including TCF1 targets, in all clusters.
Fig. 5.
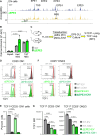
Fig. 5.. NBS and EPEs play distinct roles in regulating TCF1 expression.
(A) ATACseq analysis of chromatin accessibility near the Tcf7 locus in DN thymocytes from WT and ΔEPE3 mice. A 90-kb interval of Chr11 is depicted. (B) ChIP qPCR analysis of Notch binding to the Gapdh, Hes1 NBS, and EPE3-NBS elements. Hes1 serves as a positive control for Notch binding and Gapdh serves as a negative control. ChIP signals for Hes1 and EPE3-NBS were normalized to Gapdh. (C) Schematic to evaluate the effect of ectopic expression of Notch-IC on TCF1 expression and the ability to rescue T cell development in ΔEPE3 progenitor cells. (D and E) The ability of activated Notch to modulate TCF1 expression was assessed by retroviral transduction of WT or ΔEPE3 fetal liver precursors with empty vector (EV; pMiG) or the active intracellular fragment of Notch1 (pMiG-ICN1) after 4 days of culture on OP9-DL1 monolayers. After three additional days of culture, the effect of activated Notch on TCF1 expression was assessed by intracellular flow cytometry on electronically gated GFP+ CD25 DN1 progenitors (D) or CD25+ DN2/3 progenitors (E). The fraction of TCF1low/negative cells in triplicate technical replicate cultures of the CD25 DN1 progenitors above was quantified and depicted graphically as the median ± SD. (F) Representative histograms are depicted. Solid red lines mark the mean peak intensity for the TCF1 in WT control TCF1+ cells. ICN transduction reduces the intensity of intracellular TCF1 staining. (G) The level of TCF1 expression was assessed by determining the MFI of TCF1 by flow cytometry of the TCF1hi fraction of triplicate cultures of both CD25 DN1 and CD25+ DN2/3 progenitors. Results are representative of three experiments performed. P values are shown.
Fig. 6.
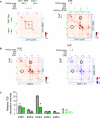
Fig. 6.. Mechanism by which EPEs control the level of TCF1 expression.
(A) Interaction heat maps illustrating H3K27ac Hi-ChIP signals in Rag2−/− pro-B (bottom left) and DN3 (upper right) cells, presented at 1 kb resolution. The region spanning the five EPEs adjacent to the Tcf7 locus is demarcated by dashed box, enlarged in the inset for closer examination on the right. ChIP-seq peaks featured in (A) are indicated on the top of the heatmaps. The right-side magnified map also showcases the H3K27ac peak track derived from H3K27ac Hi-ChIP data. The DN3 specific interaction is annotated by black circle. The scale bars indicate the contact frequency. (B) Interaction heat maps illustrating H3K27ac Hi-ChIP signals within the Tcf7 promoter region in ΔEPE3 (bottom left) and WT (upper right) DN3 cells, presented at 1 kb resolution. The scale bars indicate the contact frequency. The difference map (ΔEPE3 minus WT) for the same region is shown on the right; regions with increased and decreased interactions are colored red and blue, respectively. The scale bar indicates the difference in contact frequency. ChIP-seq peaks featured in (A) are indicated on the top of the heatmaps. Interactions between EPE3 and Tcf7 TSS are indicated by black circles. (C) Bar graphs displaying the relative interactions between Tcf7 TSS and the five E2A peaks in WT and ΔEPE3 DN3, as featured in (A). These interactions were quantified within both WT and ΔEPE3 DN3 cells, with error bars representing the SEM for two replicates.
Fig. 7.
Fig. 7.. Schematic model showing how the EPEs control the level of TCF1 expression depending on the signal received by developing thymocyte precursors.
(A) Diagram shows the potential looping of the E protein regulome in the Tcf7 regulatory region containing five EPEs and TSS. (B) Diagram shows the role of signal induced Id proteins that inactivate E protein binding to the EPEs.

References

    1. Schilham M. W., Wilson A., Moerer P., Benaissa-Trouw B. J., Cumano A., Clevers H. C., Critical involvement of Tcf-1 in expansion of thymocytes1. J. Immunol. 161, 3984–3991 (1998). - PubMed
    1. Verbeek S., Izon D., Hofhuis F., Robanus-Maandag E., te Riele H., van de Watering M., Oosterwegel M., Wilson A., MacDonald H. R., Clevers H., An HMG-box-containing T-cell factor required for thymocyte differentiation. Nature 374, 70–74 (1995). - PubMed
    1. Gounari F., Khazaie K., TCF-1: A maverick in T cell development and function. Nat. Immunol. 23, 671–678 (2022). - PMC - PubMed
    1. Zhao X., Shan Q., Xue H. H., TCF1 in T cell immunity: A broadened frontier. Nat. Rev. Immunol. 22, 147–157 (2022). - PubMed
    1. Johnson J. L., Georgakilas G., Petrovic J., Kurachi M., Cai S., Harly C., Pear W. S., Bhandoola A., Wherry E. J., Vahedi G., Lineage-determining transcription factor TCF-1 initiates the epigenetic identity of T cells. Immunity 48, 243–257.e10 (2018). - PMC - PubMed

MeSH terms

Substances