. 2024 Dec 17;5(12):101830.
doi: 10.1016/j.xcrm.2024.101830. Epub 2024 Nov 26.

Macrophages are activated toward phagocytic lymphoma cell clearance by pentose phosphate pathway inhibition

Affiliations

Macrophages are activated toward phagocytic lymphoma cell clearance by pentose phosphate pathway inhibition

Anna C Beielstein et al. Cell Rep Med. .

Abstract

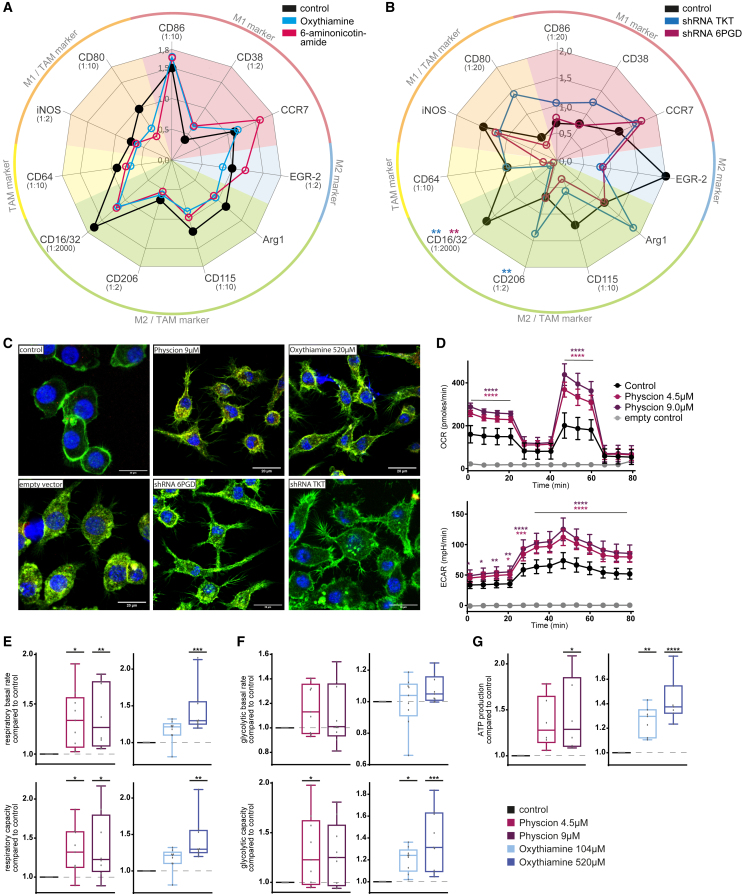
Macrophages in the B cell lymphoma microenvironment represent a functional node in progression and therapeutic response. We assessed metabolic regulation of macrophages in the context of therapeutic antibody-mediated phagocytosis. Pentose phosphate pathway (PPP) inhibition induces increased phagocytic lymphoma cell clearance by macrophages in vitro, in primary human chronic lymphocytic leukemia (CLL) patient co-cultures, and in mouse models. Addition of the PPP inhibitor S3 to antibody therapy achieves significantly prolonged overall survival in an aggressive B cell lymphoma mouse model. PPP inhibition induces metabolic activation and pro-inflammatory polarization of macrophages while it decreases macrophages' support for survival of lymphoma cells empowering anti-lymphoma function. As a mechanism of macrophage repolarization, the link between PPP and immune regulation was identified. PPP inhibition causes decreased glycogen level and subsequent modulation of the immune modulatory uridine diphosphate glucose (UDPG)-Stat1-Irg1-itaconate axis. Thus, we hypothesize the PPP as a key regulator and targetable modulator of macrophage activity in lymphoma to improve efficacy of immunotherapies and prolong survival.

Keywords: ADCP; Irg1; immunotherapy; itaconate; lymphoma; macrophage; metabolic modulation; pentose phosphate pathway; phagocytosis; polarization.


Conflict of interest statement

Declaration of interests The authors declare no competing interests.

Figures

None
Graphical abstract
Figure 1
Figure 1
Metabolic inhibition of the pentose phosphate pathway leads to increased phagocytic rate of macrophages (A) Scheme of ADCP-based metabolic screening approach. (B–D) Summary of ADCP change compared to basal phagocytosis rate of J774A.1 macrophages under inhibition of respective metabolic pathways. (B) Inhibition of only macrophages. (C) Inhibition of only hMB cells. (D) Inhibition of all co-culture components. Technical replicates (B) n = 15–22, (C) n = 15–58, (D) n = 15–28; biological replicates (B) n = 3–5, (C) n = 3–12, (D) n = 3–6. Data are shown as mean ± SEM. p values were calculated using unpaired t test. ∗p < 0.05; ∗∗p < 0.01; ∗∗∗p < 0.001; ∗∗∗∗p < 0.0001. See also Figures S1 and S2.
Figure 2
Figure 2
Cross validation of PPP inhibition in macrophages confirms increased ADCP rates (A–C) ADCP change compared to basal phagocytosis rate of J774A.1 macrophages under inhibition of PPP. (A) Alternative inhibitor physcion of 6-phosphogluconate dehydrogenase (6Pgd) in oxidative part of PPP (red) and p-hydroxyphenylpyruvate for inhibition of transketolase (Tkt) in non-oxidative part of PPP (blue). (B) Using human monocyte cell line THP1 and CD20 antibody obinutuzumab under inhibition of 6Pgd by 6-aminonicotinamide (red) and inhibition of Tkt by oxythiamine (blue). (C) ADCP assay performed under hypoxic conditions and inhibition of 6Pgd by physcion (red) or inhibition of Tkt by oxythiamine (blue). (D) Antibody-independent cellular phagocytosis of hMB cells by J774A.1 macrophages compared to control under inhibition of 6Pgd by 6-aminonicotinamide (left) and physcion (right). (E) ADCP change compared to basal phagocytosis rate of empty vector control J774A.1 macrophages under shRNA-mediated knockdown of 6Pgd (red) and Tkt (blue). (F) ADCP change compared to basal phagocytosis rate of J774A.1 macrophages under supplementation of metabolites of the PPP. Enzyme reactions in focus colored in violet (6Pgd) and blue (Tkt). E4P, erythrose-4-phosphate; F6P, fructose-6-phosphate; G3P, glyceraldehyde-3-phosphate; Glc6P, glucose-6-phosphate; R5P, ribose-5-phosphate; Ru5P, ribulose-5-phosphate; S7P, sedoheptulose-7-phosphate; X5P, xylulose-5-phosphate. Data are shown as mean ± SEM. Technical replicates (A) n = 30, (B) n = 17–25, (C) n = 25–28, (D) n = 30, (E) n = 20–23, (F) n = 13–20; biological replicates (A) n = 6, (B) n = 4–5, (C) n = 5–6, (D) n = 6, (E) n = 4–5, (F) n = 3–4. p values were calculated using one-way ANOVA. ∗p < 0.05; ∗∗p < 0.01; ∗∗∗p < 0.001; ∗∗∗∗p < 0.0001. See also Figures S1 and S3.
Figure 3
Figure 3
PPP inhibition induces pro-inflammatory polarization and activation in macrophages (A and B) Radar plot of surface marker expression of J774A.1 macrophages. Expression of characteristic surface marker for different macrophage subtypes measured by immunofluorescent staining. Mean fluorescence intensity (MFI) is depicted. To improve readability, high MFI has been downscaled (factor named in brackets next to marker). (A) Compound mediated PPP inhibition. (B) shRNA-mediated PPP knockdown. (C) Immunofluorescent microscopy of J774A.1 macrophages under compound-mediated PPP inhibition and shRNA-mediated PPP knockdown. Blue, phalloidin staining of nucleus; green, actin staining of cytoskeleton. (D–G) Measurement of metabolic activity of J774A.1 macrophages under compound-mediated PPP inhibition by Seahorse analysis. Inhibition of non-oxidative part of PPP by oxythiamine, inhibition of oxidative part of PPP by physcion. (D) One representative example of XF Mito Stress test measurement of ECAR und OCR. (E) Respiratory basal rate and capacity. (F) Glycolytic basal rate and capacity. (G) ATP production. Data are shown in (A and B) as mean of four replicates, in (D) as mean of six replicates in one experiment ±SD, and in (E–G) as mean ± 5–95 percentile. Technical replicates (A and B) n = 4, (D) n = 6, (E–G) n = 18–27; biological replicates (A and B) n = 4, (D) n = 1, (E–G) n = 6–9. p values were calculated using one-way ANOVA, (D) using two-way ANOVA. ∗p < 0.05; ∗∗p < 0.01; ∗∗∗p < 0.001; ∗∗∗∗p < 0.0001. See also Figure S4 and Table S1.
Figure 4
Figure 4
PPP inhibition changes the proteomic profile of macrophages towards pro-inflammatory activity (A and B) Volcano plots showing mean change of proteomic transcription under (A) compound-mediated PPP inhibition by 6-aminonicotinamide and oxythiamine compared to untreated J774A.1 macrophages and (B) shRNA-mediated PPP knockdown of 6Pgd and Tkt compared to empty vector control J774A.1 macrophages. Circle size represents number of significantly changed conditions. Red circles: significantly downregulated abundance; green circles: significantly upregulated abundance. Proteins known to participate in immune system are annotated in significant groups. (C and D) Pathway enrichment analysis of (C) proteomics and (D) phosphoproteomics of J774A.1 macrophages under compound-mediated PPP inhibition and shRNA-mediated PPP knockdown. Protein count in listed pathways represented in circle size, mean −log10 p value represented in heatmap analysis. (E and F) Analysis of significantly negative changed protein activity in normalized upstream kinase score (NUKS). (E) Top five most downregulated enzymes in NUKS analysis under shRNA-mediated PPP knockdown of 6Pgd and Tkt and (F) integrative analysis of compound-mediated PPP inhibition by physcion and oxythiamine. (G) Western blot analysis of Ptk2b expression in J774A.1 macrophages under shRNA-mediated PPP knockdown of 6Pgd and Tkt compared to empty vector control. (H) Scheme of hypothesized mechanism leading to pro-inflammatory phenotype of macrophages. In (G) data are shown as mean ± SEM. Technical replicates (A–F) n = 1, (G) n = 5; biological replicates (A–F) n = 3, (G) n = 5. p values in (G) were calculated using one-way ANOVA. ∗p < 0.05; ∗∗p < 0.01; ∗∗∗p < 0.001; ∗∗∗∗p < 0.0001. See also Tables S2–S5.
Figure 5
Figure 5
PPP inhibition modulates glycogen metabolism and the immune response signaling axis UDPG-Stat1-Irg1-itaconate of macrophages (A) Total glycogen amount in J774A.1 macrophages under compound-mediated PPP inhibition and shRNA-mediated knockdown of 6Pgd and Tkt. (B) Western blot analysis of protein expression of hypothesized connecting pathway in J774A.1 macrophages under shRNA-mediated knockdown of 6Pgd and Tkt compared to empty vector control. Mean expression displayed in bar graph analysis and one representative western blot example. (C) Scheme of working hypothesis of PPP metabolism modulating immune response. (D) Amount of 6pgd product ribulose-5-phosphate and Tkt product sedoheptulose-7-phosphate under shRNA-mediated inhibition of 6pgd and Tkt in J774A1 macrophages. (E) Metabolomic analysis of tricarboxylic acid cycle and citrate metabolism with display of enzyme expression of key enzymes under shRNA-mediated PPP knockdown of 6Pgd and Tkt compared to empty vector control J774A.1 macrophages. Amount of metabolites displayed in box and whiskers. Change in enzyme expression displayed in bar graphs. Genes: succinate dehydrogenase (Sdh), ATP citrate lyase (Acly), immunoregulatory gene 1 (Irg1 = Acod1). (F and G) Cytokine expression under 6Pgd inhibition by 6-aminonicotinamide or physcion and Tkt inhibition by oxythiamine in J774A.1 macrophages. (F) IL-6 expression compared to untreated control. (G) IL-10 expression compared to untreated control. (H) ADCP assay of bone marrow-derived macrophages of Irg1+/+ wild-type mice and Irg1−/− knockout mice. Macrophages differentiated out of femoral bone marrow with M-CSF. In (A), (B), and (F–H), bar plots are shown as mean ± SEM; in (D and E) metabolite amount is shown as minimum to maximum and protein expression is shown as calculated −Log2 fold change of control and knockdown macrophages. Technical replicates (A) n = 15, (B) n = 3–6, (D) n = 3, (E) n = 3, (F and G) n = 9–18, (H) n = 35; biological replicates (A) n = 3, (B) n = 3–6, (D) n = 3, (E) n = 3, (F and G) n = 3–6, (H) n = 7. p values were calculated in (A, B, D, and E) using one-way ANOVA, protein expression in (E) using student’s t test, and in (F–H) using unpaired t test. ∗p < 0.05; ∗∗p < 0.01; ∗∗∗p < 0.001; ∗∗∗∗p < 0.0001. See also Figures S4 and S5 and Tables S6 and S7.
Figure 6
Figure 6
PPP inhibition in primary human cells increases phagocytic capacity of macrophages and decreases their tumor-supportive bystander function (A and B) ADCP change compared to basal phagocytosis rate of human monocyte-derived macrophages. (A) ADCP change of monocyte-derived macrophages differentiated in the presence of physcion and M-CSF, (B) ADCP change of monocyte-derived macrophages differentiated in the presence of oxythiamine and M-CSF. (C and D) Cytokine expression of monocyte-derived macrophages differentiated in the presence of oxythiamine and M-CSF. (C) IL-6 expression, (D) IL-10 expression. (E and F) ADCP change of J774A.1 macrophages phagocyting primary CLL patient cells compared to basal phagocytosis rate. (E) ADCP change under compound-mediated PPP inhibition. (F) ADCP change under shRNA-mediated PPP knockdown. (G) ADCP change of monocyte-derived macrophages differentiated in the presence of oxythiamine and M-CSF phagocyting primary CLL patient cells compared to basal phagocytosis rate. (H) Viability of primary CLL patient cells after incubation with PPP inhibitors physcion or oxythiamine in mono-culture and in co-culture with J774A.1 macrophages. In co-culture setting, cells were treated in parallel or macrophages were pre-treated before onset of co-culture. (I–L) Half maximal inhibitory concentration (IC50) for individual primary CLL patient cell samples to bendamustine treatment compared to control. Cells were incubated with bendamustine after protective macrophage co-culture with untreated J774A.1 macrophages vs. PPP inhibition. (I and J) Inhibition of 6Pgd in oxidative part of PPP by physcion, (I) co-culture treatment, (J) macrophage pre-treatment. (K and L) Inhibition of Tkt in non-oxidative part of PPP by oxythiamine, (K) co-culture treatment, (L) macrophage pre-treatment. In (A–H) data are shown as mean ± SEM, in (I–L) as minimum to maximum. Technical replicates (A) n = 28, (B) n = 20, (C and D) n = 18, (E and F) n = 20, (G) n = 65, (H) n = 30, (I–L) n = 30; biological replicates (A) n = 6, (B) n = 4, (C and D) n = 6, (E and F) n = 5, (G) n = 12, (H) n = 10, (I–L) n = 10. p values were calculated in (A–G) using one-way ANOVA, in (H) using repeated measures (RM) one-way ANOVA, and in (I–L) using paired t test. ∗p < 0.05; ∗∗p < 0.01; ∗∗∗p < 0.001; ∗∗∗∗p < 0.0001. See also Figure S6.
Figure 7
Figure 7
PPP inhibition increases myelopoiesis, macrophages’ maturation, and pro-inflammatory polarization in vivo and boosts anti-leukemic treatment response in an aggressive humanized lymphoma mouse model (A) Progenitor cell compartment LSK (Lin, Sca-1+, c-Kit+) in bone marrow of C57BL/6J mice treated with vehicle (control) or PPP inhibitor S3 i.p. for 7 days. (B) Multipotent progenitor (MPP) subsets in bone marrow of C57BL/6J mice treated with vehicle (control) or PPP inhibitor S3 intraperitoneally (i.p.) for 7 days. HSC (CD34, CD48, CD150+, CD135-), MPP1 (CD34+, CD48, CD150+, CD135-), MPP2 (CD34+, CD48+, CD150+, CD135-), MPP3 (CD34+, CD48+, CD150-, CD135-), MPP4 (CD34+, CD48+, CD150-, CD135+), MPP5 (CD34+, CD48, CD150-, CD135-). (C) Percentage of myeloid lineage cells of whole cell amount in bone marrow of NSG mice transfected with hMB cells, treated with vehicle or PPP inhibitor S3 i.p. for 12 days, and euthanized on day 15. Common myeloid progenitor cells (CD41+, CD34+), monocytes (Ly6c+, CX3CR1+), macrophages (F4/80+, CD64+). (D) Expression of characteristic surface marker for different macrophage subtypes on peritoneal macrophages measured by immunofluorescent staining. Mean fluorescence intensity (MFI) is depicted. To improve readability, high MFI has been downscaled (factor named in brackets next to marker). C57BL/6J mice treated with vehicle (control) or PPP inhibitor S3 i.p. for 7 days. (E) ADCP assay of bone marrow-derived macrophages. C57BL/6J mice treated with vehicle (control) or PPP inhibitor S3 i.p. for 7 days, macrophages differentiated out of femoral bone marrow with M-CSF. (F) Survival curve of aggressive lymphoma (hMB) bearing mice treated with PPP inhibitor S3 +/− therapeutic antibody alemtuzumab. (G) One representative example of immunohistochemical staining of hMB cells (CD19+) and macrophages (CD68+) in spleen of aggressive lymphoma (hMB) bearing mice treated with vehicle or alemtuzumab + S3. In (A–C and E) data are shown as mean ± SEM, in (D) data are shown as mean of ten replicates. Technical replicates (A and B) n = 12, (C) n = 3, (D) n = 9–10, (E) n = 70–75, (F) n = 21–25, (G) n = 4; biological replicates (A and B) n = 12, (C) n = 3, (D) n = 9–10, (E) n = 14–15, (F) n = 21–25, (G) n = 4. p values were calculated in (A–E) using unpaired t test and in (F) using Benjamini-Hochberg test. ∗p < 0.05; ∗∗p < 0.01; ∗∗∗p < 0.001; ∗∗∗∗p < 0.0001. See also Figure S7 and Table S8.

References

    1. Hanahan D., Weinberg R.A. Hallmarks of cancer: the next generation. Cell. 2011;144:646–674. doi: 10.1016/j.cell.2011.02.013. - DOI - PubMed
    1. Beielstein A.C., Pallasch C.P. Tumor Metabolism as a Regulator of Tumor-Host Interactions in the B-Cell Lymphoma Microenvironment-Fueling Progression and Novel Brakes for Therapy. Int. J. Mol. Sci. 2019;20:4158. - PMC - PubMed
    1. Cassetta L., Pollard J.W. Targeting macrophages: Therapeutic approaches in cancer. Nat. Rev. Drug Discov. 2018;17:887–904. - PubMed
    1. Yang L., Zhang Y. Tumor-associated macrophages: from basic research to clinical application. J. Hematol. Oncol. 2017;10:58. - PMC - PubMed
    1. Pallasch C.P., Leskov I., Braun C.J., Vorholt D., Drake A., Soto-Feliciano Y.M., Bent E.H., Schwamb J., Iliopoulou B., Kutsch N., et al. Sensitizing protective tumor microenvironments to antibody-mediated therapy. Cell. 2014;156:590–602. doi: 10.1016/j.cell.2013.12.041. - DOI - PMC - PubMed

MeSH terms

LinkOut - more resources