. 2025 Jan:91:102076.
doi: 10.1016/j.molmet.2024.102076. Epub 2024 Nov 25.

Modulation of stress-related behaviour by preproglucagon neurons and hypothalamic projections to the nucleus of the solitary tract

Affiliations

Modulation of stress-related behaviour by preproglucagon neurons and hypothalamic projections to the nucleus of the solitary tract

Marie K Holt et al. Mol Metab. 2025 Jan.

Abstract

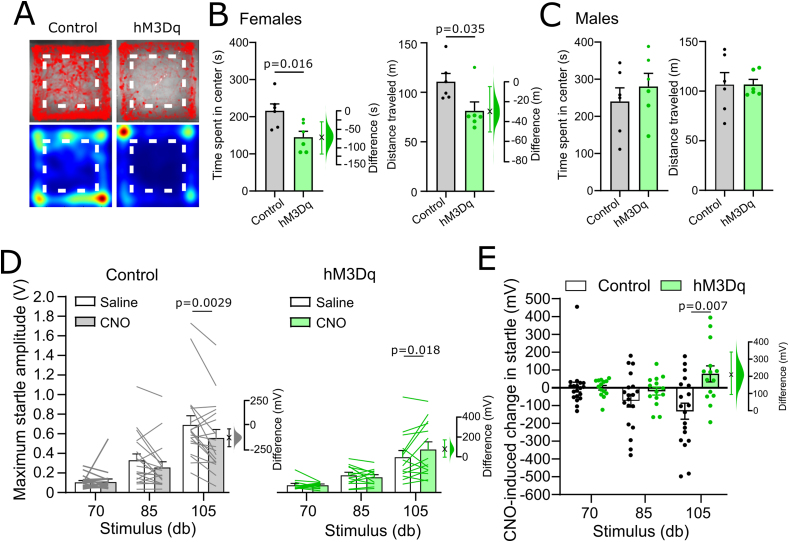
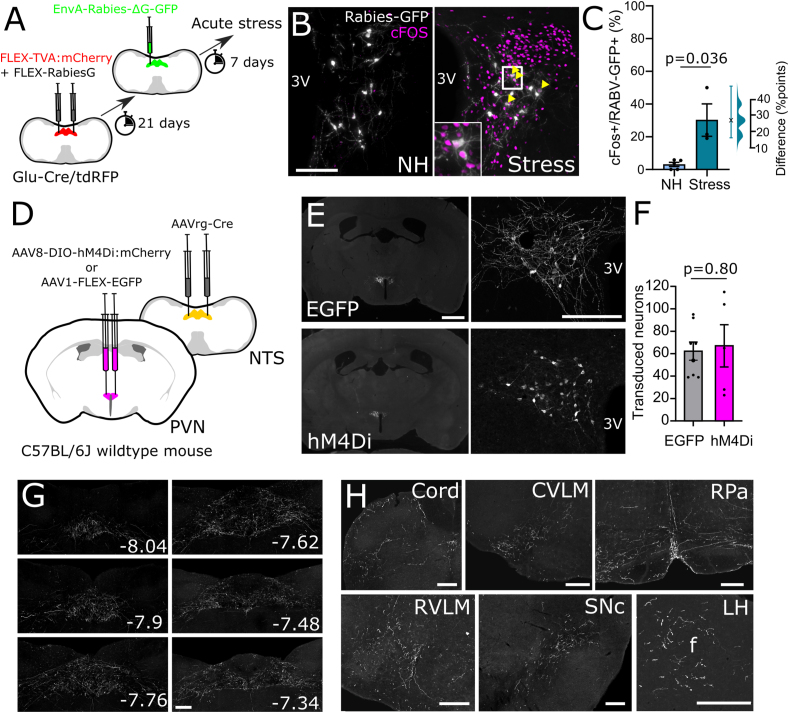
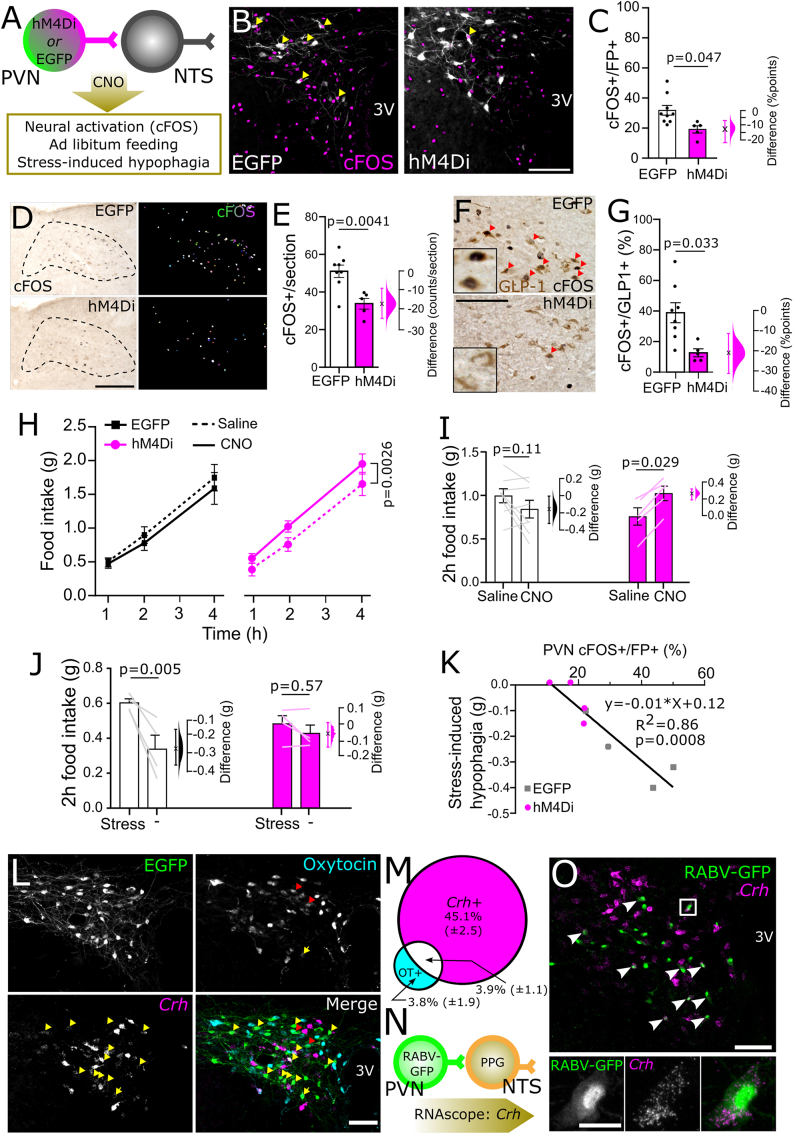
Stress-induced behaviours are driven by complex neural circuits and some neuronal populations concurrently modulate diverse behavioural and physiological responses to stress. Glucagon-like peptide-1 (GLP-1)-producing preproglucagon (PPG) neurons within the lower brainstem caudal nucleus of the solitary tract (cNTS) are particularly sensitive to stressful stimuli and are implicated in multiple physiological and behavioural responses to interoceptive and psychogenic threats. However, the afferent inputs driving stress-induced activation of PPG neurons are largely unknown, and the role of PPG neurons in anxiety-like behaviour is controversial. Through chemogenetic manipulations we reveal that cNTS PPG neurons have the ability to moderately increase anxiety-like behaviours in mice in a sex-dependent manner. Using an intersectional approach, we show that input from the paraventricular nucleus of the hypothalamus (PVN) drives activation of both the cNTS as a whole and PPG neurons in particular in response to acute restraint stress, but that while this input is rich in corticotropin-releasing hormone (CRH), PPG neurons do not express significant levels of receptors for CRH and are not activated following lateral ventricle delivery of CRH. Finally, we demonstrate that cNTS-projecting PVN neurons are necessary for the ability of restraint stress to suppress food intake in male mice. Our findings reveal sex differences in behavioural responses to PPG neural activation and highlight a hypothalamic-brainstem pathway in stress-induced hypophagia.

Keywords: Acute stress; Anxiety-like behaviour; Appetite; Corticotropin releasing hormone; Glucagon-like peptide-1; Nucleus of the solitary tract.


Conflict of interest statement

Declaration of competing interest The authors declare that they have no known competing financial interests or personal relationships that could have appeared to influence the work reported in this paper.

Figures

Figure 1
Figure 1
Selective and efficient chemogenetic activation of cNTS PPG neurons in vivo. A) Schematic of injection protocol. B) Representative images of RNAscope in situ hybridisation for Ppg mRNA (yellow) and immunolabelling for mCherry (to detect hM3Dq:mCherry, red) in tissue from one Glu-Cre/tdRFP mice injected with AAV8-DIO-hM3Dq:mCherry. Scale bars: 100 μm. C) Percent of Ppg-expressing neurons in the cNTS also expressing hM3Dq:mCherry (efficiency), as well as percent of mCherry-expressing cNTS neurons also expressing Ppg (selectivity). Results from control mice (expressing mCherry only, n = 2) are indicated with black circles, while results from hM3Dq-expressing mice (n = 2) are indicated with green triangles. D) Representative images of immunohistochemical labelling for cFOS (black nuclear label) and dsRed (brown cytoplasmic label, detecting mCherry and tdRFP) in mice expressing mCherry only (control, top panels) or hM3Dq:mCherry (hM3Dq, bottom panels) injected with saline (2 ml/kg, left panels) or CNO (2 mg/kg, 2 ml/kg; right panels). Scale bar: 100 μm. E) Percent of mCherry-expressing cNTS neurons also labelled for cFOS in control (grey/black) and hM3Dq-expressing (green) mice injected with saline (2 ml/kg, pattern) or CNO (2 mg/kg, filled). Data from females are indicated by circles; males are indicated by triangles. Also shown is Gardner-Altman estimation plot showing the mean difference in activated neurons between saline and CNO-injected hM3Dq-expressing mice. Two-way drug × virus interaction: F(1,32) = 138.9, p < 0.0001. (For interpretation of the references to color in this figure legend, the reader is referred to the Web version of this article.)
Figure 2
Figure 2
Meal pattern analysis of chow intake following chemogenetic activation of cNTS PPG neurons in vivo. A) Cumulative chow intake over the first 6 h of the dark phase of male and female control (black squares) and hM3Dq-expressing mGlu-Cre/tdRFP mice (green circles) following i.p. injection of either saline (dashed lines, 2 ml/kg) and CNO (solid lines, 2 mg/kg, 2 ml/kg). Three-way drug x time × virus interaction: F(5,110) = 3.628, p = 0.0045. B) Cumulative chow intake of females only. Three-way drug x time × virus interaction: F(5,70) = 6.889, p < 0.0001. Two-way drug x time (hM3Dq): F(5,35) = 9.625, p < 0.0001. Two-way drug x time (control): F(1.499, 10.49) = 0.8945, p = 0.4088. C) Cumulative chow intake of males only. Three-way drug x time × virus interaction: F(5,75) = 0.7909, p = 0.5595. Main effect of time [F(1.429, 21.43) = 436.3, p < 0.0001]. D) Chow intake by male and female mice 1 h after dark onset [drug x virus: F(1, 32) = 13.17; p = 0.0010]. E) Latency of male and female mice to begin feeding [drug x virus: F(1, 32) = 7.058, p = 0.0122]. F) Size of the first meal in male and female mice [drug x virus: F(1, 32) = 7.895; p = 0.0084]. G) Average meal size over the first 6 h grouped by sex in control (white bars) and hM3Dq-expressing mice (green bars) injected with saline (2 ml/kg) or CNO (2 mg/kg, 2 ml/kg). Three-way drug x virus × sex interaction: F(1, 30) = 4.882; p = 0.0349; two-way drug x virus (females): F(1, 15) = 11.11, p = 0.0045; two-way drug x virus (males): F(1, 15) = 0.01089, p = 0.9183). H) No significant change in bodyweight of control (black) or hM3Dq-expressing mice (green) 24 h after injection of saline (2 ml/kg) or CNO (2 mg/kg, 2 ml/kg) [virus x drug: F(1, 32) = 0.4636, p = 0.5008]. The difference in the relevant outcome between saline and CNO-injected hM3Dq-expressing mice is shown in D-H using Gardner-Altman estimation plots. (For interpretation of the references to color in this figure legend, the reader is referred to the Web version of this article.)
Figure 3
Figure 3
Chemogenetic activation of cNTS PPG neurons is sufficient to elicit moderate increases in anxiety-like behaviour. A) Traces and heatmaps from a representative control (left) and hM3Dq-expressing mouse (right) recorded in the open field following injection of CNO (2 mg/kg, 2 ml/kg). The centre of the arena is outlined using a dashed line. B–C) Quantification of time spent in the centre of the open field (left) and the total distance travelled (right) in female (B) and male (C) control (white bars) and hM3Dq-expressing mice (green bars). Student's T-test: females, centre time: t = 2.912, df = 10; females, distance: t = 2.438, df = 10; males, centre time: t = 0.7911, df = 10; males, distance: t = 0.003524, df = 10. D) Maximum acoustic startle amplitude of control (grey/white) and hM3Dq-expressing (green) male and female mice (combined due to no sex difference [Fig. S3]) following injection of saline (2 ml/kg) or CNO (2 mg/kg, 2 ml/kg). Three-way drug x virus × db interaction: F(2, 62) = 5.233; p = 0.0079. Two-way drug × db interaction (control): F(2, 36) = 3.435; p = 0.0431. Two-way drug × db interaction (hM3Dq): F(2, 26) = 3.904; p = 0.0329. E) CNO-induced startle calculated as the difference in startle between injection of saline and CNO for each animal. Control mice: black circles, white bars; hM3Dq-expressing mice: green circles, green bars. Two-way virus × db interaction: F(2, 62) = 5.233; p = 0.0079. Also shown in B), D) and E) is the effect size using a Gardner-Altman estimation plot. (For interpretation of the references to color in this figure legend, the reader is referred to the Web version of this article.)
Figure 4
Figure 4
Identification and transduction of a stress-activated PVN→NTS circuit targeting PPG neurons. A) Diagram showing strategy to label stress-activated monosynaptic input from the PVN to cNTS PPG neurons. B) GFP immunofluorescence (greyscale) in the PVN 7 days after unilateral microinjection of (EnvA)-RABV-ΔG-GFP targeted to the cNTS. cFOS immunoreactivity (magenta nuclei, pseudocolour) and RABV-GFP immunofluorescence (greyscale) is shown in a representative non-handled mouse (NH, left) and in a mouse perfused 90 min after the onset of 30 min restraint stress (Stress, right). Scale bar: 100 μm. C) Calculated percentage of RABV-GFP labelled cells that were also cFOS-positive in nonhandled mice (-, n = 5) vs mice exposed to 30 min restraint stress (n = 3). Mann–Whitney U test: t = 3.203, df = 5. Also shown is the difference between EGFP and hM4Di-expressing mice in the percentage of RABV-GFP labelled cells activated to express cFOS using a Gardner-Altman estimation plot. D) Schematic illustrating the intersectional approach for targeting of NTS-projecting PVN neurons to induce Cre-dependent expression of EGFP or hM4Di. E) Representative images at low (left, scale bar: 1 mm) and high magnification (right, scale bar: 200 μm) of immunolabelling for EGFP (top) or hM4Di:mCherry (bottom) in NTS-projecting PVN neurons. 3V: third ventricle. F) Similar numbers of NTS-projecting PVN neurons transduced to express either EGFP or hM4Di:mCherry. G) Representative images of PVN-derived, EGFP-labelled axons throughout the cNTS in mice expressing EGFP in NTS-projecting PVN neurons. Scale bar: 100 μm. Numbers indicate distance from bregma in mm. H) Additional axon collateral targets of NTS-projecting PVN neurons. Cord: spinal cord, CVLM: caudal ventrolateral medulla, RPa: raphe pallidus, RVLM: rostral ventrolateral medulla, SNc: substantia nigra pars compacta, LH: lateral hypothalamus. Scale bars: 100 μm.
Figure 5
Figure 5
Chemogenetic inhibition of NTS-projecting PVN neurons. A) Diagram of the experimental paradigm for chemogenetic inhibition of NTS-projecting PVN neurons. B) cFOS immunoreactivity (magenta nuclei, pseudocolour) and EGFP or mCherry immunofluorescence (greyscale) labelling in the PVN of a representative control mouse (left, EGFP) and a representative hM4Di-expressing mouse (right, hM4Di) after i.p. injection of CNO (2 mg/kg, 2 ml/kg) followed by 30 min restraint stress. 3V: third ventricle. Scale bar: 100 μm. C) Calculated percentage of EGFP- vs. hM4Di:mCherry-expressing (fluorescent protein, FP+) cells that were also cFOS-positive in mice after i.p. injection of CNO (2 mg/kg, 2 ml/kg) followed by exposure to an acute stressor (novel environment or restraint stress). Unpaired T-test: t = 2.498, df = 6. D) Representative images of cFOS-immunoreactivity in the cNTS of mice expressing EGFP (top) or hM4Di (bottom) in NTS-projecting PVN neurons. Counted cFOS-immunoreactive cells indicated with rainbow-coloured mask to the right. All mice were injected with CNO (2 mg/kg, 2 ml/kg) and then exposed to novel environment or restraint stress. Scale bar: 100 μm. E) Counts of cFOS-immunoreactive nuclei in the cNTS in mice expressing EGFP or hM4Di in NTS-projecting PVN neurons and injected with CNO (2 mg/kg, 2 ml/kg) prior to stress exposure. Unpaired T-test: t = 3.603, df = 11. F) cFOS- and GLP-1-immunoreactivity in the cNTS of mice expressing EGFP (top) or hM4Di (bottom) in NTS-projecting PVN neurons and injected with CNO (2 mg/kg, 2 ml/kg) prior to stress exposure. Scale bar: 100 μm. G) Calculated percentage of GLP-1-immunoreactive cells in the cNTS that were also cFOS-IR. Unpaired T-test: t = 2.766, df = 6. H) Cumulative chow intake over 4 h after dark onset in mice expressing EGFP or hM4Di in NTS-projecting PVN neurons after injection with saline (2 ml/kg; dashed lines) or CNO (2 mg/kg, 2 ml/kg; solid lines). I) Chow intake over the first 2 h of dark phase in mice expressing EGFP or hM4Di in NTS-projecting PVN neurons after injection with saline (2 ml/kg) or CNO (2 mg/kg, 2 ml/kg). J) Chow intake during the first 2 h of dark onset of mice expressing EGFP or hM4Di in NTS-projecting PVN neurons and injected with CNO (2 mg/kg, 2 ml/kg) prior to 30 min restraint stress. Virus × stress interaction: F(1, 6) = 7.805, p = 0.0314. K) The relationship between activation of NTS-projecting PVN neurons and stress-induced hypophagia. The effect of stress on 2 h food intake in mice expressing EGFP (grey squares) or hM4Di (magenta circles) in NTS-projecting PVN neurons is plotted against the percentage of cFOS-positive NTS-projecting PVN neurons. L) Representative images of RNAscope in situ hybridisation for Crh (magenta in merged image) combined with immunolabelling for GFP (green in merged image) and oxytocin (cyan in merged image) in the PVN of mice expressing GFP in NTS-projecting PVN neurons. Scale bar: 100 μm. Yellow arrowheads indicate Crh-positive EGFP-labelled neurons; red arrows indicate oxytocin-positive EGFP-labelled neurons; yellow arrows indicate EGFP-labelled neurons positive for both Crh and oxytocin. M) Percentage of NTS-projecting PVN neurons expressing Crh and/or oxytocin (OT+). N = 3 mice, 2 sections containing the PVN from each mouse. N) Diagram illustrating RNAscope in situ labelling for Crh in cells with direct projections to NTS PPG neurons (RABV-GFP labelled). O) RNAscope in situ hybridisation for Crh in PPG-projecting PVN neurons (RABV-GFP labelled). Scale bar top panel: 100 μm. White arrowheads indicate Crh-positive RABV-GFP labelled neurons. Bottom panel: higher magnification image of inset in top panel. Scale bar: 20 μm. Gardner-Altman estimation plots in panels C, E, G, I, and J display estimated effect sizes for each assessed parameter. (For interpretation of the references to color in this figure legend, the reader is referred to the Web version of this article.)
Figure 6
Figure 6
CRH input to the NTS. A) Diagram showing injection of retrogradely transported AAV into the NTS of CRH-ires-Cre mice. B) tdTomato immunolabelling in the NTS injection site and surrounding nuclei. C) tdTomato immunolabelling in multiple brain regions, including two levels of the PVN, 21 days after injection into the NTS. D) tdTomato (magenta) and cFOS (grayscale pseudocolour) in the PVN of nonhandled (NH) and stressed mice. E) Percentage of tdTomato-expressing cells in the PVN that were also cFOS-IR in nonhandled mice (NH, N = 2M, 1F) or mice exposed to acute restraint (N = 2M, 1F). Males depicted in triangles and females in circles. Unpaired T-tests with Bonferroni correction: Bar: t = 9.780, df = 4; lPAG: t = 1.866, df = 4; PSTh: t = 5.934, df = 4; PVN: t = 6.423, df = 4. Scale bar: 100 μm; AP: area postrema, PSol: parasolitary nucleus, Bar: Barrington's nucleus, PSTh: parasubthalamic nucleus, lPAG: lateral periaqueductal grey; CeA: central amygdala, CeL: lateral part of the central amygdala, CeM: medial part of the central amygdala, opt: optic tract, 3V: third ventricle.
Figure 7
Figure 7
Actions of CRH on NTS PPG neurons in male and female mice. A) Diagram of the experimental paradigm for delivery of exogenous CRH (1 μg in 1 μl saline) to the lateral ventricle of mGlu-Venus mice. B) Traces (top) and heatmaps (bottom) recorded in the open field following injection of either saline (left) or CRH (right) into the lateral ventricle. The center of the arena is outlined using a dashed line. C-D) Quantification of the total distance traveled (C) and time spent in the center of the open field (D) of saline and CRH-injected mice. Two-way ANOVA (distance traveled): F(1,8) = 0.95, p = 0.36; main effect of sex: F (1, 8) = 2.536, p = 0.15; main effect of drug: F (1, 8) = 332.5, p < 0.0001. Two-way ANOVA (centre time): F(1, 8) = 1.700, p = 0.23; main effect of sex: F(1, 8) = 0.90, p = 0.37; main effect of drug: F(1, 8) = 34.35, p = 0.0004. E) cFOS IF at two bregma levels of the cNTS after saline (left) or CRH (right). F) Numbers of cFOS-IR neurons per cNTS section in mice treated with either saline or CRH. Two-way drug × sex interaction: F(1,8) = 1.100, p = 0.32; main effect of sex: F(1, 8) = 0.2764, p = 0.61; main effect of drug: F(1,8) = 47.49, p = 0.0001. G) Representative images of immunolabelling for YFP (representing PPG, green), tyrosine hydroxylase (TH, magenta) and cFOS (grayscale) in the cNTS of mGlu-YFP mice injected with saline (left) or CRH (right) into the lateral ventricle. H-J) Percentage of YFP-IR PPG neurons (H) or TH-IR neurons (I) that are also cFOS-IR in the cNTS of mice treated with either saline or CRH. Two-way drug × sex interaction (cNTSPPG neurons): F(1, 8) = 0.5462; p = 0.48; main effect of sex: F(1,8) = 6.986, p = 0.03; main effect of drug: F(1, 8) = 1.428, p = 0.27. Two-way drug × sex interaction (TH): F(1,8) = 0.1571; p = 0.70; main effect of sex: F(1, 8) = 10.58, p = 0.012; main effect of drug: F(1,8) = 14.16, p = 0.0055. J) RNAscope for Crhr2 in the cNTS (top), area postrema (AP, bottom), and ventral lateral septum (vLS). Entire figure: N = 3F,3M in each group with males depicted in triangles and females in circles. K) FISH for Crhr1 in the cNTS and neighbouring gracile nucleus (top panel); GFP-IR PPG neurons (green) and FISH for Crhr1 (magenta) in the cNTS (bottom panel). Blue arrowheads indicate Crhr1-positive cells, yellow arrow indicates a single double-labelled neuron. Scale bars = 100 μm. (For interpretation of the references to color in this figure legend, the reader is referred to the Web version of this article.)
Figure S1
Figure S1
Relating toFigure 1. A) Immunolabelling for tdRFP (dsRed, red) and RNAscope in situ hybridisation for Ppg mRNA (yellow) in the cNTS of naïve Glu-Cre/tdRFP transgenic mice showing robust Ppg expression in tdRFP-positive cells with no discernible expression in non-Ppg cells in the cNTS. Scale bars: 100 μm. B) immunolabelling for mCherry (detecting hM4Di:mCherry only, magenta) and dsRed (detecting both hM4Di:mCherry and tdRFP, green) in Glu-Cre/tdRFP mice injected with AAV8-hSyn-DIO-hM3Dq:mCherry. Student's T-test: p = 0.66. C) Validation of selectivity of the mCherry antibody. Glu-Cre/tdRFP transgenic mice were injected into the cNTS, but not the intermediate reticular nucleus (IRT), which contains another population of PPG neurons, with AAV8-hSyn-DIO-hM3Dq:mCherry. Anti-dsRed labelling (detecting both mCherry and tdRFP, AlexaFluor-488 secondary) was seen in both the cNTS and IRT, while anti-mCherry (detecting mCherry only, AlexaFluor-647) labelling was only seen in the cNTS, where hM3Dq:mCherry was expressed. D) Data from Figure 1E grouped by sex. Percent of mCherry-expressing cNTS neurons also labelled for cFOS in male and female control mice (grey/black) and hM3Dq-expressing mice (green) injected with saline (2 ml/kg, striped) or CNO (2 mg/kg, solid) expressing mCherry only or hM3Dq:mCherry (hM3Dq) after being injected with saline (2 ml/kg) or CNO (2 mg/kg, 2 ml/kg). Gardner-Altman estimation plots display the estimated effect sizes. There was no three-way interaction of virus x drug x sex [F(1, 28) = 2.151; p = 0.1537].
Figure S2
Figure S2
Relating toFigure 2. Meal pattern data grouped by sex in control mice (black) and hM3Dq-expressing mice (green) following injection of saline (2 ml/kg) or CNO (2 mg/kg, 2 ml/kg). A) One hour food intake; no three-way drug x sex × virus interaction [F(1, 30) = 0.05197; p = 0.8212]. B) Latency to first meal; no three-way drug x sex × virus interaction [F(1, 30) = 0.05197; p = 0.8212]. C) First meal size; no three-way drug x sex × virus interaction [F(1, 30) = 8.890e-005; p = 0.9925]. D) Number of meals over the first 6 h of the dark phase; no three-way drug x sex × virus interaction: F(1,30) = 0.009932, p = 0.9213. E) Average inter-meal interval over the first 6 h of the dark phase; no three-way drug x sex × virus interaction: F(1,30) = 0.009742, p = 0.9220; no main effects F) Change in body weight 24 h after CNO or saline injection; no three-way drug x sex × virus interaction [F(1,30) = 0.008697, p = 0.9263] and no main effects. G) Average meal duration over the first 6 h of the dark phase; no three-way drug x sex × virus interaction: F(1,30) = 0.9161, p = 0.3461; no main effects. H) Average rate of consumption over the first 6 h of the dark phase; no three-way drug x sex × virus interaction: F(1,30) = 2.811, p = 0.1040; no main effects.
Figure S3
Figure S3
Relating toFigure 3. Acoustic startle results in female and male mice. A) Treatment effects on acoustic startle calculated as the within-subjects difference in startle amplitude in mice after injection of saline vs. CNO. No three-way drug x sex × virus interaction [F(2,58 = 0.721, p = 0.491].
Figure S4
Figure S4
Relating toFigure 4. A) Representative image of RABV-GFP labelling (green) and dsRed-positive cells (magenta) expressing TVA receptor and/or tdRFP within the NTS. Scale bar: 100 μm. B) RABV-GFP labelling in the PVN following monosynaptic tracing from PPG neurons. Scale bar: 100 μm. C) No detectable axon collaterals within the median eminence arising from NTS-projecting PVN neurons. Scale bars: 100 μm.

References

    1. Holt M.K., Trapp S. The physiological role of the brain GLP-1 system in stress. Cogent Biology. 2016;2 doi: 10.1080/23312025.2016.1229086. - DOI - PMC - PubMed
    1. Myers B., Scheimann J.R., Franco-Villanueva A., Herman J.P. Ascending mechanisms of stress integration: Implications for brainstem regulation of neuroendocrine and behavioral stress responses. Neurosci Biobehav Rev. 2017;74:366–375. doi: 10.1016/j.neubiorev.2016.05.011. - DOI - PMC - PubMed
    1. Ulrich-Lai Y.M., Herman J.P. Neural regulation of endocrine and autonomic stress responses. Nat Rev Neurosci. 2009;10:397–409. http://www.nature.com/nrn/journal/v10/n6/suppinfo/nrn2647_S1.html - PMC - PubMed
    1. Bains J.S., Cusulin J.I.W., Inoue W. Stress-related synaptic plasticity in the hypothalamus. Nat Rev Neurosci. 2015;16:377–388. doi: 10.1038/nrn3881. - DOI - PubMed
    1. Itoi K., Sugimoto N. The brainstem noradrenergic systems in stress, anxiety and Depression. J Neuroendocrinol. 2010;22:355–361. doi: 10.1111/j.1365-2826.2010.01988.x. - DOI - PubMed

LinkOut - more resources