. 2025 Jan 22;35(1):31-42.
doi: 10.1101/gr.279667.124.

Analysis of a cell-free DNA-based cancer screening cohort links fragmentomic profiles, nuclease levels, and plasma DNA concentrations

Affiliations

Analysis of a cell-free DNA-based cancer screening cohort links fragmentomic profiles, nuclease levels, and plasma DNA concentrations

Yasine Malki et al. Genome Res. .

Abstract

The concentration of circulating cell-free DNA (cfDNA) in plasma is an important determinant of the robustness of liquid biopsies. However, biological mechanisms that lead to inter-individual differences in cfDNA concentrations remain unexplored. The concentration of plasma cfDNA is governed by an interplay between its release and clearance. We hypothesized that cfDNA clearance by nucleases might be one mechanism that contributes toward inter-individual variations in cfDNA concentrations. We performed fragmentomic analysis of the plasma cfDNA from 862 healthy individuals, with a cfDNA concentration range of 1.61-41.01 ng/mL. We observed an increase in large DNA fragments (231-600 bp), a decreased frequencies of shorter DNA fragments (20-160 bp), and an increased frequency of G-end motifs with increasing cfDNA concentrations. End motif deconvolution analysis revealed a decreased contribution of DNASE1L3 and DFFB in subjects with higher cfDNA concentration. The five subjects with the highest plasma DNA concentration (top 0.58%) had aberrantly decreased levels of DNASE1L3 protein in plasma. The cfDNA concentration could be inferred from the fragmentomic profile through machine learning and was well correlated to the measured cfDNA concentration. Such an approach could infer the fractional DNA concentration from particular tissue types, such as the fetal and tumor fraction. This work shows that individuals with different cfDNA concentrations are associated with characteristic fragmentomic patterns of the cfDNA pool and that nuclease-mediated clearance of DNA is a key parameter that affects cfDNA concentration. Understanding these mechanisms has facilitated the enhanced measurement of cfDNA species of clinical interest, including circulating fetal and tumor DNA.


Figures

Figure 1.
Figure 1.
Overview of the study design. The plasma cfDNA concentration of all 862 individuals from the study cohort was measured. The fragmentomic features of the cfDNA were analyzed, including the size profile and end motif distributions. The contribution of nucleases was explored using the cleavage profile end motif patterns, and protein quantification of DNASE1L3 in plasma. A machine learning model was trained using fragmentomic features to predict cfDNA concentration. We further explored whether a similar model could be applied to study fractional DNA concentration in predicting the fetal and tumor fraction of plasma cfDNA in pregnant subjects and patients with HCC, respectively.
Figure 2.
Figure 2.
Frequency distribution histogram plot showing the distribution of plasma cfDNA concentration from 862 individuals of the study cohort.
Figure 3.
Figure 3.
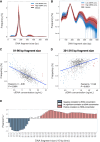
Size profile of plasma DNA fragments in subjects of different cfDNA concentrations. The size profiles of the selected lowest and highest 10% of subjects, and the median distribution of the cohort, are shown in linear scale (A) and logarithmic scale (B). Correlation between the frequency of DNA fragments within each 10 bp window bin and cfDNA concentration was assessed for all subjects, for the 81–90 bp fragment size range (C), 301–310 bp fragment size range (D), and across all 10 bp bins from 20 to 600 bp (E). Blue and red labels indicate 10 bp bins with a statistically significant negative or positive correlation to cfDNA concentration, respectively.
Figure 4.
Figure 4.
End motifs with significant correlation to cfDNA concentration. The frequencies of all 256 end motifs (4-mer) were correlated to the cfDNA concentration. The resulting analysis revealed 34 negatively correlated end motifs to cfDNA concentration and 45 positively correlated end motifs. (A) Heatmap analysis with rows indicating a particular 4-mer motif, in which the first base of the motif highlighted by a specific color in the left-most column (A, C, G, and T are colored by green, red, yellow, and blue, respectively). Each column indicates a plasma DNA sample from one subject. The frequency z-score, calculated for each end motif, is shown by the color scale. A support vector regression (SVR) model was trained with fragmentomic features to predict cfDNA concentration, using end motif frequencies (B) and both end motif and size profiles (C).
Figure 5.
Figure 5.
Deconvolutional analysis of end motifs to deduce the contribution of the six “founder” end motif profiles (F-profile) of plasma DNA fragments within the 231–600 bp size range, among subjects of different cfDNA concentrations. Heatmap analysis was performed, with each row showing the contributions (expressed as z-scores) of each F-profile across subjects with different cfDNA concentrations.
Figure 6.
Figure 6.
Application of fragmentomic pattern–based deduction of the fractional DNA concentration from specific cell types. Fragmentomic features, including size profile and end motif distribution, were used to train SVR models in the prediction of the fractional DNA percentage, which was correlated to the proportional tissue DNA contribution. (A) Correlation between the fetal DNA fraction predicted by the fragmentomic features and SNP-based methods, using 30 pregnant subjects. (B) Correlation between the tumoral fraction predicted by fragmentomic features and copy number aberration (ichorCNA).

References

    1. Alborelli I, Generali D, Jermann P, Cappelletti MR, Ferrero G, Scaggiante B, Bortul M, Zanconati F, Nicolet S, Haegele J, et al. 2019. Cell-free DNA analysis in healthy individuals by next-generation sequencing: a proof of concept and technical validation study. Cell Death Dis 10: 534. 10.1038/s41419-019-1770-3 - DOI - PMC - PubMed
    1. Chan KCA, Woo JKS, King A, Zee BCY, Lam WKJ, Chan SL, Chu SWI, Mak C, Tse IOL, Leung SYM, et al. 2017. Analysis of plasma Epstein–Barr virus DNA to screen for nasopharyngeal cancer. N Engl J Med 377: 513–522. 10.1056/NEJMoa1701717 - DOI - PubMed
    1. Chan RWY, Serpas L, Ni M, Volpi S, Hiraki LT, Tam LS, Rashidfarrokhi A, Wong PCH, Tam LHP, Wang Y, et al. 2020. Plasma DNA profile associated with DNASE1L3 gene mutations: clinical observations, relationships to nuclease substrate preference, and in vivo correction. Am J Hum Genet 107: 882–894. 10.1016/j.ajhg.2020.09.006 - DOI - PMC - PubMed
    1. Chan DCT, Lam WKJ, Hui EP, Ma BBY, Chan CML, Lee VCT, Cheng SH, Gai W, Jiang P, Wong KCW, et al. 2022. Improved risk stratification of nasopharyngeal cancer by targeted sequencing of Epstein-Barr virus DNA in post-treatment plasma. Ann Oncol 33: 794–803. 10.1016/j.annonc.2022.04.068 - DOI - PubMed
    1. Chan KCA, Lam WKJ, King A, Lin SV, Lee PHP, Zee BCY, Chan LS, Tse IOL, Tsang FCA, Li ZJM, et al. 2023. Plasma Epstein–Barr virus DNA and risk of future nasopharyngeal cancer. NEJM Evid 2: EVIDoa2200309. 10.1056/EVIDoa2200309 - DOI - PubMed

Substances

LinkOut - more resources