. 2024 Dec 15;38(23):e70182.
doi: 10.1096/fj.202401465R.

Insights into RNA-mediated pathology in new mouse models of Huntington's disease

Affiliations

Insights into RNA-mediated pathology in new mouse models of Huntington's disease

Magdalena Wozna-Wysocka et al. FASEB J. .

Abstract

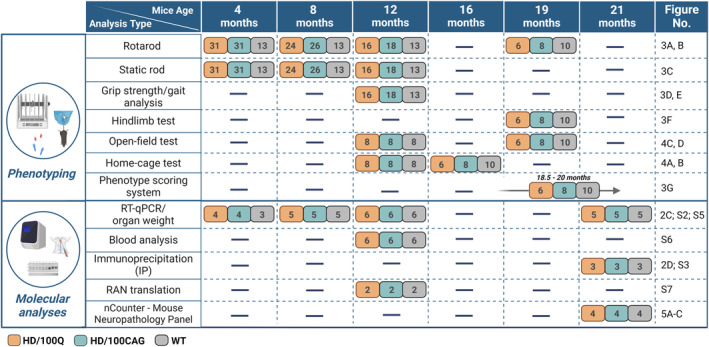
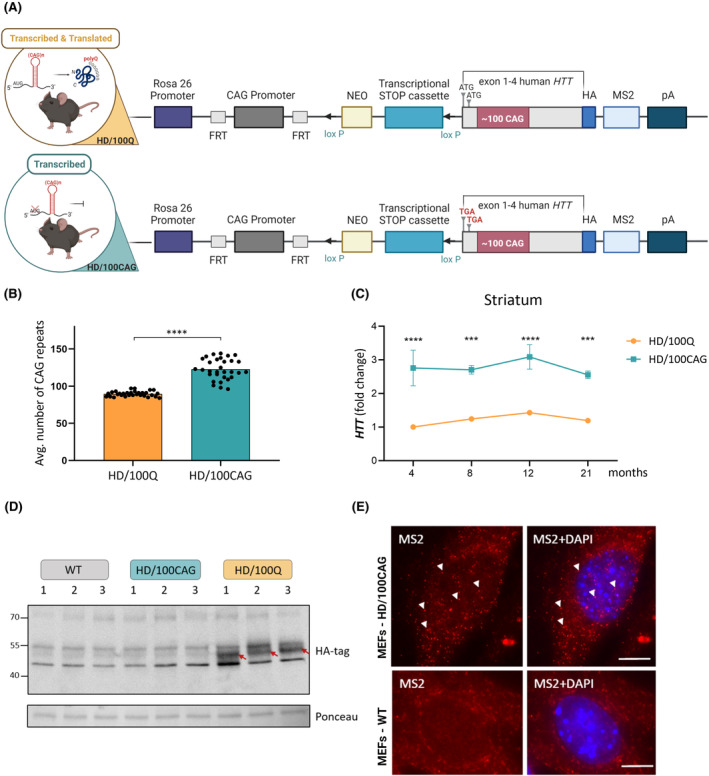
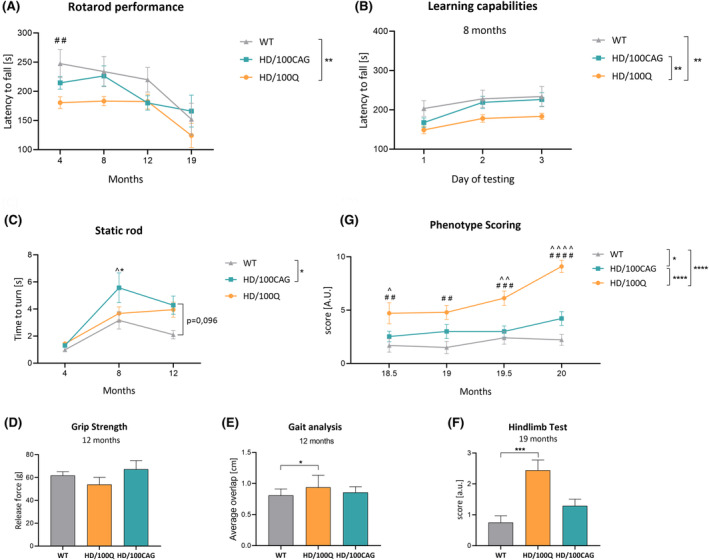
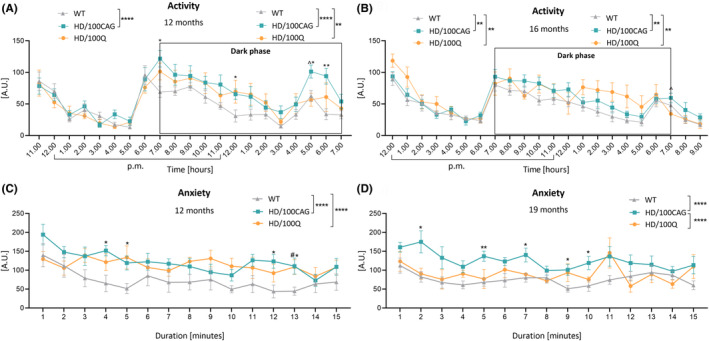
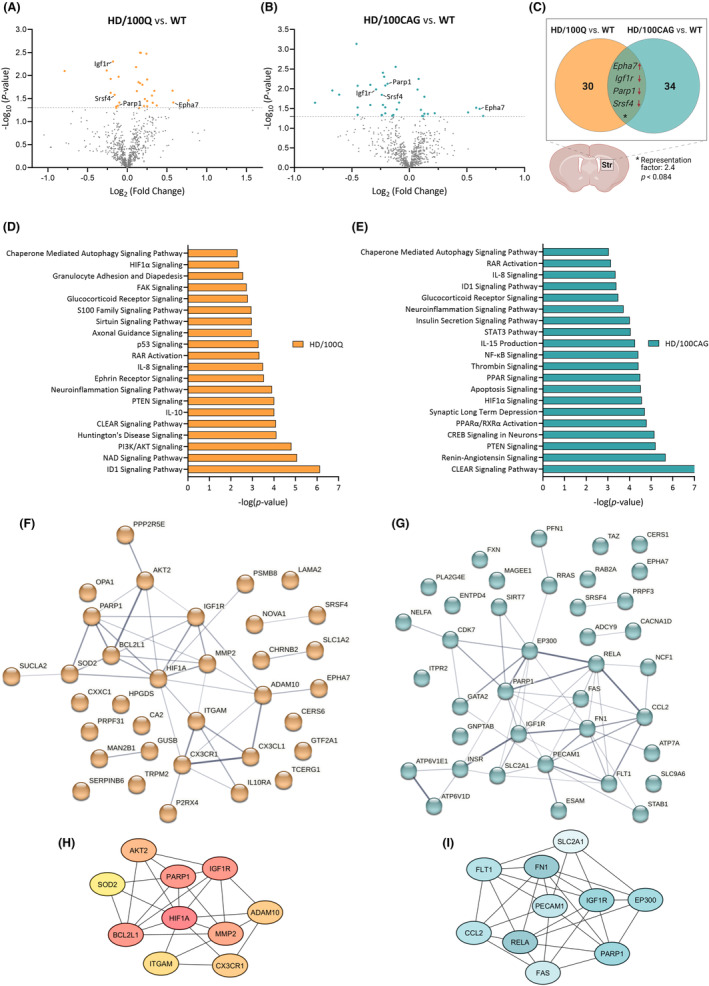
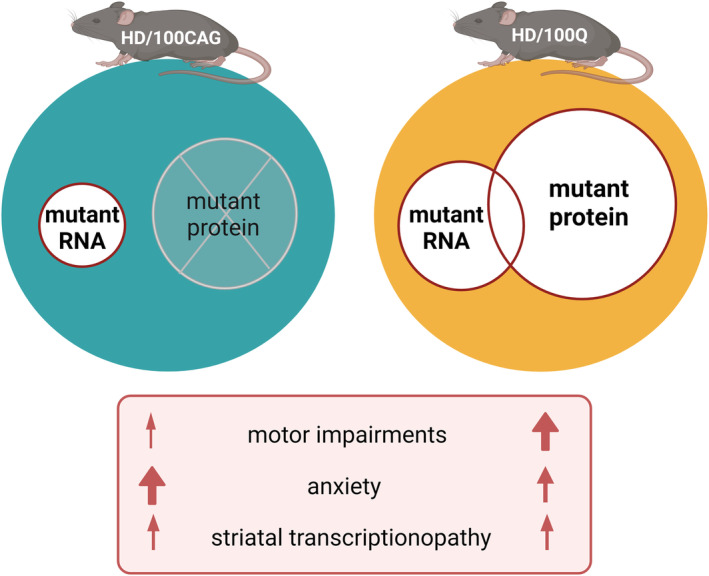
Huntington's disease (HD) is a neurodegenerative polyglutamine (polyQ) disease resulting from the expansion of CAG repeats located in the ORF of the huntingtin gene (HTT). The extent to which mutant mRNA-driven disruptions contribute to HD pathogenesis, particularly in comparison to the dominant mechanisms related to the gain-of-function effects of the mutant polyQ protein, is still debatable. To evaluate this contribution in vivo, we generated two mouse models through a knock-in strategy at the Rosa26 locus. These models expressed distinct variants of human mutant HTT cDNA fragment: a translated variant (HD/100Q model, serving as a reference) and a nontranslated variant (HD/100CAG model). The cohorts of animals were subjected to a broad spectrum of molecular, behavioral, and cognitive analysis for 21 months. Behavioral testing revealed alterations in both models, with the HD/100Q model exhibiting late disease phenotype. The rotarod, static rod, and open-field tests showed some motor deficits in HD/100CAG and HD/100Q model mice during the light phase, while ActiMot indicated hyperkinesis during the dark phase. Both models also exhibited certain gene deregulations in the striatum that are related to disrupted pathways and phenotype alterations observed in HD. In conclusion, we provide in vivo evidence for a minor contributory role of mutant RNA in HD pathogenesis. The separated effects resulting from the presence of mutant RNA in the HD/100CAG model led to less severe but, to some extent, similar types of impairments as in the HD/100Q model. Increased anxiety was one of the most substantial effects caused by mutant HTT RNA.

Keywords: Huntington's disease; RNA toxicity; mouse model; neurodegenerative diseases; polyglutamine disorders.


Figures

FIGURE 1
FIGURE 1
Summary of the experiments conducted at different timepoints. The number of animals in each group is given in rounded squares; the groups corresponding to the colors are shown below the table. In the last column, specific panels of figures are indicated where the results of respective experiments are presented.
FIGURE 2
FIGURE 2
Characterization of the HTT transgene in the generated mouse models. (A) Expression cassettes introduced into the Rosa26 locus in the parental lines of the HD/100Q and HD/100CAG knock‐in mice, with the main elements indicated. The only difference between these expression cassettes was the presence of two TGA codons, marked in red for the HD/100CAG cassette, instead of naturally occurring ATG codons. The Cre‐loxP system enabled the removal of the transcriptional STOP cassettes by crossing with Cre‐expressing mice. For more details, see the text. (B) Characteristics of the mutant HTT transgenes in homozygous HD/100Q and HD/100CAG mice. The average number of CAG repeats in the two alleles of the transgene in each mouse from the analyzed cohort is plotted (n = 31 HD/100CAG, n = 31 for HD/100Q). The average length of CAG tracts between models was compared using an unpaired t test; ****p < .0001. (C) Quantification of HTT transgene expression in the striatum of HD/100Q and HD/100CAG mice at the indicated ages by RT–qPCR. Atp5b and Gapdh were used as reference genes. Mean ± SEM; Two‐way ANOVA with Bonferroni's post hoc test; ***p < .001; ****p < .0001. (D) Representative blot of immunoprecipitated samples isolated from 21‐month‐old mice, HD/100Q model showing the presence of the transgenic HTT. Immunoprecipitation of whole cortical lysates was performed using anti‐HA‐tag agarose, and the membranes were probed with an anti‐HA‐tag antibody. Bands corresponding to mutant HTT fragments are indicated by red arrows. The mutant HTT alleles in individual HD/100Q mice (1, 2, and 3) included 78/89, 88/101, and 88/93 CAG repeats, respectively. A strip of the Ponceau S‐stained membrane is shown for verification of consistency in sample preparation. (E) Representative images of smFISH of mutant HTT RNA in MEFs isolated from E16.5 HD/100CAG mouse embryos and negative control MEFs isolated from WT mice. Exemplary specific spots of HTT RNA are indicated by the white triangles. Additional results are presented in Figure S4. Nuclei were stained with DAPI. Scale bar = 10 μm.
FIGURE 3
FIGURE 3
Locomotor activity of HD/100CAG and HD/100Q mice. (A) The rotarod test was used to evaluate the motor coordination and balance of mice at 4, 8, 12, and 19 months of age, and the latency to fall is presented. (B) The rotarod test was also used to assess the cognitive capabilities (learning) of the mice, which was measured by comparing performance on the test on three separate days; practice trials were performed on the first 2 days, while the test data presented in (A) were collected on the third day (the test day). (C) Results of the static rod test (time to turn around) at 4, 8, and 12 months of age. (D) Grip strength at 12 months of age. (E) Results of gait analysis at 12 months of age. (F) Assessment of motor deficits by the hindlimb test at 19 months of age. (G) Phenotyping scores at 18.5–20 months of age. The number of animals per group is shown in Figure 1. The statistical results presented in the figure legend were obtained by two‐way ANOVA (main effect of genotype) followed by Tukey's test; while #, *, ^ indicate a simple effect within rows according to Tukey's post hoc test (#HD/100Q mice vs. WT mice; *HD/100CAG mice vs. WT mice; ^HD/100Q mice vs. HD/100CAG mice). The data in panels D–F were analyzed using one‐way ANOVA with Holm–Sidak's multiple comparisons test. *p < .05; **p < .01; ***p < .001; ****p < .0001 (the same ranges also apply for ^ and #).
FIGURE 4
FIGURE 4
Activity of HD/100CAG and HD/100Q mice in the home cage and open field tests. (A, B) Home cage activity was assessed ~20 h with the ActiMot system at 12 (A) and 16 (B) months of age for. The dark phase is indicated, and a separate statistical analysis was performed for these data. (C, D) Anxiety behaviors were evaluated for 15 min in nonhome cages (no feed, water, or bedding) with the ActiMot system at 12 (C) and 19 (D) months of age (#HD/100Q mice vs. WT mice; *HD/100CAG mice vs. WT mice; ^HD/100Q mice vs. HD/100CAG mice). The number of animals per group is shown in Figure 1. The statistical results presented in the figure legend were obtained by two‐way ANOVA (main effect of genotype) followed by Tukey's test; while #, *, ^ indicate a simple effect within rows according to Tukey's post hoc test. *p < .05; **p < .01; ***p < .001; ****p < .0001 (the same ranges also apply for ^ and #).
FIGURE 5
FIGURE 5
Differential expression of genes in the HD/100Q and HD/100CAG models. Gene expression in samples isolated from the striatum of 21‐month‐old mice was analyzed with a NanoString nCounter Mouse Neuropathology Panel. (A, B) Volcano plots showing differential gene expression between HD/100Q mice and WT mice (A) and between HD/100CAG mice and WT mice (B). n = 4. DEGs with a p value ≤.05 are indicated in orange or blue. (C) Venn diagram indicating the number of transcripts whose levels were significantly changed in one or both models. Genes that showed similar changes in expression in both models included Parp1, Igf1r, and Srsf4, which were downregulated, and Epha7, which was upregulated. (D, E) Canonical pathways identified by IPA with the core analysis function. Histograms displaying the top 20 significantly altered canonical pathways in HD/100Q mice compared with WT mice (D) and in HD/100CAG mice compared with WT mice (E). (F, G) Network analysis of proteins encoded by the dysregulated genes (indicated by the colored dots in A and B) in HD/100Q mice compared with WT mice and (G) in HD/100CAG mice compared with WT mice (F) using the STRING v. 12 database for humans. The edges represent protein–protein associations, and the line thickness indicates the confidence score. (H, I) Networks of the top 10 hub genes according to the maximal clique centrality (MCC) method for the HD/100Q (H) and HD/100CAG (I) models. The darker the color is, the stronger the association with the other genes. In the PPI network, the human orthologs of Car2, Serpinb6a, and Ccl12 are assigned slightly different names: CA2, SERPINB6, and CCL2, respectively.
FIGURE 6
FIGURE 6
Our novel HD mouse models enable the study of alterations in pathways caused by mutant RNA separately from the overall pathogenesis of HD (induced by mutant RNA and protein). In HD/100CAG mice, the presence of the mutant transcript itself caused a certain motor phenotype, resulted in substantial anxiety and changes in gene expression levels in the striatum. In HD/100Q mice the mutant RNA and mutant protein are expected to cause effects that partially overlap and also enhance each other. In this model, motor impairments were more significant than in HD/100CAG mice, and increased anxiety, as well as, alterations in expression levels of neuropathology‐related genes were reported.

References

    1. Ghosh R, Tabrizi SJ. Huntington disease. Handb Clin Neurol. 2018;147:255‐278. - PubMed
    1. MacDonald ME, Ambrose CM, Duyao MP, et al. A novel gene containing a trinucleotide repeat that is expanded and unstable on Huntington's disease chromosomes. The Huntington's disease collaborative research group. Cell. 1993;72:971‐983. - PubMed
    1. Tabrizi SJ, Flower MD, Ross CA, Wild EJ. Huntington disease: new insights into molecular pathogenesis and therapeutic opportunities. Nat Rev Neurol. 2020;16:529‐546. - PubMed
    1. Fusilli C, Migliore S, Mazza T, et al. Biological and clinical manifestations of juvenile Huntington's disease: a retrospective analysis. Lancet Neurol. 2018;17:986‐993. - PubMed
    1. Bakels HS, Roos RAC, van Roon‐Mom WMC, de Bot ST. Juvenile‐onset Huntington disease pathophysiology and neurodevelopment: a review. Mov Disord. 2022;37:16‐24. - PMC - PubMed