. 2025 Feb;116(2):420-431.
doi: 10.1111/cas.16406. Epub 2024 Nov 27.

Fibrous corona is reduced in cancer cell lines that attenuate microtubule nucleation from kinetochores

Affiliations

Fibrous corona is reduced in cancer cell lines that attenuate microtubule nucleation from kinetochores

Yudai Ishikawa et al. Cancer Sci. 2025 Feb.

Abstract

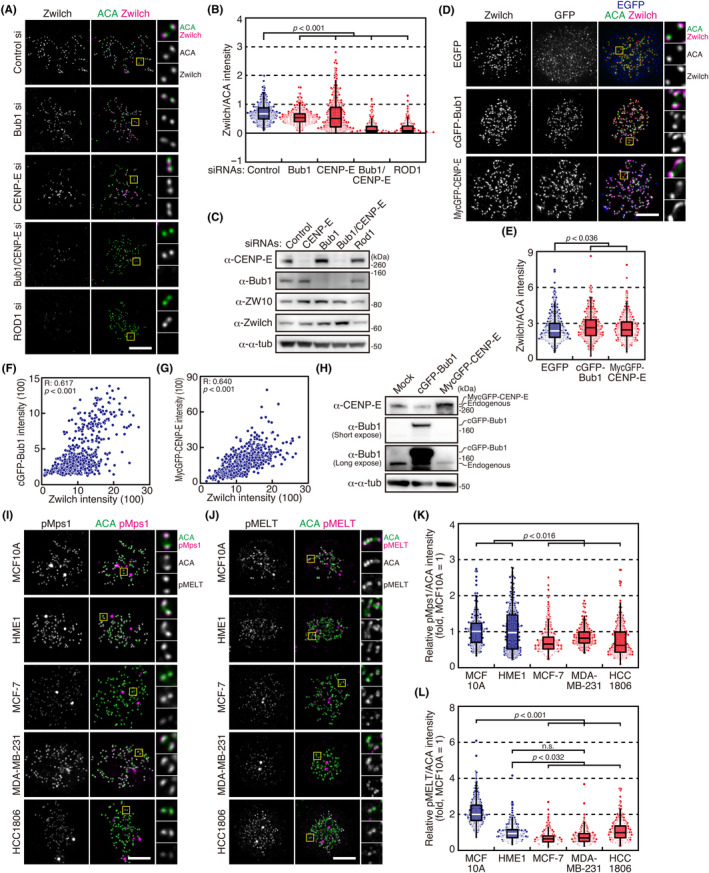
Most cancer cells show increased chromosome missegregation, known as chromosomal instability (CIN), which promotes cancer progression and drug resistance. The underlying causes of CIN in cancer cells are not fully understood. Here we found that breast cancer cell lines show a reduced kinetochore localization of ROD, ZW10, and Zwilch, components of the fibrous corona, compared with non-transformed breast epithelial cell lines. The fibrous corona is a structure formed on kinetochores before their end-on attachment to microtubules and plays a role in efficient kinetochore capture and the spindle assembly checkpoint. The reduction in the fibrous corona was not due to reduced expression levels of the fibrous corona components or to a reduction in outer kinetochore components. Kinetochore localization of Bub1 and CENP-E, which play a role in the recruitment of the fibrous corona to kinetochores, was reduced in cancer cell lines, presumably due to reduced activity of Mps1, which is required for their recruitment to kinetochores through phosphorylating KNL1. Increasing kinetochore localization of Bub1 and CENP-E in cancer cells restored the level of the fibrous corona. Cancer cell lines showed a reduced capacity to nucleate microtubules from kinetochores, which was recently shown to be dependent on the fibrous corona, and increasing kinetochore localization of Bub1 and CENP-E restored the microtubule nucleation capacity on kinetochores. Our study revealed a distinct feature of cancer cell lines that may be related to CIN.

Keywords: Bub1; CENP‐E; RZZ complex; breast cancer; chromosomal instability; fibrous corona.


Conflict of interest statement

The authors have no competing financial interests. Kozo Tanaka is a current Editorial Board Member of Cancer Science.

Figures

FIGURE 1
FIGURE 1
Cancer cell lines show a reduced kinetochore localization of the fibrous corona components. (A–C) Kinetochore localization of ROD, ZW10, and Zwilch in non‐transformed breast epithelial and breast cancer cell lines. Cells were treated with nocodazole for 4 h, then fixed and stained with anti‐ROD (A), ZW10 (B), or Zwilch (C; magenta) and anti‐centromere (ACA; green) antibodies. Boxed regions in the panels are shown as magnified images in the insets. Scale bar: 5 μm. (D–F) Quantification of ROD (D), ZW10 (E), and Zwilch (F) signals on kinetochores. The relative intensity of each signal to the ACA signal in cells treated as in (A–C) is displayed as box and dot plots. The bottom and top of the box show the lower and upper quartile values, respectively. The median is indicated with a bar in the box, and the whiskers denote the range within a 1.5× size of the box. The median of the relative intensity in MCF10A cells was set as 1. The data represent a minimum of 224 (D), 402 (E), or 265 (F) kinetochores from five cells for each cell line. p‐values were obtained using the Steel–Dwass multiple comparison test. (G) Expression of ROD, ZW10, and Zwilch in non‐transformed breast epithelial and breast cancer cell lines. Lysates of each cell line were subjected to immunoblot analysis using antibodies as indicated. α‐Tubulin (α‐tub) was used as a loading control. (H–J) Quantification of ROD (H), ZW10 (I), and Zwilch (J) expression. The relative expression of each protein to α‐tubulin is shown, and an error bar represents the SD of three independent experiments. p‐values were obtained using the Tukey–Kramer multiple comparison test. n.s., Not statistically significant.
FIGURE 2
FIGURE 2
Cancer cell lines show a reduced kinetochore localization of Bub1 and CENP‐E. (A, B) Kinetochore localization of Hec1 and Knl1 in non‐transformed breast epithelial and breast cancer cell lines. Cells were treated with nocodazole for 4 h, then fixed and stained with anti‐Hec1 (A) or Knl1 (B; magenta) and anti‐centromere (ACA; green) antibodies. Boxed regions in the panels are shown as magnified images in the insets. Scale bar: 5 μm. (C, D) Quantification of Hec1 (C) and Knl1 (D) signals on kinetochores. The relative intensity of each signal to the ACA signal in cells treated as in (A) is displayed as in Figure 1D. The median of the relative intensity in MCF10A cells was set as 1. The data represent a minimum of 265 (C) or 179 (D) kinetochores from five cells for each cell line. p‐values were obtained using the Steel–Dwass multiple comparison test. (E–G) Kinetochore localization of Bub1, CENP‐E, and BubR1 in non‐transformed breast epithelial and breast cancer cell lines. Cells treated as in (A) were fixed and stained with anti‐Bub1 (E), CENP‐E (F), or BubR1 (G; magenta) and anti‐centromere (ACA; green) antibodies. Boxed regions in the panels are shown as magnified images in the insets. Scale bar: 5 μm. (H–J) Quantification of Bub1 (H), CENP‐E (I), and BubR1 (J) signals. The relative intensity of each signal to the ACA signal in cells treated as in (E‐G) is displayed as in Figure 1D. The median of the relative intensity in MCF10A cells was set as 1. The data represent a minimum of 416 (H), 417 (I), or 431 (J) kinetochores from five cells for each cell line. p‐values were obtained using the Steel–Dwass multiple comparison test.
FIGURE 3
FIGURE 3
Overexpression of Bub1 or CENP‐E restores the level of kinetochore localization of the fibrous corona in cancer cells. (A) Kinetochore localization of Zwilch in MCF10A cells depleted of Bub1 and/or CENP‐E. Cells were treated with siRNA for Bub1 and/or CENP‐E, or siRNA for ROD for 48 h, followed by nocodazole treatment for 4 h, then fixed and stained with anti‐Zwilch (magenta) and anti‐centromere (ACA; green) antibodies. Boxed regions in the panels are shown as magnified images in the insets. Scale bar: 5 μm. (B) Quantification of the Zwilch signal on kinetochores in cells treated as in (A). The relative intensity to the ACA signal is displayed as in Figure 1D. The data represent a minimum of 426 kinetochores from five cells for each cell line. p‐values were obtained using the Steel–Dwass multiple comparison test. (C) The efficiency of Bub1, CENP‐E, and ROD RNAi in MCF10A cells. Lysates of MCF10A cells transfected with siRNAs against indicated genes were subjected to immunoblot analysis using antibodies as indicated. α‐tubulin was used as a loading control. (D) Kinetochore localization of Zwilch in MCF‐7 cells overexpressing Bub1 or CENP‐E. Cells expressing cGFP‐Bub1 or MycGFP‐CENP‐E were fixed 4 h after nocodazole treatment, and stained with anti‐GFP (blue), anti‐Zwilch (magenta), and anti‐centromere (ACA; green) antibodies. Boxed regions in the panels are shown as magnified images in the insets. Scale bar: 5 μm. (E) Quantification of the Zwilch signal in cells treated as in (D). The relative intensity to the ACA signal is displayed as in Figure 1D. The data represent a minimum of 557 kinetochores from five cells for each cell line. p‐values were obtained using the Steel–Dwass multiple comparison test. (F, G) Relationship between signal intensity of cGFP‐Bub1 (F) or MycGFP‐CENP‐E (G) with that of Zwilch on kinetochores in MCF‐7 cells overexpressing Bub1 or CENP‐E. The signal intensity of each protein on individual kinetochores in cells treated as in (D) was plotted. Spearman's rank correlation coefficients (R) and p‐values are shown. (H) Expression of cGFP‐Bub1 and MycGFP‐CENP‐E. Lysates of MCF‐7 cells expressing cGFP‐Bub1 or MycGFP‐CENP‐E were subjected to immunoblot analysis using antibodies as indicated. α‐Tubulin was used as a loading control. (I, J) Phosphorylation of Mps1 and phosphorylation of KNL1 at the MELT motif in non‐transformed breast epithelial and breast cancer cell lines. Cells were treated with nocodazole for 4 h, then fixed and stained with anti‐phosphorylated Mps1 (pMps1; I) or phosphorylated MELT motif (pMELT, magenta; J) and anti‐centromere (ACA; green) antibodies. Boxed regions in the panels are shown as magnified images in the insets. Scale bar: 5 μm. (K, L) Quantification of the pMps1 (K) and pMELT (L) signals on kinetochores. The relative intensity of each signal to the ACA signal in cells treated as in (I, J) is displayed as in Figure 1D. The median of the relative intensity of pMps1 (K) or pMELT (L) signal in MCF10A cells was set as 1. The data represent a minimum of 307 (K) or 306 (L) kinetochores from five cells for each cell line. p‐values were obtained using the Steel–Dwass multiple comparison test.
FIGURE 4
FIGURE 4
Cancer cell lines show a reduced microtubule nucleation from kinetochores. (A) Kinetochore localization of EB1 in non‐transformed breast epithelial and breast cancer cell lines released from nocodazole arrest. Cells were treated with nocodazole for 4 h and fixed 90 s after washout of nocodazole, then stained with anti‐EB1 (magenta) and anti‐centromere (ACA; green) antibodies. Boxed regions in the panels are shown as magnified images in the insets. Scale bar: 5 μm. (B) Quantification of EB1 signal on kinetochores in cells treated as in (A). The relative intensity to the ACA signal is displayed as in Figure 1D. The median of the relative EB1 intensity in MCF10A cells was set as 1. The data represent a minimum of 257 kinetochores from five cells for each cell line. p‐values were obtained using the Steel–Dwass multiple comparison test. (C, D) Kinetochore localization of EB1 in MCF10A (C) and MCF‐7 (D) cells released from nocodazole arrest. Cells were released from 4 h nocodazole treatment and fixed at indicated times, then stained as in (A). Boxed regions in the panels are shown as magnified images in the insets. Scale bar: 5 μm. (E) Quantification of EB1 signal on kinetochores in cells treated as in (C, D). The relative intensity to the ACA signal is displayed as in (B). The data represent a minimum of 258 kinetochores from five cells for each cell line. p‐values were obtained using the Steel–Dwass multiple comparison test.
FIGURE 5
FIGURE 5
Reduced microtubule nucleation in cancer cells is restored when the fibrous corona is increased. (A) Kinetochore localization of EB1 in MCF10A cells depleted of Bub1 or CENP‐E after nocodazole washout. Cells were treated with siRNA for Bub1 or CENP‐E for 48 h, treated with nocodazole for 4 h, and fixed 90 s after washout of nocodazole, then stained with anti‐EB1 (magenta) and anti‐centromere (ACA; green) antibodies. Boxed regions in the panels are shown as magnified images in the insets. Scale bar: 5 μm. (B) Quantification of the EB1 signal on kinetochores in cells treated as in (A). The relative intensity to the ACA signal is displayed as in Figure 4B. The data represent a minimum of 250 kinetochores from five cells for each cell line. p‐values were obtained using the Steel–Dwass multiple comparison test. (C) Kinetochore localization of EB1 in MCF‐7 cells overexpressing Bub1 or CENP‐E after nocodazole washout. Cells expressing cGFP‐Bub1 or MycGFP‐CENP‐E were treated as in (A). Boxed regions in the panels are shown as magnified images in the insets. Scale bar: 5 μm. (D) Quantification of the EB1 signal in cells treated as in (C). The relative intensity to the ACA signal is displayed as in (B). The data represent a minimum of 394 kinetochores from five cells for each cell line. p‐values were obtained using the Steel–Dwass multiple comparison test.

References

    1. Weaver BA, Cleveland DW. Does aneuploidy cause cancer? Curr Opin Cell Biol. 2006;18:658‐667. - PubMed
    1. Ben‐David U, Amon A. Context is everything: aneuploidy in cancer. Nat Rev Genet. 2020;21:44‐62. - PubMed
    1. Tanaka K, Hirota T. Chromosomal instability: a common feature and a therapeutic target of cancer. Biochim Biophys Acta. 2016;1866:64‐75. - PubMed
    1. Gordon DJ, Resio B, Pellman D. Causes and consequences of aneuploidy in cancer. Nat Rev Genet. 2012;13:189‐203. - PubMed
    1. Bakhoum SF, Compton DA. Chromosomal instability and cancer: a complex relationship with therapeutic potential. J Clin Invest. 2012;122:1138‐1143. - PMC - PubMed

MeSH terms