. 2024 Nov;30(11):e17589.
doi: 10.1111/gcb.17589.

Evidence for an Adaptive, Large-Scale Range Shift in a Long-Distance Terrestrial Migrant

Affiliations

Evidence for an Adaptive, Large-Scale Range Shift in a Long-Distance Terrestrial Migrant

Eliezer Gurarie et al. Glob Chang Biol. 2024 Nov.

Abstract

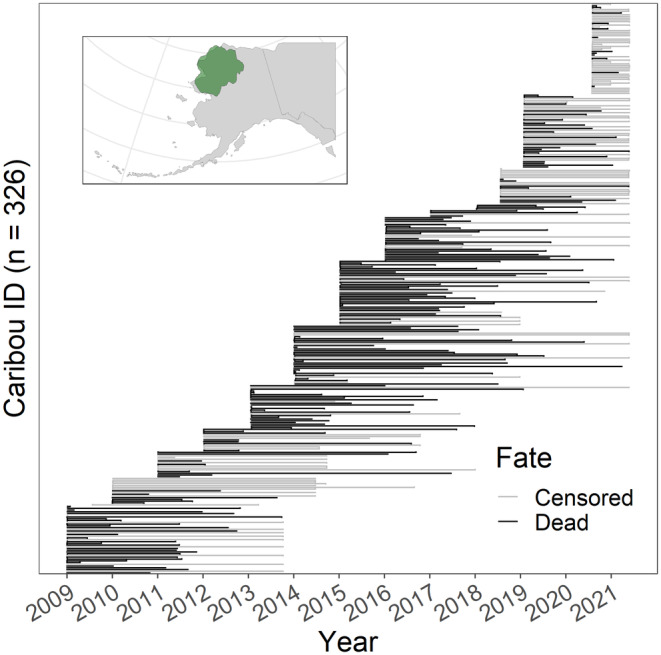
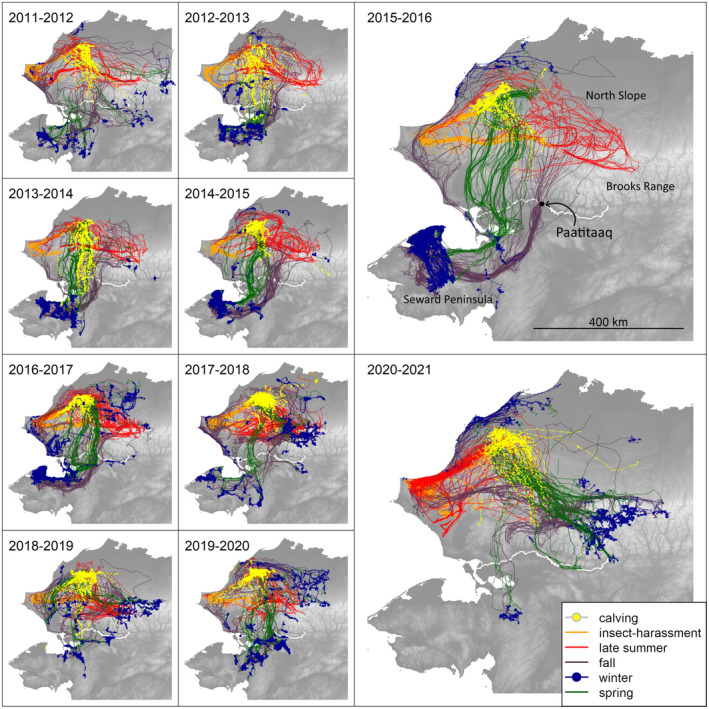
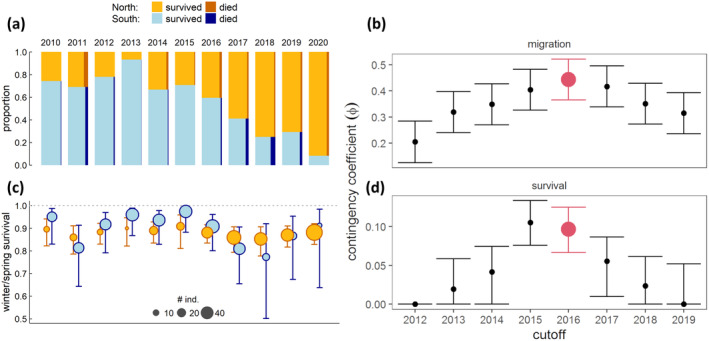
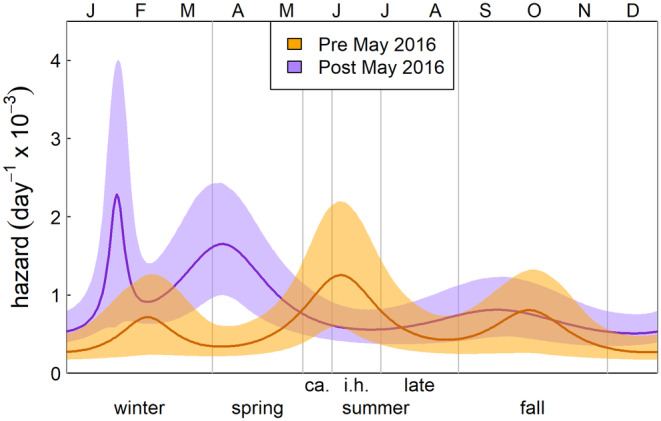
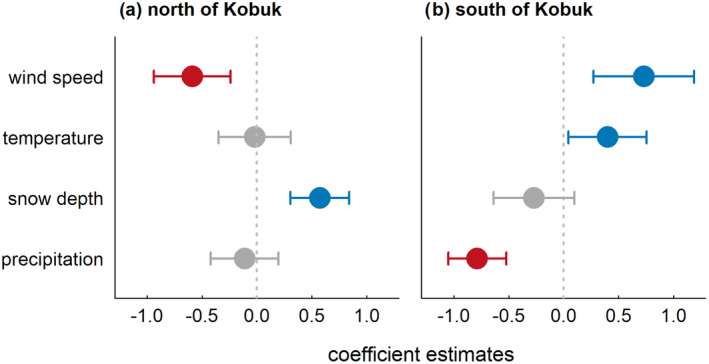
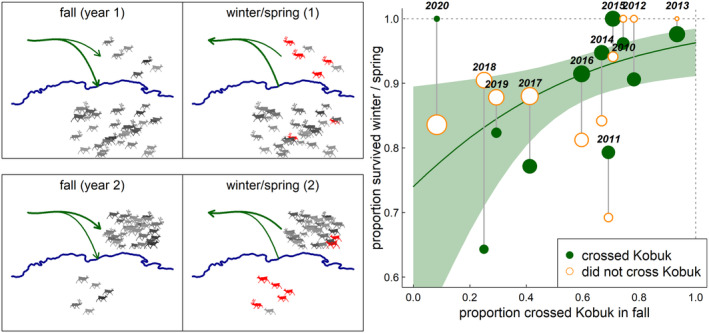
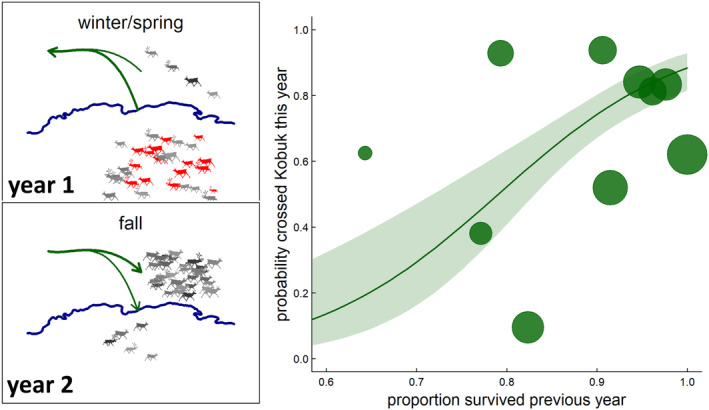
Long-distance migrations are a striking, and strikingly successful, adaptation for highly mobile terrestrial animals in seasonal environments. However, it remains an open question whether migratory animals are more resilient or less resilient to rapidly changing environments. Furthermore, the mechanisms by which animals adapt or modify their migrations are poorly understood. We describe a dramatic shift of over 500 km in the wintering range of the Western Arctic Herd, a large caribou (Rangifer tarandus) herd in northwestern Alaska, an area that is undergoing some of the most rapid warming on Earth. Between 2012 and 2020, caribou switched from reliably wintering in maritime tundra in the southwesternmost portion of their range to more frequently wintering in mountainous areas to the east. Analysis of this range shift, in conjunction with nearly 200 documented mortality events, revealed that it was both broadly adaptive and likely driven by collective memory of poor winter conditions. Before the range shift, overwinter survival in the maritime tundra was high, routinely surpassing 95%, but falling to around 80% even as fewer animals wintered there. Meanwhile, in the increasingly used mountainous portion of the range, survival was intermediate and less variable across years compared to the extremes in the southern winter ranges. Thus, the shift only imperfectly mitigated overall increased mortality rates. The range shift has also been accompanied by changes in seasonal patterns of survival that are consistent with poorer nutritional intake in winter. Unexpectedly, the strongest single predictor of an individual's probability of migrating south was the overall survival of animals in the south in the preceding winter, suggesting that the range shift is in part driven by collective memory. Our results demonstrate the importance and use of collective decision making and memory for a highly mobile species for improving fitness outcomes in a dynamic, changing environment.

Keywords: Alaska; behavioral plasticity; caribou; climate change; collective memory; migratory range; snow; survivorship; temperature; wind.


Conflict of interest statement

The authors declare no conflicts of interest.

Figures

FIGURE 1
FIGURE 1
Deployment and mortality timelines of adult female collared Western Arctic Herd caribou from 2009 to 2022. Black lines indicate caribou with known mortality events, gray lines correspond to caribou with censored data, whether due to collar failure, drop‐off, or the animal still being alive at the end of the study. The inset map shows the range of the herd in the northwest portion of Alaska.
FIGURE 2
FIGURE 2
Seasonal movements by female Western Arctic Herd caribou for biological years 2011–2020, illustrating the high calving ground site fidelity (yellow colors) and highly variable wintering ground behavior (blue colors). Insect harassment season (orange), late summer (red), fall (purple), and spring (green) are also presented. The Kobuk River is the thick white line running east to west. All collaring occurred at Paatitaaq (Onion Portage) prior to 2019. The 2 years in the right panels (2015–2016 and 2020–2021) are larger to highlight the shift in the wintering range.
FIGURE 3
FIGURE 3
September photos of Western Arctic Herd caribou swimming the Kobuk River (left) across Paatitaaq (Onion Portage), shown with many caribou (top right) and without caribou (bottom right). In recent years, almost no caribou have crossed the river at this site, which has been used by both caribou and people for millennia (Anderson ; Joly and Cameron 2022). Photos: K. Joly.
FIGURE 4
FIGURE 4
(a) Proportion of female Western Arctic Herd caribou monitored between 2010 and 2020 colored by those that crossed the Kobuk River (blue) and those that did not (orange) and by those that died in the subsequent winter and spring seasons (darker colors). (b) Estimated winter and spring survival by biological year for animals that wintered north (orange) or south (blue) of Kobuk River. Vertical bars are 95% confidence intervals, and areas are proportional to the number of collared individuals that displayed the respective migratory behavior. (c–d) Break‐point analysis comparing the proportional effect of splitting the caribou data before and after various years between 2012 and 2020 on the proportion of animals that (c) migrate/do not cross the Kobuk River and (d) that survive/do not survive. The y‐axis indicates the effect size of a chi‐squared test comparing proportions, with 95% confidence intervals. The cutoff includes all biological years up to and including the one indicated, thus for 2016 “migration” refers to the proportion of animals that crossed the Kobuk River in the fall up to and including fall of 2016; “survival” refers to the proportion of animals that survived in the winter and summer (postmigration) of 2017.
FIGURE 5
FIGURE 5
Fitted three‐season hazard functions for female Western Arctic Herd caribou, northwest Alaska 2009–2021. The dark orange and purple line indicates the point estimate prediction of the hazard function before the May 2016 cutoff and after it, respectively, while the corresponding shaded areas indicated the 95% prediction intervals. Vertical lines represent the discrete seasonal cutoffs, with summer broken down into calving (“ca.”), insect harassment (“i.h.”), and late summer.
FIGURE 6
FIGURE 6
Main effect of winter weather covariates (snow depth, wind speed, precipitation, maximum temperature) on probability of survival of female Western Arctic Herd caribou in winter for animals that wintered north (left panel) or south (right panel) of the Kobuk River. Gray colors represent nonsignificance (p > 0.05), and red and blue represent negative and positive significant effects on survival, respectively.
FIGURE 7
FIGURE 7
Schematic (left panel) and results (right panel) of analysis of the consequences of the migration shift. In the schematic, in a given year, if the choice of where to migrate, that is, whether to cross the Kobuk River (thick blue line), is correlated with survival (gray vs. red silhouettes), then relatively fewer animals will die south of the river when more animals cross the river (thick migration lines, upper panels) and vice versa (bottom panels). In the right panel, the winter and spring survival of female Western Arctic Herd caribou (y‐axis) against proportion of animals that migrated across the Kobuk River that year (x‐axis). Each point represents a distinct biological year (as labeled), orange open circles represent animals that wintered north of the Kobuk River, and green filled circles represent animals that crossed the Kobuk River. The line and corresponding shaded area are the modeled predictions and 95% confidence intervals of the relationship for those that did migrate based on the top fitted model (see text and Table 3a). The size of the circles is proportional to total number, for example, in 2020 only 6 of 73 animals crossed in the Kobuk, whereas in 2013, 42 of 45 animals crossed the Kobuk.
FIGURE 8
FIGURE 8
Schematic (left panel) and results (right panel) of analysis of the potential causes of migration shifts. In the schematic (upper left panel), if there was higher mortality (red silhouettes) south of the Kobuk River (thick blue line) the previous winter/spring period, we predict that relatively fewer caribou will migrate south of the Kobuk River the following fall (lower left panel). In the right panel, the proportion of animals that migrate across the Kobuk River in a given year (y‐axis) is plotted against the winter/spring survival among those animals that migrated in the previous year (x‐axis). Each circle represents a distinct biological year, with areas reflecting the sample size (i.e., the number of animals that wintered south of the Kobuk in the previous year). The line and shaded area reflect the main effect of the top fitted model (see text and Table 3a).

Similar articles

Cited by

References

    1. Abrahms, B. , Teitelbaum C. S., Mueller T., and Converse S. J.. 2021. “Ontogenetic Shifts From Social to Experiential Learning Drive Avian Migration Timing.” Nature Communications 12, no. 1: 7326. 10.1038/s41467-021-27626-5. - DOI - PMC - PubMed
    1. Aikens, E. O. , Bontekoe I. D., Blumenstiel L., Schlicksupp A., and Flack A.. 2022. “Viewing Animal Migration Through a Social Lens.” Trends in Ecology & Evolution 37, no. 11: 985–996. 10.1016/j.tree.2022.06.008. - DOI - PubMed
    1. Alerstam, T. , Hedenström A., and Åkesson S.. 2003. “Long‐Distance Migration: Evolution and Determinants.” Oikos 103, no. 2: 247–260. 10.1034/j.1600-0706.2003.12559.x. - DOI
    1. Anderson, D. D. 1998. Kuuvanmiut Subsistence: Traditional Eskimo Life in the Latter Twentieth Century. National Park Service, Department of the Interior.
    1. Anderson, J. J. , Gurarie E., Bracis C., Burke B. J., and Laidre K. L.. 2013. “Modeling Climate Change Impacts on Phenology and Population Dynamics of Migratory Marine Species.” Ecological Modelling 264: 83–97. 10.1016/j.ecolmodel.2013.03.009. - DOI

LinkOut - more resources