. 2024 Nov 27;15(1):10299.
doi: 10.1038/s41467-024-54717-w.

Systemic biological mechanisms underpin poor post-discharge growth among severely wasted children with HIV

Affiliations

Systemic biological mechanisms underpin poor post-discharge growth among severely wasted children with HIV

Evans O Mudibo et al. Nat Commun. .

Abstract

In sub-Saharan Africa, children with severe malnutrition (SM) and HIV have substantially worse outcomes than children with SM alone, facing higher mortality risk and impaired nutritional recovery post-hospitalisation. Biological mechanisms underpinning this risk remain incompletely understood. This case-control study nested within the CHAIN cohort in Kenya, Uganda, Malawi, and Burkina Faso examined effect of HIV on six months post-discharge growth among children with SM and those at risk of malnutrition, assessed proteomic signatures associated with HIV in these children, and investigated how these systemic processes impact post-discharge growth in children with SM. Using SomaScanTM assay, 7335 human plasma proteins were quantified. Linear mixed models identified HIV-associated biological processes and their associations with post-discharge growth. Using structural equation modelling, we examined directed paths explaining how HIV influences post-discharge growth. Here, we show that at baseline, HIV is associated with lower anthropometry. Additionally, HIV is associated with protein profiles indicating increased complement activation and decreased insulin-like growth factor signalling and bone mineralisation. HIV indirectly affects post-discharge growth by influencing baseline anthropometry and modulating proteins involved in bone mineralisation and humoral immune responses. These findings suggest specific biological pathways linking HIV to poor growth, offering insights for targeted interventions in this vulnerable population.


Conflict of interest statement

Competing interests: The authors declare no competing interests.

Figures
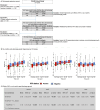
Fig. 1
Fig. 1. The HIV-SM case-control participants selection consort and post-discharge growth trajectories.
A Study participants selection consort of the HIV-SM case-control study. For the effect of HIV on post-discharge growth analysis, the study included 834 children from the CHAIN cohort of whom 112 had HIV infection. To unravel systemic proteome processes associated with HIV status, the study analysed 689 children (those with plasma proteomics data measured at hospital discharge) of whom 79 had HIV infection. Children who lacked proteomics data were excluded from this analysis. For the growth mechanistic analysis to understand impact of HIV-associated biological processes on growth, children who died post-discharge, lacked proteome data or were not severely wasted were excluded, retaining 217 children of whom 38 had HIV. B Depicts box plots of 180 days post-discharge mid-upper arm circumference (MUAC), weight-for-age z score (WAZ), weight-for-height z score (WHZ) and height-for-age z score (HAZ) trajectories, stratified by HIV status. Data are presented as median values with interquartile ranges (IQR). The plots include fitted LOESS (locally estimated scatterplot smoothing) function (red and blue lines) to show the post-discharge growth rates. The red and blue colours represent the HIV positive (n = 112) and HIV negative (n = 722) groups, respectively. Green horizontal dashed lines show the threshold for severe malnutrition based either on MUAC (11.5 cm) or Z score of (-3) for WAZ, WHZ, and HAZ. Box plots indicate; median (middle line); 25th (first quartile, Q1) and 75th (third quartile, Q3) percentile (box limits); error bars (whiskers) represent 1.5*Q1 and Q3 while single points outside the error bars represent outliers. C Shows mean post-discharge anthropometric gains overall and results from an interaction analysis between HIV status and time. Beta coefficient estimates and p-values were obtained using a fixed-effects panel model (Eq. 1), where children without HIV served as the reference group. Statistically significant results were identified based on p < 0.05. For each predictor, significance was assessed with t-statistics, while the F-test evaluated overall model significance, as implemented in the plm function from the plm R package. The exact p values for the relationships between MUAC, WAZ, WHZ, and HAZ with TimePoint are as follows: MUAC and TimePoint, p = 5.31e-186; WAZ and TimePoint, p = 6.24e-69; WHZ and TimePoint, p = 7.00e-73; and HAZ and TimePoint, p = 1.74e-10. For the interaction effects in the model, the exact p-values are as follows: TimePoint*HIV status and MUAC, p = 3.35e-06; TimePoint*HIV status and WAZ, p = 2.17e-05. Abbreviations: Discharge, hospital discharge time point; Day 45, 45 days post-discharge; Day 90, 90 days post-discharge; Day 180, 180 days post-discharge; CI, confidence interval.
Fig. 2
Fig. 2. Association of plasma proteome modules with HIV status among 689 children, including 79 with HIV.
A Forest plot of coefficient estimates showing association of plasma proteome modules measured at hospital discharge with HIV status. Estimates on the x-axis represent the beta-coefficients of this association. Points (centre of the bars) indicate beta coefficient estimates for every unit increase in plasma protein concentration in each module while error bars indicate 95% confidence interval. The red colour indicates significantly differentially expressed protein modules by HIV status. The size indicates the number of proteins in each module. B Eigenprotein adjacency heatmap showing the correlation between modules and HIV status, and superclusters. Purple coloured rectangle highlight HIV-related superclusters with eigenprotein correlations of ≥0.5. Superclusters only arising from HIV-related protein modules are highlighted. Abbreviations: PM, protein module, SC1 supercluster 1 comprised of modules 34, 17, and 30, SC2 supercluster 2 comprised of modules 19, 23 and 22, SC3 supercluster 3 comprised of modules 32, 33, and 12, SC4 supercluster 4 comprised of modules 25 and 10, SC5 supercluster 5 comprised of modules 7 and 8, SC6 supercluster 6 comprised of modules 37 and 31.
Fig. 3
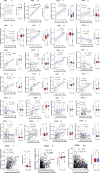
Fig. 3. Identification of hub proteins in modules associated with HIV.
AAA Scatter plots showing correlation of absolute effect sizes of protein-HIV significance (y-axis) and intra-modular connectivity (x-axis) among modules significantly associated with HIV. Positive correlations were observed in 15 protein modules while PM39 displayed a negative correlation. Modules PM1, PM5, PM6, PM10, PM14, PM17, PM25, PM26, PM30, PM31 and PM34 did not show significant correlations. Correlation coefficients (R) with their corresponding significance are shown where p < 0.05 were considered significant. The blue regression line shows this relationship while the error bands represent the 95% confidence interval for the regression line. Hub proteins are highlighted by red dots and labelled accordingly. Box plots show the expression levels of hub proteins by HIV status (children with HIV, n = 79; children without HIV, n = 610). Data are presented as median values with interquartile ranges (IQR). A two-sided t-test was used to compare expression levels, with Bonferroni-adjusted p < 0.05 considered statistically significant. Box plots indicate; median (middle line); 25th (first quartile, Q1) and 75th (third quartile, Q3) percentile (box limits); error bars (whiskers) represent 1.5*Q1 and Q3 while single points outside the error bars represent outliers. Abbreviations: PM, protein module; ∣β-coefficient∣, absolute beta coefficient estimate of a relationship between proteins in a module and HIV – the protein-HIV significance; R, correlation coefficient; p, p-value.
Fig. 4
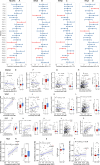
Fig. 4. Association of HIV infection-related protein modules with 90-day post-discharge growth and hub proteins identification.
Analysis included 217 children of whom 38 had HIV infection. AD Forest plots showing association of HIV-related protein modules at discharge with 90-day post-discharge MUAC, WAZ, WHZ, and HAZ. Estimates on the x-axis represent the beta-coefficients of this association. Points (centre of the bars) indicate beta coefficient estimates for every unit increase in plasma protein concentration in a given module while error bars represent 95% confidence intervals. Red colour indicates estimate of modules significantly associated with 90-day post-discharge anthropometric measurements. ET Scatter plots illustrating the correlation between absolute effect sizes of protein-growth significance and intra-modular connectivity as shown by the blue regression line. The association coefficient, R, and significance of association, P, are indicated accordingly. The error bands represent the 95% confidence interval for the regression line. Red dots on the plots represent hub proteins in each module. Box plots show the expression levels of hub proteins by HIV status (children with HIV, n = 38; children without HIV, n = 79). Data are presented as median values with interquartile range (IQR). A two-sided t-test was used to compare expression levels of hub proteins between children with and without HIV, denoted by red and blue colours, respectively. P values were adjusted for multiple testing using the Bonferroni correction criterion. Box plots indicate; median (middle line); 25th (first quartile, Q1) and 75th (third quartile, Q3) percentile (box limits); error bars (whiskers) represent 1.5*Q1 and Q3 while single points outside the error bars represent outliers. Abbreviations: MUAC mid-upper arm circumference, WAZ weight-for-age z score, WHZ weight-for-height z score, HAZ height-for-age z score, PM protein module, ∣β-coefficient∣ absolute beta coefficient estimate of a relationship between proteins in a module and 90-day anthropometric measurements, R correlation coefficient, p p-value where p < 0.05 was considered significant.
Fig. 5
Fig. 5. Path diagrams depicting influences of HIV on post-discharge anthropometry.
A MUAC SEM framework. B WAZ SEM framework. C WHZ SEM framework. D HAZ SEM framework. The SEMs incorporated HIV status, HIV infection-related protein modules associated with 90-day post-discharge anthropometry, post-discharge anthropometric measurements, baseline anthropometry at discharge, site, sex, and age at discharge. Green and red coloured lines depict significant positive and negative associations, respectively, with asterisk indicating significant coefficient estimates. Grey coloured lines show non-significant associations. Singe-headed arrows depicts a path linking exogenous to endogenous variable while double-headed arrows represent covariance between protein modules. Path coefficients are standardised estimates of individual relationship within the structural equation model resulting from a simple linear regression. The overall model fit was assessed using the chi-square test and supplemented by additional fit indices; comparative fit index (CFI), root mean square error for approximation (RMSEA) and standardised root mean squared residual (SRMR) to confirm model adequacy, see the method section. Abbreviations: HIV, Human immunodeficiency virus – the primary exogenous variable of the structural equation framework; SEMs, structural equation models; MUAC, mid-upper arm circumference; WAZ, weight-for-age z score; WHZ, weight-for-height z score; HAZ, height-for-age z score; PM, protein module; site, enrolment site; and sex defined by biological attribute. The asterisks indicate significance gradient: *; p-value less than or equal to 0.01; **, p-value less than or equal to 0.001; and ***, p-value less than or equal to 0.0001.

References

    1. UNICEF, WHO & World Bank Group. Levels and trends in child malnutrition 2023: Estimates developed jointly by UNICEF, WHO and World Bank Group on child malnutritionhttps://www.who.int/data/gho/data/themes/topics/joint-child-malnutrition...
    1. UNAIDS. Global HIV & AIDS statistics — Fact sheet 2023 https://www.unaids.org/en/resources/factsheet#:~:text=Global%20HIV%20sta....
    1. Abate, B. B., Aragie, T. G. & Tesfaw, G. Magnitude of underweight, wasting and stunting among HIV positive children in East Africa: a systematic review and meta-analysis. PLoS ONE15, e0238403 (2020). - PMC - PubMed
    1. Omoni, A. O. et al. Child growth according to maternal and child HIV status in Zimbabwe. Pediatr. Infect. Dis. J.36, 869–876 (2017). - PMC - PubMed
    1. Bwakura-Dangarembizi, M. et al. Recovery of children following hospitalisation for complicated severe acute malnutrition. Matern. Child Nutr.18, e13302 (2022). - PMC - PubMed

Publication types

LinkOut - more resources