. 2024 Nov 27;15(1):10302.
doi: 10.1038/s41467-024-54753-6.

Neonatal immunity associated with heterologous HIV-1 neutralizing antibody induction in SHIV-infected Rhesus Macaques

Affiliations

Neonatal immunity associated with heterologous HIV-1 neutralizing antibody induction in SHIV-infected Rhesus Macaques

Sommer Holmes et al. Nat Commun. .

Abstract

The details of the pediatric immune system that supports induction of antibodies capable of neutralizing geographically-diverse or heterologous HIV-1 is currently unclear. Here we explore the pediatric immune environment in neonatal macaque undergoing Simian-HIV infection. Simian-HIV infection of 11 pairs of therapy-naive dams and infant rhesus macaques for 24 months results in heterologous HIV-1 neutralizing antibodies in 64% of young macaques compared to 18% of adult macaques. Heterologous HIV-1 neutralizing antibodies emerge by 12 months post-infection in young macaques, in association with lower expression of immunosuppressive genes, fewer germinal center CD4 + T regulatory cells, and a lower ratio of CD4 + T follicular regulatory to helper cells. Antibodies from peripheral blood B cells in two young macaques following SHIV infection neutralize 13% of 119 heterologous HIV-1 strains and map to regions of canonical broadly neutralizing antibody epitopes on the envelope surface protein. Here we show that pediatric immunity to SHIV infection in a macaque model may inform vaccine strategies to induce effective HIV-1 neutralizing antibodies in infants and children prior to viral exposure.


Conflict of interest statement

Competing interests: The authors declare no competing interests.

Figures
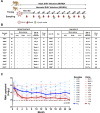
Fig. 1
Fig. 1. Study design and viral dynamics.
A Sampling timeline following neonatal and adult SHIV-infection in 11 pairs of neonate and dam rhesus macaques (RMs). Peripheral blood (bi-monthly) and lymph node tissue sections (6-month intervals) were collected over time as shown. The sampling within the first 4 months of SHIV challenge varied across animals due to technical and biological variables. This figure panel was Created in BioRender. Williams, W. (2020) https://BioRender.com/d04z220. B Information on the neonate and adult RMs studied including their sex, genotype for SIV restrictive Mamu-alleles [negative (−) and positive (+)], and viral inoculum (ng P27) used to establish infection at the indicated age. Yrs is abbreviation for years for age of adult RMs, whereas age of neonate RMs at time of infection was reported in days or weeks post-birth. C Plasma viral load dynamics measured via qPCR and reported as SIV gag RNA copies/ml (Log10). Each symbol represents an individual RM, but matching symbols represent each corresponding neonate (blue) and dam (red) pair. Longitudinal viral load levels per RM were connected by blue lines for neonate RMs and red lines for adult RMs. The thick blue and red lines represent the geometric mean of viral loads per timepoint for neonate and adult RMs, respectively. The horizontal dash line represents the limit of detection of the assay (1.79 RNA copies/ml). BD62 and V060 died (†) between 18–19 months post SHIV infection. For graphical purposes, some approximated timepoints were used for V057, V058 and V060; Source data are provided as a Source Data file. The reported p-value compares the log viral load area under the curve for adult-dam RMs (N = 11) compared to neonates (N = 11) using a 2-way paired Wilcoxon test.
Fig. 2
Fig. 2. Magnitudes and specificities of autologous HIV-1 Env-reactive binding and neutralizing antibodies elicited by neonate and adult SHIV infection.
A Longitudinal plasma spanning 24 months post neonate and adult SHIV infection in RMs were tested for binding autologous (CH848 10.17 DT.E169K) SOSIP trimer and gp120 monomer. Binding was measured in ELISA and the binding titers were reported as Log AUC. Data shown represent average binding log AUC titers of 2-3 biological replicates. Blue line represents plasma binding antibody responses in SHIV-infected neonate RMs, whereas the red line represents plasma binding antibody responses in SHIV-infected adult RMs. At the first time point, plasma binding antibody responses in SHIV-infected neonate RMs (N = 11) were statistically significantly higher than plasma binding antibody responses in SHIV-infected adult RMs (N = 11) for both the autologous SOSIP and the gp120 monomer (p = 0.001 in both cases by 2-way paired Wilcoxon test, and p = 3.7 × 10−7 and 0.009 via ANOVA test from fitting a viral load adjusted generalized linear model). The same tests at the last time point yielded not significant p-values (p = 0.76 and 0.99 for trimer and monomer, respectively, by 2-way paired Wilcoxon test; and p = 0.77 and 0.63 via ANOVA test for trimer and monomer, respectively). See control mAb binding in Figure S2. Due to limited sample availability in neonate RMs, plasma from HIV-1 negative dams (prior to SHIV infection) corresponding to each neonate RM was used as month 0 samples in ELISAs. B Longitudinal plasma antibodies elicited in neonatal (blue) and adult (red) SHIV infection were tested for neutralization of autologous SHIV CH848 10.17 DT.E169K [−V1 glycans] (left panel) and CH848 10.17 E169K [+V1 glycans] (right panel) in TZM-bl cells in a single experiment. Neutralization titer was measured as Log ID50 (reciprocal dilution) and horizontal bars indicate geometric means. Each symbol represents a different animal. To maximize sample availability per animal, we tested samples within intervals of 5–6, 10–14 and 16–18 months post-SHIV infection. Comparisons at first and last time point between neonate (N = 11) and dam-adult (N = 11) titers were obtained from 2-way paired Wilcoxon test (green) and ANOVA test from fitting viral-load adjusted generalized linear models (purple). A, B Source data are provided as a Source Data file.
Fig. 3
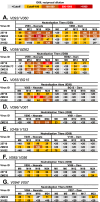
Fig. 3. Heterologous HIV-1 neutralization profile of plasma antibodies elicited by neonatal and adult SHIV infection.
AG Longitudinal plasma antibodies spanning 24 months following neonatal and adult SHIV infection were tested for neutralization of heterologous HIV-1 reference strains from the global panel. Neutralization titer was measured in TZM-bl cells and reported as ID50 (reciprocal dilution). The heatmaps show the neutralization titers of plasma antibodies in seven young RMs with induction of heterologous HIV-1 NAbs following neonatal SHIV infection (AG), and their corresponding dams including two adult RMs with induction of heterologous HIV-1 NAbs (AB). See methods for criteria of heterologous HIV-1 NAb induction as described. Shown are titers against viruses neutralized by the plasma samples that met our criteria for the induction of heterologous HIV-1 NAb induction. As shown by the key at the top of the figure, the heatmap was color coded to show the magnitude of NAb titers generated in each animal at different timepoints against each virus tested. Adults V060 and BD62 died before month 24 post-SHIV infection. Asterisk (*); neutralization titer was less than 3X the negative control virus (MuLV).
Fig. 4
Fig. 4. Isolation and characterization of heterologous HIV-1 neutralizing mAbs in neonatal SHIV infection.
A Overview of BEAM-Ab (10X Genomics) pipeline and analytical plan used to isolate antigen-reactive B cells from representative RMs that generated plasma heterologous HIV-1 nAbs following neonatal SHIV infection. B Summary of BEAM-Ab assay outcomes from two representative RMs, V093 and V055, from which we isolated heterologous HIV-1 Env binding and nAbs; DH1518.1, DH1518.2 and DH1523. C Binding profile of DH1518.1, DH1518.2, and DH1523. MAb binding was measured via ELISA at OD450nm against heterologous and autologous SOSIP trimers used as B cell baits in BEAM-Ab. D (Left) NSEM structure of DH1518.1 (green) in complex with T250SOSIP trimer (gray). Candidate glycans within the mAb binding site are shown in different colors and labeled on the trimer. (Right) Overlay of DH1518.1 (green) and DH1518.2 (purple) in complex with the same T250 trimer. NSEM was performed with IgGs. E Neutralization curves of DH1518.1, DH1518.2, and DH1523 with maximal neutralization titers against sensitive heterologous tier 2 HIV-1 strains and MuLV. The percent viral quasi-species neutralized per virus at different mAb concentration is shown and the dash lines indicate 0 and 50% neutralization points; the latter may be used to determine IC50 titer that achieves optimal neutralization. F Summary of neutralization titer and breadth of DH1518.1 and DH1518.2 against a panel of 119 heterologous tier 2 HIV-1 strains as well as the reference HIV-1 neutralization global panel of 9 heterologous strains; both panels were tested in separate laboratories. G Neutralization epitope mapping for DH1518.1 and DH1518.2 against HIV-1 25710, a representative sensitive heterologous tier 2 HIV-1 strain shown in panel (E). MAbs were tested for neutralization of HIV-1 bearing wild-type or mutant Env. Mutations were created to disrupt V2-apex (N160K), V3-glycan (N332A) and CD4BS (N280D) bnAb epitopes. Neutralization assays were performed in TZM-bl cells and titers reported as IC50 in µg/ml as shown in the neutralization key. B, C, E, G Source data are provided as a Source Data file.
Fig. 5
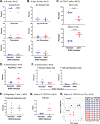
Fig. 5. Germinal center dynamics of immune cell subsets in neonatal and adult SHIV infection.
Flow cytometry phenotype of immune cell subsets in LNs at ~12 months post neonatal and adult SHIV infection of RMs. All samples were collected from 12 months post-SHIV infection, except one dam who had samples collected at month 10 post-SHIV infection (see methods). A CD20+ B cells were further classified based on differential levels of Ki-67 and Bcl-6; resting B cells (ki67−, Bcl-6−), germinal center (GC) B cells (Ki-67+, Bcl-6+), and plasmablasts (Ki-67+, Bcl-6−). Resting, GC and plasmablast B cell subsets were reported as a percentage (%) of total LN B cells. B Autologous HIV-1 Env SOSIP trimer was used as a B cell bait to determine the percent of Ag-reactive B cells within each B cell subset. Antigen-reactive (Ag+) resting, GC and plasmablast cells were reported as a percent of total Ag+ LN B cells. C Helper T cells (CD3+, CD4+) were further subdivided into naïve or memory subsets based on CD45RA levels (naïve, CD45RA+; memory, CD45RA−). These T cell subsets were reported as a percent of LN CD4+ T cells. D Frequency of FOXP3+ Tregs within the memory helper T cell subset. Tregs were reported as a percent of total lymphocytes. E Frequency of TFR among Tregs. TFR cells were defined as CXCR5+ and ICOS+ among the FOXP3+ Tregs. TFR cells were reported as a percent of Tregs. F TFH cells (PD-1hi, ICOS + ) among the memory helper T cells, and TFR cells, shown as a percent of total lymphocytes. G Ratio of percent TFR to percent TFH within total lymphocytes in the LN. H (Left) Graph of ratio of % TFR:TFH and plasma viral load (PVL) in neonates and adults following ~12 months of SHIV infection; and (right) animal IDs with corresponding values for ratio of % TFR:TFH and PVL shown on the left. AG These data were generated from a single experiment comparing cell subsets in neonate (N = 5) and adult (N = 5) RMs, and all graphs were generated in GraphPad Prism (v9 or v10) and statistics performed using two-sided Mann–Whitney testing; only statistically significant differences are indicated (p-values < 0.05). Geometric mean (horizontal bars) used for all comparisons except Ag+ graphs where arithmetic mean was used to allow values of zero. AF Gating hierarchy of immune cell subsets is provided in source data; Source data are provided as a Source Data file.
Fig. 6
Fig. 6. Gene expression analysis of total lymph node (LN) cells following neonatal and adult SHIV infection.
Bulk RNA-seq analysis was performed on total LN immune cells ~12 months after neonate and adult SHIV infection. All samples were collected from month 12 post-SHIV infection, except one dam (V057) that had samples collected at month 10 post-SHIV infection. All 10 RMs studied generated autologous HIV-1 NAbs, but 4/5 neonate (V055, V058, V094, and V095) and 1/5 adult (BD62) RMs generated heterologous tier 2 HIV-1 NAbs. Genes were quality filtered, quantified and analyzed using various computational tools (see methods). A Gene expression levels of FOXP3 in LNs of adult (N = 5) and neonate (N = 4) RMs using normalized count values by DESeq2; infants—242 (V094), 361 (V055), 383 (V095) and 541 (V058); adults—733 (BD62), 915 (BG15), 975 (V056), 1247 (V057) and 1477 (BJ56). Statistical analysis was performed using a two-sided Wald test for differential gene expression. The reported adjusted p-value of 0.0004 was obtained using the Benjamini-Hochberg procedure to control the false discovery rate (FDR), ensuring adjustments were made for multiple comparisons. B Expression levels of genes involved in the development and function of Treg cells, which were significantly downregulated in neonates compared to adults around 12 months post-SHIV infection, as visualized in a heatmap. The key shows gene upregulation (red) versus downregulation (blue) in adult and neonate SHIV-infected RMs. C Gene set enrichment analysis (GSEA) performed using the fgsea R package with MSigDB’s hallmark, curated, ontology, and immunologic signature gene sets to correlate gene expression changes in neonatal SHIV infection with relevant biological pathways. Directionality: gene sets enriched in upregulated genes shown on the right and those enriched in downregulated genes on the left. The enrichment score for each gene set is calculated using a weighted Kolmogorov–Smirnov statistic to measure the enrichment of each gene set using an ordered gene list. P-values are derived from 1000 permutations of gene labels, creating a null distribution of enrichment scores for comparison. The resulting p-values are adjusted using the Benjamini–Hochberg method to control the false discovery rate (FDR). This permutation method assesses the significance of the enrichment scores under the null hypothesis that gene labels are randomly associated with their expression changes (AC) Source data are provided as a Source Data file.
Fig. 7
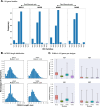
Fig. 7. Ig gene repertoires in neonatal and adult SHIV infection.
At month 12 post-infection, we interrogated the Ig gene usages and their immunogenetics that contribute to the B cell receptor (BCR) repertoires in neonate (V055 and V093) and adult (BG15 and V060) SHIV-infected RMs. Neonate and dam pairs: V055/BG15 and V093/V060. Shown are the frequencies of VH gene families VH1-VH7 (A), HCDR3 length distribution as percentages (B) and SHM frequencies of VH genes of different antibody isotypes (IgA, IgD, IgG and IgM) (C), used by BCRs of neonate and adult SHIV-infected RMs. Frequencies were shown as a portion of 1 and percentages shown as a portion of 100. Macaque Ig genes were computationally inferred using macaque reference databases. For panel (C), the box is the interquartile range of 25th percentile to the 75th percentile of the data with the median also shown, and the whiskers show the upper and lower bounds of the mutation frequencies. AC Source data are provided as a Source Data file.
Fig. 8
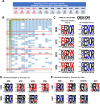
Fig. 8. HIV-1 Env Evolution Signature Analysis in Neonatal and Adult SHIV Infection.
A List of 12 total SHIV-infected neonate RMs that generated plasma heterologous HIV-1 NAbs following SHIV CH848 10.17 DT.E169K infection as previously described. Among the 12 RMs, eight had increasing plasma NAb titers against one or more heterologous HIV-1 strains as indicated. For the current study, we defined HIV-1 neutralization breadth (low-to-moderate) as neutralization of 30% or more viruses from the virus panel tested at month 18 (M18). Four RMs that developed HIV-1 neutralization breadth are indicated in red font. B LASSIE selected variability env sites that were shared across 3 or more animals (V = variable), ordered by most shared (top) to least. A site was defined to be variable if the LASSIE algorithm detected a loss of 50% or more of the corresponding CH8481017.DT.E169K residue at any given time point. Each column represents an animal, and animals that developed HIV-1 neutralization breadth are highlighted in yellow. Among all sites, 5 were significantly associated with breadth by Fisher exact test (shown in red box). C Logo plots at the 5 sites significantly associated with HIV-1 neutralization breadth comparing animals that developed breadth (left) to those that did not (right). Residues of challenge virus CH8481017.DT.E169K at those positions are shown at the top. Residues more prevalent in one group but not the other are color coded; red, enriched in the breadth group; blue, the non-breadth group. D, E Logo plots at the 5 sites significantly associated with HIV-1 neutralization breadth comparing the neonate (top) to the paired dam (bottom). Residues are color coded red/blue according to whether they are found to be enriched in the HIV-1 neutralization breadth or no-breadth groups, respectively. In panel (D), we studied neonate V058 that developed breadth and by month 18 was able to neutralize 4/8 viruses, while the paired adult dam BD62 did not develop breadth (ID50 threshold of >60). In panel (E), we studied neonate V093 and paired adult dam V060 which both developed HIV-1 neutralization breadth by month 18 and 16, respectively, at the timepoints where we performed Env sequencing analysis. CE Source data are provided as a Source Data file.

References

    1. Adkins, B., Leclerc, C. & Marshall-Clarke, S. Neonatal adaptive immunity comes of age. Nat. Rev. Immunol.4, 553–564 (2004). PubMed PMID: 15229474. - PubMed
    1. Semmes, E. C. et al. Understanding early-life adaptive immunity to guide interventions for pediatric health. Front Immunol.11, 595297 (2021). - PMC - PubMed
    1. Thome, J. J. et al. Early-life compartmentalization of human T cell differentiation and regulatory function in mucosal and lymphoid tissues. Nat. Med.22, 72–77 (2016). - PMC - PubMed
    1. Martinez, D. R., Permar, S. R. & Fouda, G. G. Contrasting adult and infant immune responses to HIV infection and vaccination. Clin. Vaccin. Immunol.23, 84–94 (2015). - PMC - PubMed
    1. Hodgins, D. C. & Shewen, P. E. Vaccination of neonates: problem and issues. Vaccine30, 1541–1559 (2012). - PubMed

Publication types

MeSH terms

LinkOut - more resources