. 2024 Nov 27;15(1):10300.
doi: 10.1038/s41467-024-54757-2.

Rab8a restores diverse innate functions in CD11c+CD11b+ dendritic cells from aged mice

Affiliations

Rab8a restores diverse innate functions in CD11c+CD11b+ dendritic cells from aged mice

Sudhakar Singh et al. Nat Commun. .

Abstract

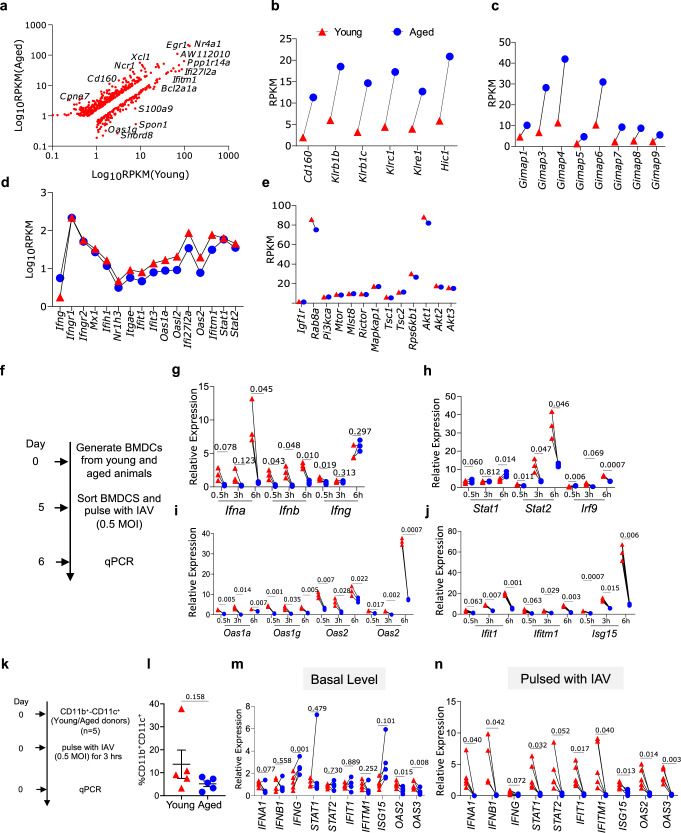
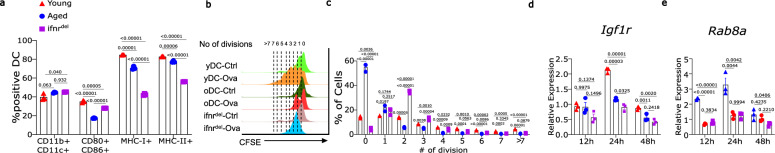
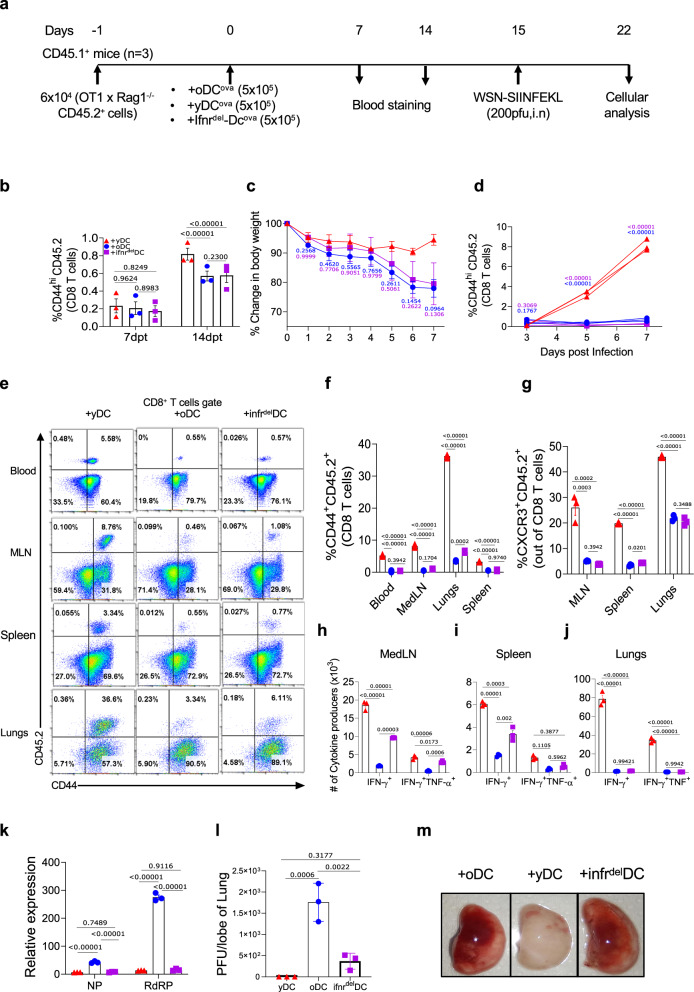
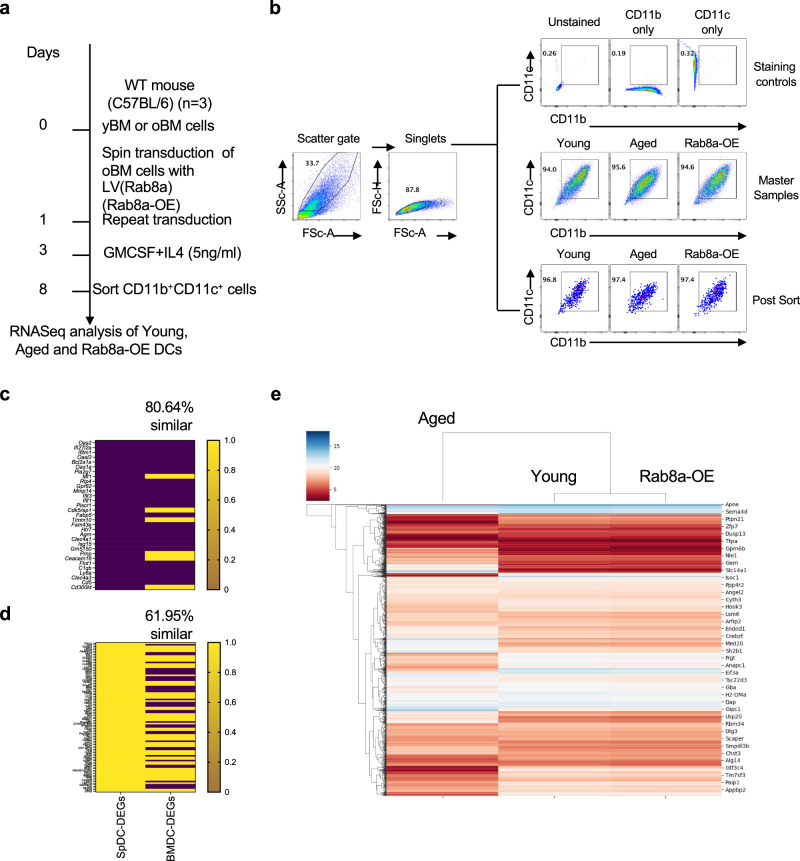
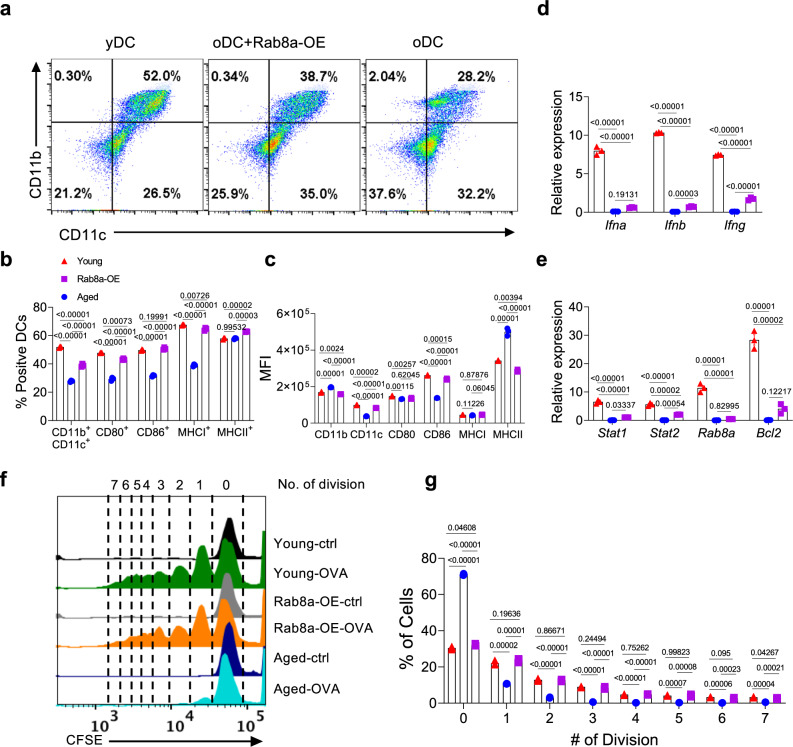
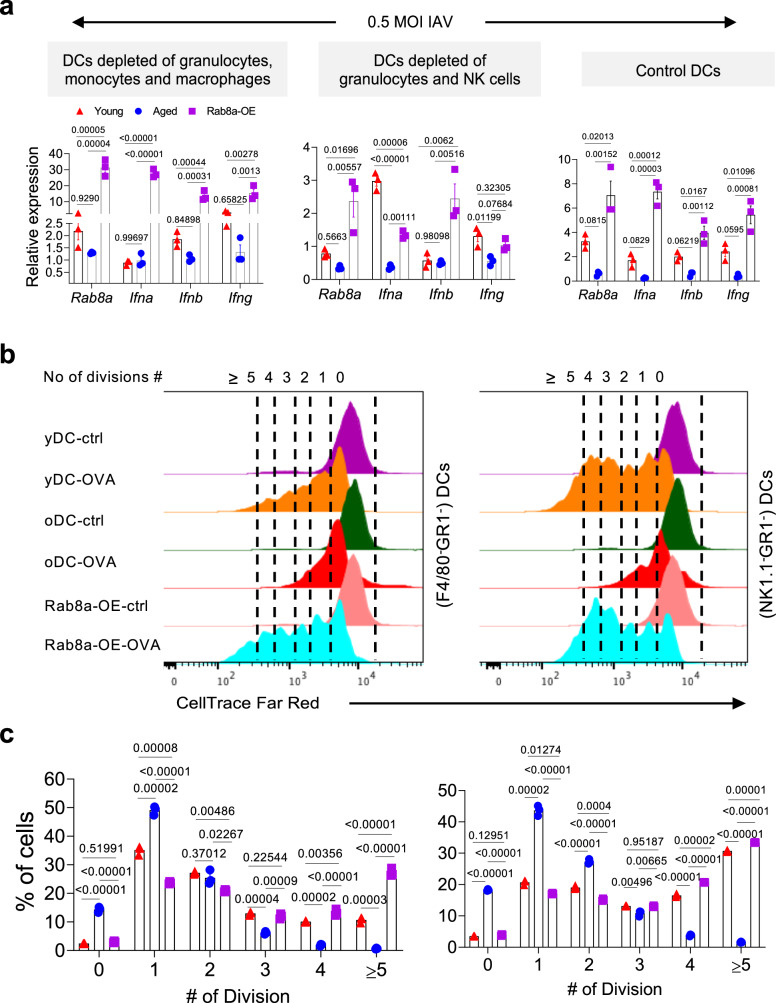
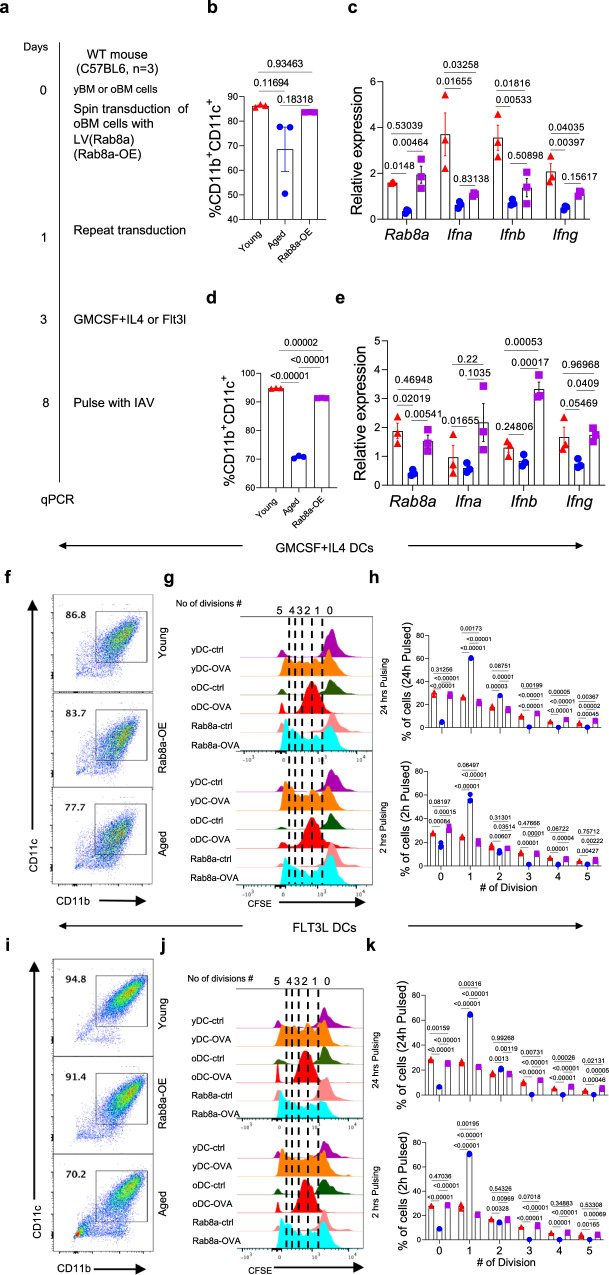
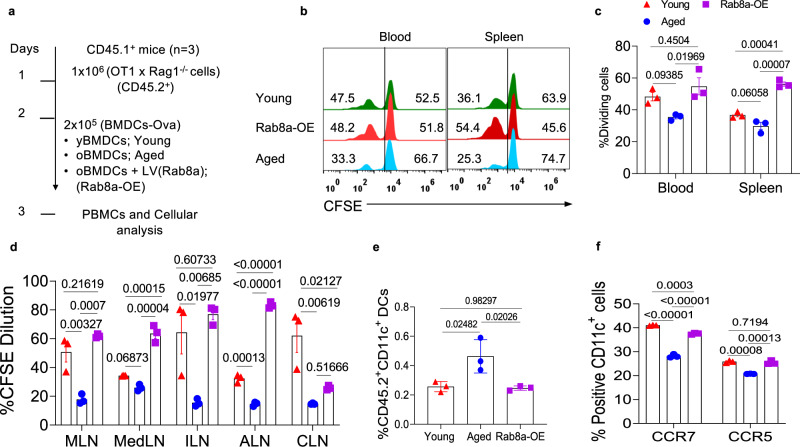
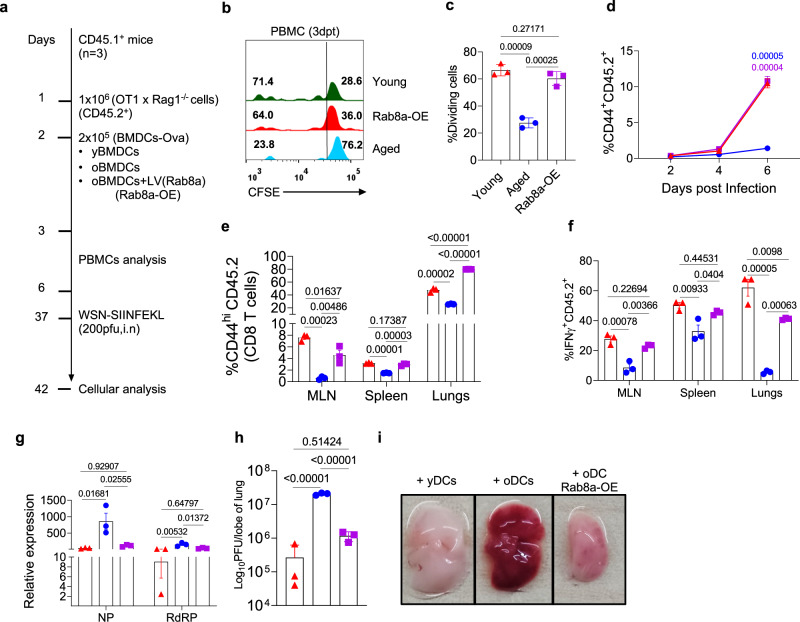
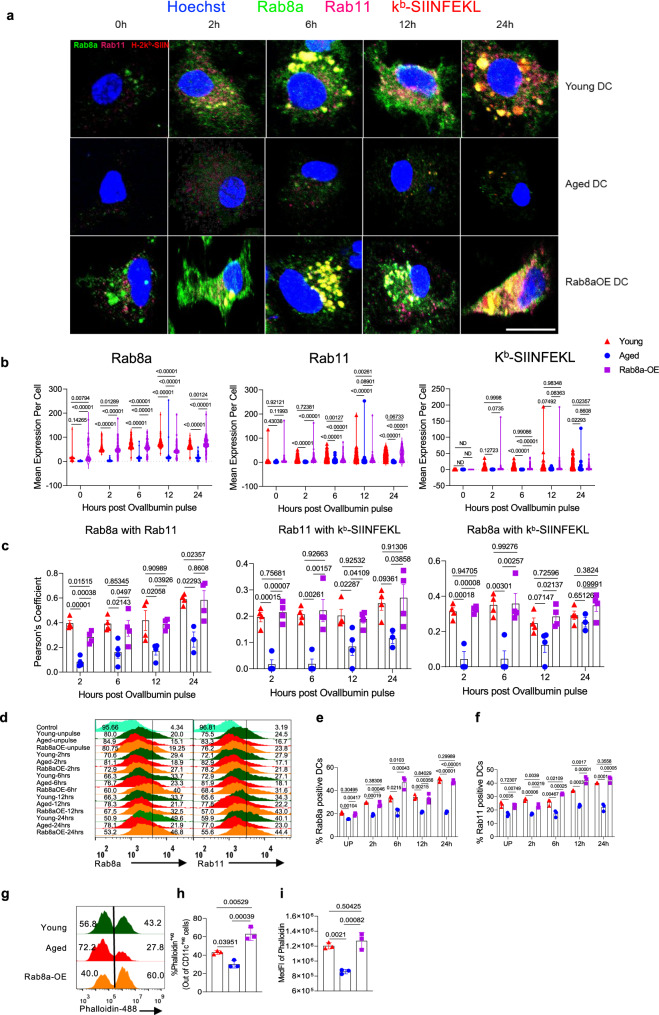
Age-related alterations of the immune system compromise the host's ability to respond to pathogens, but how immune aging is regulated is still poorly understood. Here, we identify via transcriptomic analysis of splenic DCs and bone marrow derived dendritic cells (BMDC) of young and aged mice, the small GTPase Rab8a as a regulator of dendritic cell (DC) functions in mice. CD11c+CD11b+ DCs of aged in comparison to young host exhibit a diminished type I IFN response upon viral stimulation and inefficiently present exogenous antigens to CD8+ T cells in vitro and in vivo. Rab8a overexpression, which is accompanied by the upregulation of Rab11, restores the functionality of these aged DCs, whereas knockdown of Rab8a reduces functionality of DCs from young mice. Mechanistically, Rab8a and Rab11 cooperate to induce efficient trafficking of peptide loaded class I MHC molecules from the ER to the cell surface. We propose that targeting Rab8a might serve as a strategy to restore DC functionality in the context of immune aging.


Conflict of interest statement

Competing interests: The authors declare no competing interests.

Figures

Fig. 1
Fig. 1. Transcriptome analysis of CD3ε−veCD19−veCD11c+veCD11b+ve splenocytes of young and aged animals reveal a compromised type I IFN response in the aged cells.
a Dot plot shows the expression of genes in CD3ε−veCD19−veCD11c+veCD11b+ve splenocytes of aged and young animals. b Graph shows the expression of key inhibitory genes differentially expressed by aged and young CD3ε−veCD19−veCD11c+veCD11b+ve splenocytes. c Graphs show the expression GIMAP family genes in the splenic CD3ε−veCD19−veCD11c+veCD11b+ve cells of aged and young mice. d Line graphs show log10 RPKM values for the expressed genes of type I IFN pathway in the splenic CD3ε−veCD19−veCD11c+veCD11b+ve cells of young and aged animals. e RPKM values for the indicated genes responsible for differentiation of DCs in splenic CD3ε−veCD19−veCD11c+veCD11b+ve cells of aged and young animals are shown. fj Measuring the expression of IFNs and interferon stimulated genes (ISGs) in IAV stimulated GM-CSF + IL-4 CD11+CD11b+ BMDCs of young and aged mice. f A schematic of the experiments is shown. The FACS-sorted GM-CSF + IL-4 CD11+CD11b+ cells from young and aged mice were stimulated with 0.5 multiplicity of infection (MOI) of IAV (WSN-SIINFEKL) for the indicated time. The stimulated cells were processed for RNA isolation and cDNA synthesis. The relative expression of different genes of IFN pathway was then measured by quantitative reverse transcriptase (qRT)-PCR. gj The relative expression of different genes involved in type I IFN pathway are shown. Three technical replicates were used for each group. The levels of statistical significance were analysed by a paired two-tailed t-test and the p-values are shown. kn Measuring the expression of IFNs and ISGs in virus stimulated CD11c+CD11b+ enriched PBMCs of young and aged humans. k Schematic for the experiment is shown. The PBMCs isolated from aged ( > 65 years) and young ( < 25 years) individuals were FACS sorted for CD11c+CD11b+ cells (50 × 103) which were then stimulated with 0.5MOI of IAV for the indicated time points. The expression of different genes was analysed by qRT-PCR. l A plot summarising the frequency of the CD11b+CD11c+ cells in each group is shown. Mean ± SEM values are indicated. Five biological replicates were used for each group. m, n Plots show the relative expression of the indicated genes of type I IFN pathways. Mean ± SEM values are shown. Five biological replicates were used for each group. The data is representative of three experiments. The levels of statistical significance were analysed by a paired two-tailed t-test and the p-values have been reported.
Fig. 2
Fig. 2. Phenotypic analysis of GM-CSF + IL-4 CD11c+CD11b+ Bone Marrow Dendritic Cells (BMDC) of young, aged and interferon receptor knockout (ifnrdel) mice.
Bone marrow from young, aged and ifnrdel mice were cultured in the presence of GM-CSF and IL-4 for 6 days for generating BMDC. The cells were then phenotypically characterized. a Bar graphs summarise the frequency of cells expressing the indicated markers. Three biological replicates were used for each conditions. The experiments were performed three time and the data from one of the representative experiments is shown. The levels of statistical significance were analysed by One-way ANOVA followed by Tukey Kramer post hoc test and the p-values are shown. b, c GM-CSF + IL-4 CD11c+CD11b+ cells were FACS-sorted and pulsed with Ova for 2 hours. The washed cells were then co-cultured with CFSE labelled OT1 cells for 72 hours. CFSE dilution was then used as a measure of cell division. b Representative offset histograms show the frequency of proliferating CD8+ T cells in the indicated conditions. c Bar diagram shows data from one of the representative experiments. Three technical replicates were used for each condition. The levels of statistical significance were analysed by One-way ANOVA followed by Tukey Kramer post hoc test and the p-values are shown. The experiments were repeated more than five times and Mean ± SEM values are shown. d, e Bar graph shows relative expression of Igf1r (d) and Rab8a (e) in the FACS-sorted GM-CSF + IL-4 CD11c+CD11b+ BMDCs at the indicated time points using qRT-PCR. For each group three technical replicates were used. The experiments were repeated three times and Mean ± SEM values are shown. The levels of statistical significance were analysed by One-way ANOVA followed by Tukey Kramer post hoc test and the P-values have been reported.
Fig. 3
Fig. 3. Comparative assessment of young, aged and interferon receptor knockout (ifnrdel) BMDCs in priming CD8+ T cell using DC immunisation.
a BMDCs were in vitro differentiated from the bone marrow of young, aged and ifnrdel young mice. Equal numbers of FACS-sorted GM-CSF + IL-4 CD11c+CD11b+ cells were then pulsed with ovalbumin for 2 hours. The cells were washed 5 times with cold PBS to remove any soluble Ova protein and 5×10⁵ cells were transferred into CD45.1+ animals ( + oDCova: Aged DC recipients, +yDCova: young DC recipients, +ifnrdelDCova: ifnrdel DC recipients; n = 3/each group) which were previously infused with 6×10⁴ OT1 cells/mouse. The recipients were then infected intranasally with an Influenza-A Virus (IAV, WSN-SIINFEKL) two weeks later to assess the OT1 response. b Bar diagrams summarise the frequency of expanded donor cells in the blood of the recipients at 7 and 14 days post BMDC transfer. Each point represents a biological replicate (n = 3). Data are shown as Mean ± SEM values and the levels of statistical significance were analysed by One-way ANOVA followed by Tukey Kramer post hoc test and the p-values are shown. c Line graph shows the change in body weights of different groups of animals at indicated days post infection (dpi). The levels of statistical significance were analysed by One-way ANOVA followed by Tukey Kramer post hoc test and the p-values are shown. p-values in blue colour are for the comparison between young and aged cell recipients whereas those in purple color are for comparison between young and ifnrdel cell recipients. d Line graph showing the kinetics of expanded virus-specific donor CD8+ T cells in peripheral blood of recipients at different days post infection. The levels of statistical significance were analysed by One-way ANOVA followed by a Tukey Kramer post hoc test and the p-values are shown. e Representative FACS plot from different lymphoid and non-lymphoid organs show the distribution of specific donor cells. f Bar graphs show the frequencies of donor cells in different organs. g Bar graph depicts the frequency of CXCR3+CD45.2+CD8+ T cells in different organs of BMDCs recipients. hj ICCS assays were performed wherein cells from mediastinal LN (MedLN, h), spleen (i) and lungs (j) were stimulated with SIINFEKL-peptide to assess their functionality. Bar graphs show the number of indicated cytokine-producing cells. k Bar graph shows the viral load in the lungs of infected animals using influenza virus genes encoding for NP and RNA dependent RNA polymerase (RdRP) using specific primers. l Dot plots show the viral titres in the lungs as measured by plaque forming assays. For each group three biological replicates were used. m Representative images of lungs in each of the recipients are shown. The levels of statistical significance were analysed by One-way ANOVA followed by Tukey Kramer post hoc test and the p-values are shown. The data is representative of three individual replicates.
Fig. 4
Fig. 4. Transcriptomic analysis of young, aged and Rab8a overexpressing (Rab8a-OE) BMDCs.
a A Schematic of experiments is shown. Bone marrow cells from aged mice were transduced to overexpress Rab8a. BMDCs were then generated by culturing the aforementioned cells in GM-CSF and IL-4 for 6 days. CD11c+CD11b+ cells were then FACS-sorted and RNAseq was performed to assess the transcriptome of the young, aged and Rab8a-OE BMDCs of aged animals. b The sorting strategy for purifying the GM-CSF + IL4 CD11c+CD11b+ BMDCs for RNASeq analysis of each group is shown. c, d The trend in DEGs between CD3ε−veCD19−veCD11c+veCD11b+ve splenocytes and GMCSF + IL4 CD11c+CD11b+ BMDCs was compared by generating similarity matrices. Similarity matrices summarising the downregulated DEGs (c) and upregulated DEGs (d) are shown. e A heatmap summarising the total transcriptome of each cell type is shown.
Fig. 5
Fig. 5. Rab8a influences the differentiation and functionality of DCs.
a Representative FACS plots for analysis of CD11c+CD11b+ cells in each group are shown. b, c Phenotypic characterisation of BMDCs from different groups of cells is shown. The frequency (b) of the cells expressing the indicated markers and MFI values (c) for the markers are summarised as bar graphs. Three biological replicates were used for each condition. d, e Bar-graph show the expression of the key genes involved in type I IFN pathway in the GM-CSF + IL-4 CD11c+CD11b+ cells generated from young, aged and Rab8a-OE aged cells upon stimulation with IAV. Three technical replicates were used for each condition. f, FACS-sorted GM-CSF + IL-4 CD11c+CD11b+ cells generated from young, aged and Rab8a-OE were pulsed with ovalbumin and then co-cultured with OT1 cells to measure their capability to stimulate OT1 cells. f Offset histograms show the extent of cell divisions in OT1 cells upon co-incubation. g Bar-graph depicts the frequency of CD8+ T cells in each division. Three technical replicates were used for each condition. The data is representative of four individual replicates. The levels of statistical significance were analysed by One-way ANOVA followed by Tukey Kramer post hoc test and the p-values are shown.
Fig. 6
Fig. 6. Assessing the functional contribution of contaminating monocytic (Ly6C), granulocytic (Ly6G), macrophages (F4/80) and NK (NK1.1) cells in GM-CSF + IL-4 BMDCs.
Of the CD11c+CD11b+ DCs, the cells that were negatively stained for F4/80GR1 or NK1.1GR1 were sorted. Refer to supplementary Fig. 12 for the sorting strategy. a The sorted F4/80GR1CD11c+CD11b+, NK1.1GR1CD11c+CD11b+ DCs and the control CD11c+CD11b+ cells were pulsed with 0.5MOI of IAV for 3hrs and subsequently analysed for measuring the expression of the indicated genes by qRT-PCR. Unstimulated cells from each group were used as a control for normalisation of the expression data. a Bar graphs show the relative expression of the indicated genes in different conditions. For each group three technical replicates were used. b, c Representative offset histograms (b) and the bar graphs (c) show the frequencies of CFSE diluted OT1 cells that were co-cultured with F4/80GR1CD11c+CD11b+ or NK1.1GR1CD11c+CD11b+ cells that were supplemented with Ova for 2 hours. For each group three technical replicates were used. The experiments were repeated three times and representative data from one such experiment is shown. The levels of statistical significance were analysed by One-way ANOVA followed by Tukey Kramer post hoc test and the p-values are shown.
Fig. 7
Fig. 7. A comparative analysis of the in vitro functionality of GM-CSF + IL-4 and Flt-3l induced BMDCs reconstituted of Rab8a.
a A schematic of the experiment is shown. Young, aged and Rab8a-OE bone marrow cells were cultured for 6 days with either GM-CSF/IL-4 or Flt3l. The cells were then functionally characterized. b The frequencies of GMCSF + IL4 CD11c+CD11b+ cells in each group are shown. For each group three technical replicates were used. c The generated GM-CSF + IL4 CD11c+CD11b+ cells were pulsed with 0.5MOI of IAV and the transcript abundance for the indicated genes were measured via qRT-PCR. Bar diagrams show the relative expression of the indicated genes. For each group three technical replicates were used. d The frequencies of Flt3l CD11c+DCs in each group are summarized. Three technical replicates were used for each group. e The generated Flt3l CD11c+CD11b+DCs were stimulated with 0.5MOI of IAV and the transcript abundance for the indicated genes were measured via qRT- PCR. Bar diagrams show the relative expression of the indicated genes. Three technical replicates were used for each condition. f,g In a separate set of experiments, the generated GMCSF + IL4 BMDCs or the Flt3l BMDCs were pulsed with Ova for 2- and 24-hrs and were then co-cultured with CFSE labelled OT1 cells for 72 hrs. f Representative FACS plots show the frequencies of GM-CSF + IL4 CD11c+CD11b+ cells in each group. g Representative offset histograms show the frequencies of CFSE diluting OT1 cells co-cultured with ova pulsed GM-CSF + IL4 CD11c+CD11b+ cells as indicated. h Bar graphs show the frequencies of CFSE diluted cells within each division of CFSE diluted OT1 cells. Three technical replicates were used for each condition. i Representative FACS plots show the frequencies of Flt3-l DCs in each group. j Representative offset histograms show the frequencies of CFSE diluting OT1 cells co-cultured with ova pulsed Flt3l-CD11c+ DCs in indicated conditions. k Bar graphs show the frequencies of CFSE diluted cells within each division of CFSE diluted OT1 cells. Three technical replicates were used for each condition. The experiments were performed four times and data from one such experiment is shown. The levels of statistical significance were analysed by One-way ANOVA followed by Tukey Kramer post hoc test and the p-values are shown.
Fig. 8
Fig. 8. Comparative assessment of in vivo antigen presentation capability of young, aged and Rab8a-OE GM-CSF + IL-4 CD11c+CD11b+ BMDCs.
In vivo antigen presentation by young, aged and Rab8a-OE GM-CSF + IL-4 CD11c+CD11b+ cells from was performed. a A schematic of the experiments is shown. 2×10⁵ Ova pulsed FACS-sorted GM-CSF + IL-4 CD11c+CD11b+ cells generated from young, aged and Rab8a-OE bone marrow cells were transferred into CD45.1+ animals which were previously infused with 1×10⁶ CSFE labelled OT1 cells. 72hrs post transfer of BMDCs, the animals were euthanized and the expansion of the donor CD8+ T cells was measured. b Representative offset histograms show the frequency of divided OT 1 cells in peripheral blood and spleen. c Bar graphs show the frequencies of divided OT 1 cells. Three biological replicates were used for each group. d Bar graphs show the percentage of OT1 cells that have atleast undergone one division in the indicated LNs. (MLN: Mesenteric, MedLN: Mediastinal, ILN: Inguinal, ALN: Axillary, CLN: Cervical). Three biological replicates were used for each condition. e Bar graphs show the percentage of CD45.2+CD11c+ donor BMDCs in the peripheral blood of recipients. Three biological replicates were used for each condition. f Bar graph shows the frequency of CCR5+CD11c+ and CCR7+CD11c+ BMDCs generated from different conditions. Three biological replicates were used for each group. The experiments were repeated three times and representative data from one of the experiments is shown. Data represent Mean ± SEM values. The levels of statistical significance were analysed by One-way ANOVA followed by Tukey Kramer post hoc test and the p-values are shown.
Fig. 9
Fig. 9. Rab8a reconstituted BMDCs generate efficient memory CD8+ T cells.
a A schematic of the experiments is shown. In-vitro generated GM-CSF + IL-4 CD11c+CD11b+ cells from young, aged and Rab8a-OE bone marrow cells were FACS-sorted and pulsed with Ova for 2hrs. After extensive washings, 2×10⁵ of the GM-CSF + IL-4 CD11c+CD11b+ cells were adoptively transferred into sex matched CD45.1+ congenic animals that were previously infused with 1×10⁶ of CFSE labelled OT1 cells. The expansion of donor OT1 cells was then analysed in the acute phase in the peripheral blood and following a challenge with IAV (WSN-SIINFEKL) to recall memory cells. b Representative offset histograms show the expansion of the transferred CFSE labelled CD8+ T cells at 3 days post transfer of BMDCs. c Bar graphs show percentage of divided cells. Three biological replicates were used for each group. d Line diagrams show the kinetics of expanded antigen-specific donor OT1 cells in the peripheral blood of recipients post WSN-SIINFEKL infection. Three biological replicates were used for each group. Data is represented as Mean ± SEM and the levels of statistical significance were analysed by One-way ANOVA followed by Tukey Kramer post hoc test and the p-values are shown. e Bar graphs show the frequency of expanded OT1 cells in the mediastinal LN (MLN), spleen and lungs of WSN-SIINFEKL infected mice. Three biological replicates were used for each group. f Bar graphs show the frequencies of IFN-γ+ cells following SIINFEKL-peptide stimulation as assessed by ICCS assays. Three biological replicates were used for each condition. g Bar graphs show viral load in lung tissues of the infected group of animals as measured by quantifying the mRNA of IAV genes encoding nucleoprotein (NP) and RNA dependent RNA polymerase (RdRp) specific primers. n = 3 biological replicates. Data is represented as Mean ± SEM and the levels of statistical significance were analysed by One-way ANOVA followed by Tukey Kramer post hoc test and the p-values are shown. h Dot plot shows the viral titres in infected lungs as measured by plaque forming assays. n = 3 biological replicates. Data is represented as Mean ± SEM and the levels of statistical significance were analysed by One-way ANOVA followed by Tukey Kramer post hoc test and the p-values are shown. i Representative images of lungs from each group show haemorrhagic lesions in the each group of the recipients. The experiments were repeated three times and representative data from one such experiment is shown.
Fig. 10
Fig. 10. Rab8a promotes antigen-processing and presentation by GM-CSF + IL-4 CD11c+CD11b+ BMDCs of aged animals by efficiently displaying peptide-MHC I complexes.
a Confocal microscopic images show the expression of Rab8a, Rab11 and H-2Kb-SIINFEKL when GM-CSF + IL-4 CD11c+CD11b+ cells from young, aged and the cells of aged animals following Rab8a overexpression (Rab8a-OE) pulsed with Ovalbumin for indicated time points. Scale bar = 10μm. b Plots showing the cumulative data for mean expression levels of Rab8a, Rab11 and H-2Kb-SIINFEKL. (The exact number of cells used for analysis are indicated within the source data file). c The colocalization of different molecules was measured by Pearson’s coefficient in GM-CSF + IL-4 CD11c+CD11b+ cells of each group following ovalbumin stimulation for the indicated time points. A total of 4 fields with at least 50 cells were analysed for colocalization. The experiments were performed three times and data from one such experiments are shown as Mean ± SEM values. d Representative offset histograms show the intracellular expression levels of Rab8a and Rab11 in the permeabilized GM-CSF + IL-4 CD11c+CD11b+ cells which were fed with Ova as indicated. e Bar graphs show Rab8a expressing GM-CSF + IL-4 CD11c+CD11b+ cells. Three technical replicates were used for each condition. f Bar graphs show Rab11 expressing GM-CSF + IL-4 CD11c+CD11b+ cells. Three technical replicates were used for each condition. g Offset histogram show the frequency of phalloidin-AF488 positive GM-CSF + IL-4 CD11c+CD11b+ BMDCs from each group. h Bar graph show cumulative data for frequencies of phalloidin-AF488 positive cells. i MFI values for phalloidin-AF488 are shown in the GM-CSF + IL-4 CD11c+CD11b+ cells in the indicated conditions. Three technical replicates were used for each condition. The experiments were repeated three times and data from one such experiment is shown as Mean ± SEM values. The levels of statistical significance were analysed by One-way ANOVA followed by Tukey Kramer post hoc test and the p-values are indicated.

References

    1. Pennock, N. D. et al. T cell responses: naive to memory and everything in between. Adv. Physiol. Educ.37, 273–283 (2013). - DOI - PMC - PubMed
    1. Weyand, C. M. & Goronzy, J. J. Aging of the immune system. Mechanisms and therapeutic targets. Ann. Am. Thorac. Soc.13, S422–S428 (2016). - DOI - PMC - PubMed
    1. Nikolich-Žugich, J. The twilight of immunity: emerging concepts in aging of the immune system. Nat. Immunol.19, 10–19 (2018). - DOI - PubMed
    1. Ponnappan, S. & Ponnappan, U. Aging and immune function: molecular mechanisms to interventions. 10.1089/ars.2010.3228 (2011). - PMC - PubMed
    1. Crooke, S. N., Ovsyannikova, I. G., Poland, G. A. & Kennedy, R. B. Immunosenescence and human vaccine immune responses. Immun. & ageing16, 1–16 (2019). - DOI - PMC - PubMed

Publication types

MeSH terms

Associated data