. 2024 Nov 27;7(1):1581.
doi: 10.1038/s42003-024-07268-1.

Mechanical forces inducing oxaliplatin resistance in pancreatic cancer can be targeted by autophagy inhibition

Affiliations

Mechanical forces inducing oxaliplatin resistance in pancreatic cancer can be targeted by autophagy inhibition

Maria Kalli et al. Commun Biol. .

Abstract

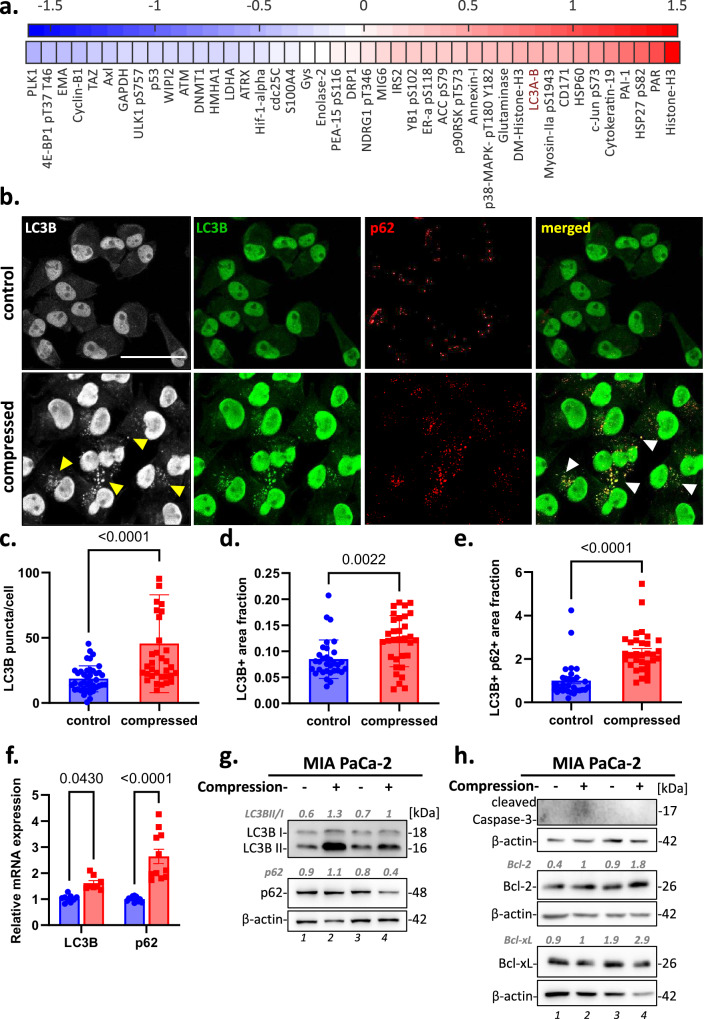
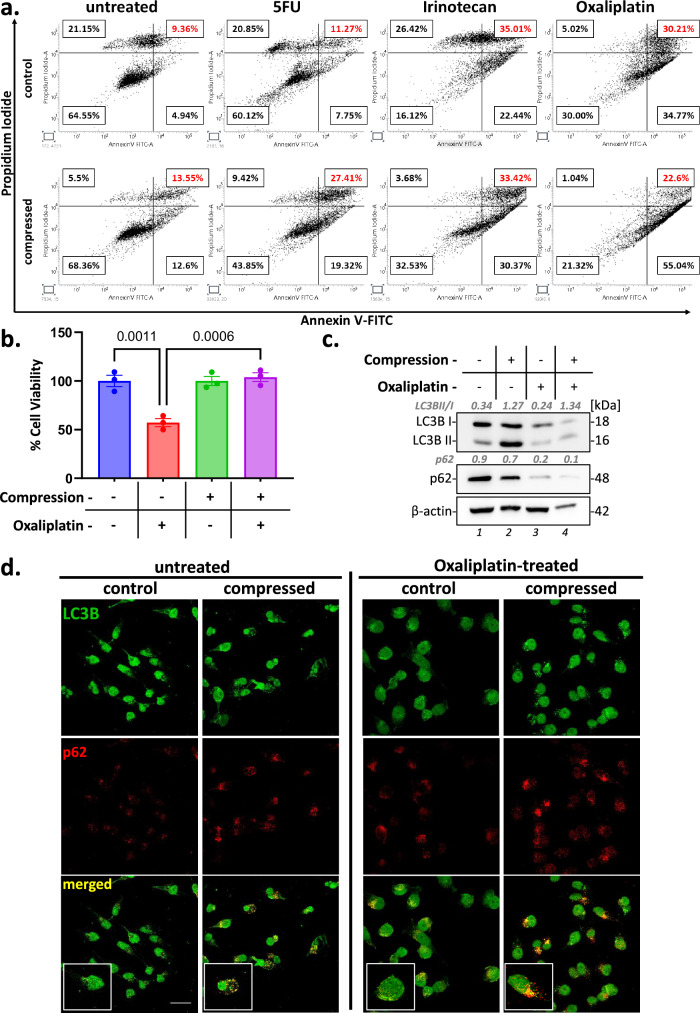
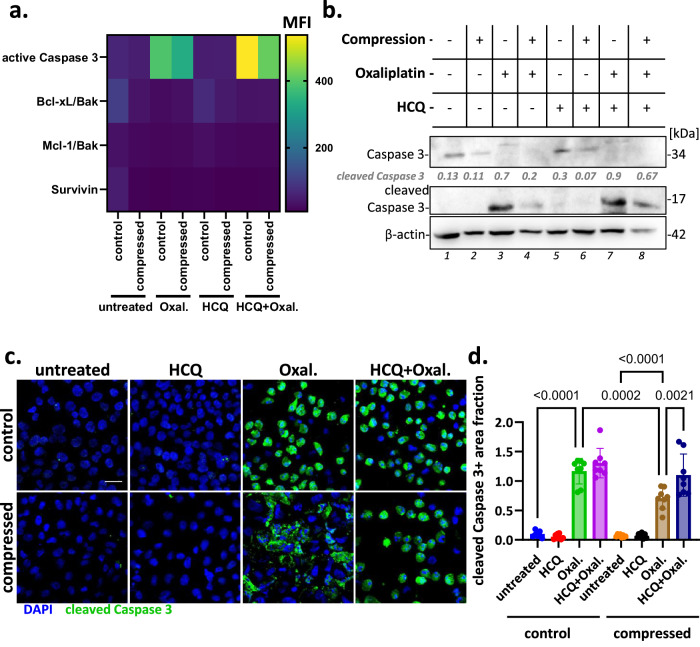
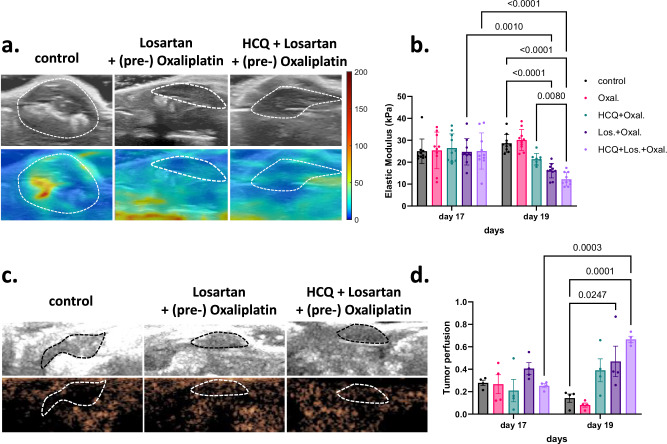
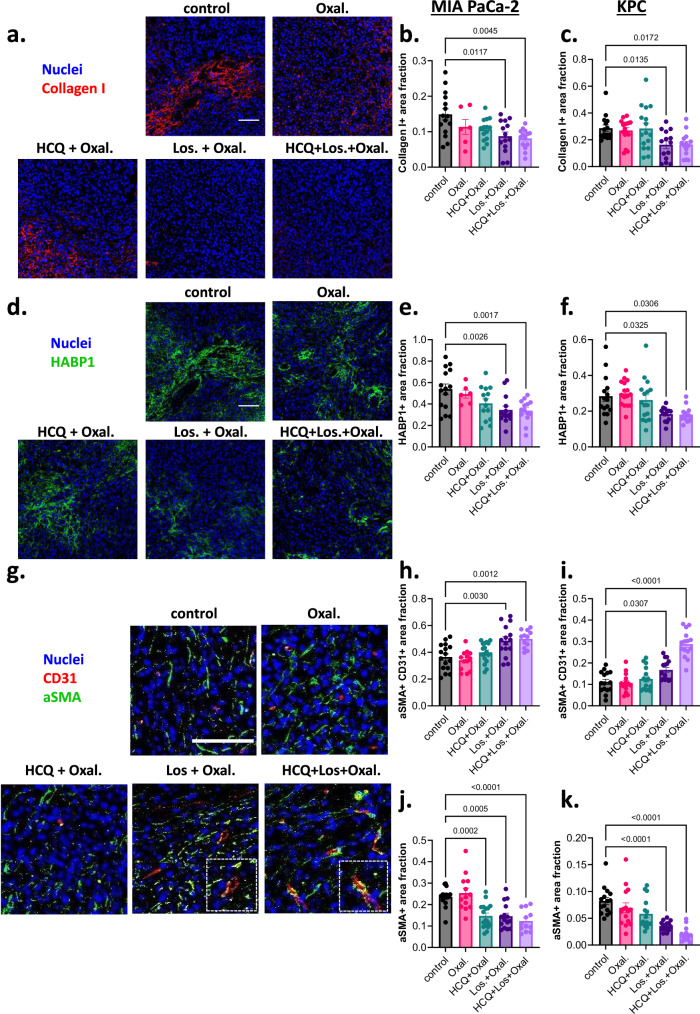
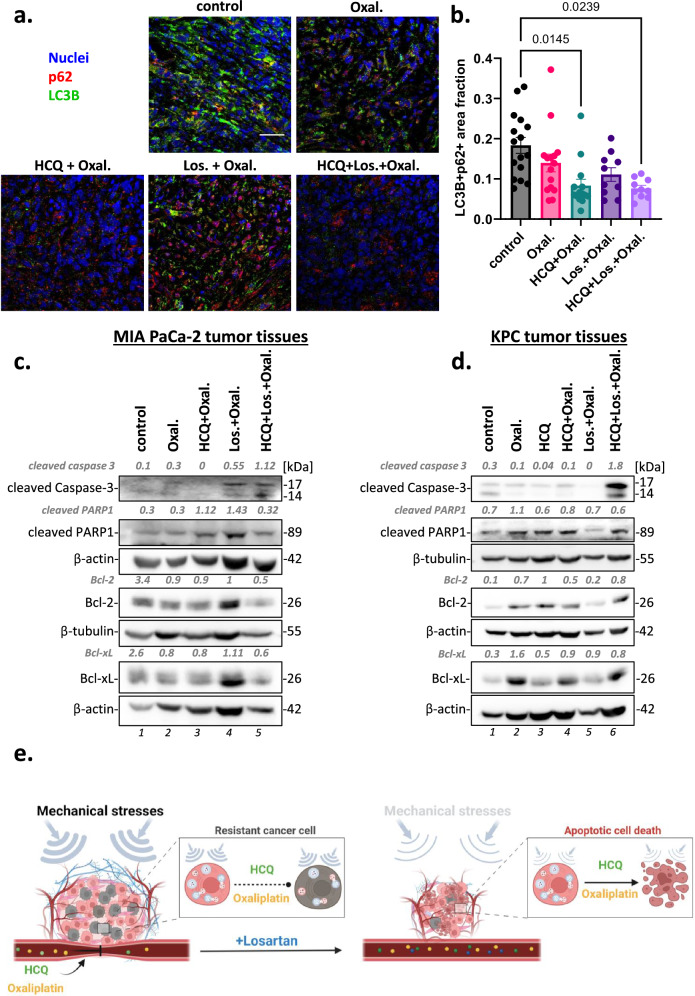
Pancreatic cancer remains one of the most lethal malignancies, with limited treatment options and poor prognosis. A common characteristic among pancreatic cancer patients is the biomechanically altered tumor microenvironment (TME), which among others is responsible for the elevated mechanical stresses in the tumor interior. Although significant research has elucidated the effect of mechanical stress on cancer cell proliferation and migration, it has not yet been investigated how it could affect cancer cell drug sensitivity. Here, we demonstrated that mechanical stress triggers autophagy activation, correlated with increased resistance to oxaliplatin treatment in pancreatic cancer cells. Our results demonstrate that inhibition of autophagy using hydroxychloroquine (HCQ) enhanced the oxaliplatin-induced apoptotic cell death in pancreatic cancer cells exposed to mechanical stress. The combined treatment of HCQ with losartan, a known modulator of mechanical abnormalities in tumors, synergistically enhanced the therapeutic efficacy of oxaliplatin in murine pancreatic tumor models. Furthermore, our study revealed that the use of HCQ enhanced the efficacy of losartan to alleviate mechanical stress levels and restore blood vessel integrity beyond its role in autophagy modulation. These findings underscore the potential of co-targeting mechanical stresses and autophagy as a promising therapeutic strategy to overcome drug resistance and increase chemotherapy efficacy.


Conflict of interest statement

Competing interests: The authors declare no competing interests.

Figures

Fig. 1
Fig. 1. Mechanical compression promotes autophagy in pancreatic cancer cells.
a Heatmap showing proteins exhibiting the largest relative increases (red) or decreases (blue) in compressed MIA PaCa-2 cells as compared to the control/uncompressed cells. Proteins were previously analyzed by RPPA, and values in the heatmap represent the 30 proteins with the highest principal component coefficients for the 2nd principal component and the 20 proteins for the 1st principal component—both primarily influenced by mechanical stress (resulting in a total of 43 different proteins from both principal components). Differences were considered significant with P < 0.05 (n = 3 independent experiments). b Representative immunofluorescent images of LC3B (white, green) and p62 (red) staining in MIA PaCa-2 cells 24 h post-compression (scale bar: 0.05 mm). ce Average quantification of LC3B puncta per cell (c) and area positive for LC3B (d) or area positive for LC3B and p62 (e) normalized to total image area. Data are presented as mean ± SE (n = 3 independent experiments; at least 10 image fields per experiment). Differences were considered significant with P < 0.05 in unpaired t-test analysis. f LC3B and p62 mRNA expression were quantified by qPCR in control and compressed MIA PaCa-2 cells. Each bar indicates the mean fold change ±SE (n = 3 independent experiments; at least 3 technical replicates per experiment). Differences were statistically significant when P < 0.05 in two-way ANOVA multiple comparison analysis (Sidak’s multiple comparisons test). g Representative immunoblotting showing LC3BI, LC3BII, and p62 protein levels in control and compressed MIA PaCa-2 cells from two biological replicates. Antibody against β-actin was used as a loading control. Quantification of each antibody compared to loading control was quantified by ImageJ. Numbers in gray font represent the ratio of LC3BII/I (an indicator of autophagic vacuoles) and p62 (an indicator of autophagic degradation) expression normalized to β-actin. h Representative immunoblotting showing cleaved Caspase 3 (not detected), Bcl-2 and Bcl-xL protein levels in control and compressed MIA PaCa-2 cells from two biological replicates. Antibody against β-actin was used as a loading control. Quantification of each antibody compared to loading control was quantified by ImageJ and is indicated by the numbers in gray font.
Fig. 2
Fig. 2. Compression-induced autophagy impairs the efficacy of oxaliplatin in pancreatic cancer cells.
a Flow cytometry analysis of Annexin V and Propidium Iodide (PI) staining of apoptotic cells following 5FU (20 μg/mL), irinotecan (60 μg/mL), and oxaliplatin (100 μg/mL) treatment under mechanical compression. Viable cells are in the lower left quadrant, early apoptotic cells are in the lower right quadrant, late apoptotic cells are in the upper right quadrant, and non-viable necrotic cells are in the upper left quadrant. Dot plots are representative of 0.5 × 104 cells from a single replicate. b MIA PaCa-2 cells were treated with 100 μg/mL oxaliplatin and in the presence of 4 mmHg of compression for 24 h. Resazurin assay was then performed, and graphs represent the average % of cell viability ±SE in Resazurin reduction using as a reference the untreated and uncompressed- or the treated and compressed cells, respectively. Differences were considered as significant when P < 0.05 in ordinary one-way ANOVA analysis (n = 3 independent samples). c Representative immunoblotting showing LC3BI, LC3BII, and p62 protein levels in control and compressed MIA PaCa-2 cells treated with oxaliplatin for 24 h. Antibody against β-actin was used as a loading control. Quantification of each antibody compared with loading control was quantified by ImageJ. Numbers in gray font represent the ratio of LC3BII/I and p62 expression normalized to β-actin for each condition. d Representative immunofluorescent images of LC3B (green) and p62 (red) staining in MIA PaCa-2 cells treated with oxaliplatin for 24 h under mechanical compression (scale bar: 0.05 mm).
Fig. 3
Fig. 3. Pharmacological inhibition of autophagy increases the oxaliplatin-induced apoptosis.
a Differential expression heatmap depicts the mean fluorescent intensity (MFI) for the expression of the indicated apoptotic markers in control and compressed MIA PaCa-2 cells treated with oxaliplatin and/or HCQ from 2 biological replicates as measured using a multiplex apoptosis assay. The color intensity scale represents the relative MFI values ranging from the highest (500; yellow) to the lowest antibody response (10; blue) (n = 2 independent experiments; 3 technical replicates per experiment). b Representative immunoblotting showing Caspase 3 and cleaved Caspase 3 protein levels in control and compressed MIA PaCa-2 cells treated with HCQ (10 μΜ) combined or not with oxaliplatin (100 μg/mL) for 24 h. Antibody against β-actin was used as a loading control. Quantification of each antibody compared to loading control was quantified by ImageJ. Numbers in gray font represent the average ratio of cleaved Caspase 3 (17 kDa)/β-actin protein expression in each condition (n = 2 independent experiments). c Representative immunofluorescent images of cleaved Caspase 3 (green) staining in MIA PaCa-2 cells treated with oxaliplatin and/or HCQ for 24 h under mechanical compression. Nuclei were stained with DAPI (blue) (scale bar: 0.05 mm). d Quantification of the fraction of the area positive for cleaved Caspase-3 (green) staining, normalized to DAPI (blue) staining, in MIA PaCa-2 cells treated with the indicated treatments. Data are presented as mean ± SE (n = 2 independent experiments; 4 image fields per replicate). Differences were considered significant with P < 0.05 in unpaired t-test analysis.
Fig. 4
Fig. 4. Combination of HCQ with losartan improved the efficacy of oxaliplatin in MIA PaCa-2 and KPC tumors.
a Study treatment protocol for the MIA PaCa-2 tumor model. Losartan and HCQ were administered at 40 and 50 mg/kg daily for 5 days, respectively, via intraperitoneal injection (i.p.) when tumor size reached an average volume of 60 mm3. Two cycles of oxaliplatin treatment (5 mg/kg) were administered via intravenous injection (i.v.) starting on day 19, allowing losartan to reprogram the TME and HCQ to block the autophagic process for 3 days. b Growth curves of MIA PaCa-2 tumors treated as indicated until day 22. Data are presented as mean ± SE (n = 7 mice per treatment group). Statistical analyses were performed by comparing means between two independent groups using the two-way ANOVA test (Tukey’s multiple comparisons test). P-values less than 0.05 are denoted on the bar graph. c, d Relative volumes of MIA PaCa-2 (a) and KPC (b) tumors treated as indicated (n = 7 mice per treatment group; n = 6 mice in HCQ + Oxal.-treated group). e, f Bar graphs represent the tumor mass of MIA PaCa-2 (c) and KPC (d) tumors. Data are presented as mean ± SE (n = 7 mice per treatment group; n = 6 mice in HCQ + Oxal.-treated group). Statistical analyses were performed by comparing means between two independent groups using the two-way ANOVA test (Tukey’s multiple comparisons test). P-values less than 0.05 are denoted on the bar graph. g, h Fraction of MIA PaCa-2- (e) and KPC- (f) tumor-bearing mice responding to treatment. Graphs indicate mice bearing progressive-, stable-, or responsive tumors. Responsive: relative tumor volume change <0.8, stable: relative tumor volume change < 1.2, and progressive: relative tumor volume change >1.2. Panel (a) was created with BioRender.com.
Fig. 5
Fig. 5. The combination of HCQ with losartan reduces the elastic modulus and increases tumor perfusion.
a Representative SWE images of control, losartan- and HCQ + losartan-treated MIA PaCa-2 tumors prior to the 1st cycle of oxaliplatin treatment. The dashed line denotes the tumor region, and the color map indicates the different magnitudes of elastic modulus in kPa. b Graph showing the elastic modulus before and after losartan or HCQ + losartan treatment of MIA PaCa-2 tumors (n = 10 mice per treatment group; 8 mice in the HCQ + Oxal.-treated group). c Representative CEUS images of microbubbles (orange) entering control, losartan- and HCQ + losartan-treated tumors at the time of peak intensity and prior to the 1st cycle of oxaliplatin. Dash line shows the tumor margin. d Graph represents the normalized perfused area with respect to the total tumor area at the time of peak intensity for MIA PaCa-2 tumors (n = 4 mice per group). Data are presented as mean ± SE. Statistical analyses were performed by comparing means between two independent groups using a two-way ANOVA test (Tukey’s multiple comparison test). P-values less than 0.05 are denoted on the bar graph.
Fig. 6
Fig. 6. The combination of HCQ with losartan normalizes TME.
a Representative immunofluorescence images of MIA PaCa-2 tumor tissue sections stained with anti-Collagen I (scale bar = 0.1 mm). b, c Quantification of the fraction of area positive for Collagen I stain normalized to DAPI (blue) stain in MIA PaCa-2 (b) and KPC (c) tumor tissue sections. Data are presented as mean ± SE (n = 2–3 tumors per condition; 3–5 image fields). d Representative immunofluorescence images of MIA PaCa-2 tumor tissue sections stained with anti-HABP1 (scale bar = 0.1 mm). e, f Quantification of the fraction of area positive for HABP1 stain normalized to DAPI (blue) stain in MIA PaCa-2 (e) and KPC (f) tumor tissue sections. Data are presented as mean ± SE (n = 2–3 tumors per condition; 3–5 image fields). g Representative immunofluorescence images of vessel pericyte coverage indicated by the overlapping of CD31 endothelial cell marker (red) and a-SMA (green) pericyte marker on MIA PaCa-2 tumor sections of the indicated treatment groups (scale bar = 0.1 mm). h, i Quantification of vessel pericyte coverage as indicated by CD31 and a-SMA overlapping staining (yellow) normalized to DAPI (blue) stain in MIA PaCa-2 (h) and KPC (i) tumors. Data are presented as mean ± SE (n = 3 tumors per condition; 4–5 image fields). j, k, Quantification of a-SMA stain normalized to DAPI (blue) stain in MIA PaCa-2 (j) and KPC (k) tumors. Data are presented as mean ± SE (n = 3 tumors per condition; 4–5 image fields). Statistical analyses were performed by comparing means between two independent groups using the two-way ANOVA multiple comparison test (Tukey’s correction). P-values less than 0.05 are denoted on the bar graphs.
Fig. 7
Fig. 7. HCQ effectively impairs autophagy and increases oxaliplatin-induced apoptosis in pancreatic tumors.
a Representative immunofluorescence images of anti-LC3B (green) and anti-p62 (red) staining of MIA PaCa-2 tumor sections with indicated treatments (scale bar = 0.1 mm). b Quantification of LC3B and p62 overlapping staining (yellow) normalized to DAPI (blue) stain in MIA PaCa-2 tumors. Data are presented as mean ± SE (n = 3 tumors per treatment group, 3–5 image fields). Statistical analyses were performed by comparing means between two independent groups using the two-way ANOVA test using Tukey’s multiple comparison test. P-values less than 0.05 are denoted on the bar graph. c, d Representative immunoblotting of cleaved Caspase 3, cleaved PARP1, Bcl-2, and Bcl-xL protein levels in MIA PaCa-2 (c) and KPC (d) tumor protein extracts of the indicated treatments. Antibody against β-actin or β-tubulin was used as a loading control. Quantification of each antibody compared to loading control was quantified by ImageJ. Numbers in gray font represent the protein expression normalized to β-actin. e Mechanical stress compresses blood vessels, reducing drug delivery, while also activating autophagy at the cellular level, leading to resistance against chemotherapy-induced apoptosis. A feedback loop is established, where even if HCQ is administered to block autophagy, mechanical stresses impair its efficacy. To counteract this, the combination of Losartan, which reduces mechanical stress, and HCQ offers a promising therapeutic strategy to enhance the efficacy of oxaliplatin by co-targeting both mechanical stress and autophagy pathways. Panel (e) was created with BioRender.com.

References

    1. Ducreux, M. et al. Systemic treatment of pancreatic cancer revisited. Semin. Oncol.46, 28–38 (2019). - PubMed
    1. Nevala-Plagemann, C., Hidalgo, M. & Garrido-Laguna, I. From state-of-the-art treatments to novel therapies for advanced-stage pancreatic cancer. Nat. Rev. Clin. Oncol.17, 108–123 (2020). - PubMed
    1. Martin, J. D., Cabral, H., Stylianopoulos, T & Jain, R. K. Improving cancer immunotherapy using nanomedicines: progress, opportunities and challenges. Nat. Rev. Clin. Oncol.10.1038/s41571-019-0308-z (2020). - PMC - PubMed
    1. Jain, R. K., Martin, J. D. & Stylianopoulos, T. The role of mechanical forces in tumor growth and therapy. Annu. Rev. Biomed. Eng.16, 321–346 (2014). - PMC - PubMed
    1. Martin, J. D., Seano, G. & Jain, R. K. Normalizing function of tumor vessels: progress, opportunities, and challenges. Annu. Rev. Physiol.81, 505–534 (2019). - PMC - PubMed

MeSH terms

LinkOut - more resources