. 2024 Nov 28;7(1):340.
doi: 10.1038/s41746-024-01349-5.

A virtual scalable model of the Hepatic Lobule for acetaminophen hepatotoxicity prediction

Affiliations

A virtual scalable model of the Hepatic Lobule for acetaminophen hepatotoxicity prediction

Stelian Camara Dit Pinto et al. NPJ Digit Med. .

Abstract

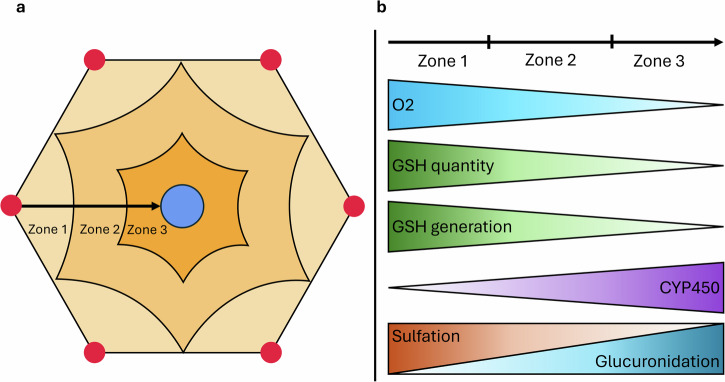
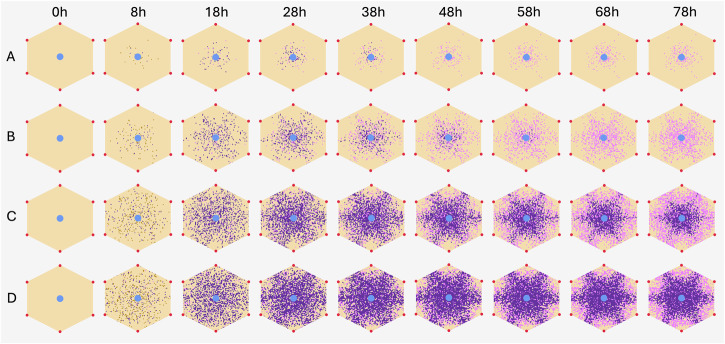
Addressing drug-induced liver injury is crucial in drug development, often causing Phase III trial failures and market withdrawals. Traditional animal models fail to predict human liver toxicity accurately. Virtual twins of human organs present a promising solution. We introduce the Virtual Hepatic Lobule, a foundational element of the Living Liver, a multi-scale liver virtual twin. This model integrates blood flow dynamics and an acetaminophen-induced injury model to predict hepatocyte injury patterns specific to patients. By incorporating metabolic zonation, our predictions align with clinical zonal hepatotoxicity observations. This methodology advances the development of a human liver virtual twin, aiding in the prediction and validation of drug-induced liver injuries.


Conflict of interest statement

Competing interests: S.M.L. is a Dassault Systemes employee. J.M.V. is a member of IQDILI and the NIH NIDDK Drug-Induced Liver Injury Network Data Safety and Management Board. N.R.G. has served as a consultant for Dassault Systemes. The remaining authors declare no competing interests.

Figures

Fig. 1
Fig. 1. Visualization of the different scales of the human liver.
From left to right: the organ scale (cm), the liver; the functional scale (mm), the lobule, and the cellular scale (μm) with hepatocytes in beige, stellate cells in blue, Kupfer cells in orange and endothelial cells in pink.
Fig. 2
Fig. 2. Virtual Hepatic Lobule APAP injury computational pipeline.
Green blocks depict input to the pipeline. The orange block represents the CFD component. The blue block represents the cellular injury model. The gray boxes depict the data exchange between blocks. The red block represents the output of the computational pipeline.
Fig. 3
Fig. 3. Hexagonal representation of the human lobule and zonation.
a Geometry of the lobule model depicting the zone boundaries. The red circle represents the portal veins (pressure inlet). The blue circle represents the central vein (pressure outlet). Three shades of beige depict the three lobular zones 1 through 3. b Depiction of metabolic zonation from the portal vein to the central vein driven by the oxygen gradient.
Fig. 4
Fig. 4. APAP, GSH, and NAPQI quantity evolution in the lobules for patient B.
a Evolution of the quantity of APAP entering hepatocytes (mol). b Evolution of the quantity of GSH in hepatocytes (mol). c Evolution of the quantity of NAPQI generated in hepatocytes (mol). d Heatmaps showing the quantity of APAP, GSH, and NAPQI in the whole lobule. Red circle represents the portal veins (pressure inlet). The blue circle represents the central vein (pressure outlet).
Fig. 5
Fig. 5. APAP, GSH, and NAPQI quantity evolution in the lobules for patient C.
a Evolution of the quantity of APAP entering hepatocytes (mol). b Evolution of the quantity of GSH in hepatocytes (mol). c Evolution of the quantity of NAPQI generated in hepatocytes (mol). d Heatmaps showing the quantity of APAP, GSH, and NAPQI in the whole lobule. Red circle represents the portal veins (pressure inlet). The blue circle represents the central vein (pressure outlet).
Fig. 6
Fig. 6. Lobular hepatocyte damage prediction maps over time for patients A, B, C, and D showing the hepatocyte health status (healthy in beige, damaged in brown, necrosed in purple, or regenerated in pink).
Red circle represents the portal veins (pressure inlet). The blue circle represents the central vein (pressure outlet).
Fig. 7
Fig. 7. Statistical comparisons between zonation and no-zonation model for patients B and D.
Specifically, comparing hepatocyte health across each zone at 18 and 58 h after APAP ingestion (healthy in beige, damaged in brown, necrosed in purple, or regenerated in pink). a Zone 1, b Zone 2, c Zone 3, and d all zones for patient B. e Zone 1, f Zone 2, g Zone 3, and h all zones for patient D. *p < 0.05, **p < 0.01, ***p < 0.001.

References

    1. Hosack, T., Damry, D. & Biswas, S. Drug-induced liver injury: a comprehensive review. Ther. Adv. Gastroenterol.16, 17562848231163410 (2023). - PMC - PubMed
    1. Jaeschke, H. & Ramachandran, A. Acetaminophen hepatotoxicity: paradigm for understanding mechanisms of drug-induced liver injury. Annu. Rev. Pathol. Mech. Dis.19, 453–478 (2024). - PMC - PubMed
    1. Li, X., Tang, J. & Mao, Y. Incidence and risk factors of drug-induced liver injury. Liver Int.42, 1999–2014 (2022). - PubMed
    1. Guengerich, F. P. Mechanisms of drug toxicity and relevance to pharmaceutical development. Drug Metab. Pharmacokinet.26, 3–14 (2011). - PMC - PubMed
    1. Watkins, P. B. Drug safety sciences and the bottleneck in drug development. Clin. Pharmacol. Ther.89, 788–790 (2011). - PubMed

LinkOut - more resources