. 2024 Nov 27;148(1):75.
doi: 10.1007/s00401-024-02835-6.

Elevated expression of the retrotransposon LINE-1 drives Alzheimer's disease-associated microglial dysfunction

Affiliations

Elevated expression of the retrotransposon LINE-1 drives Alzheimer's disease-associated microglial dysfunction

Nainika Roy et al. Acta Neuropathol. .

Abstract

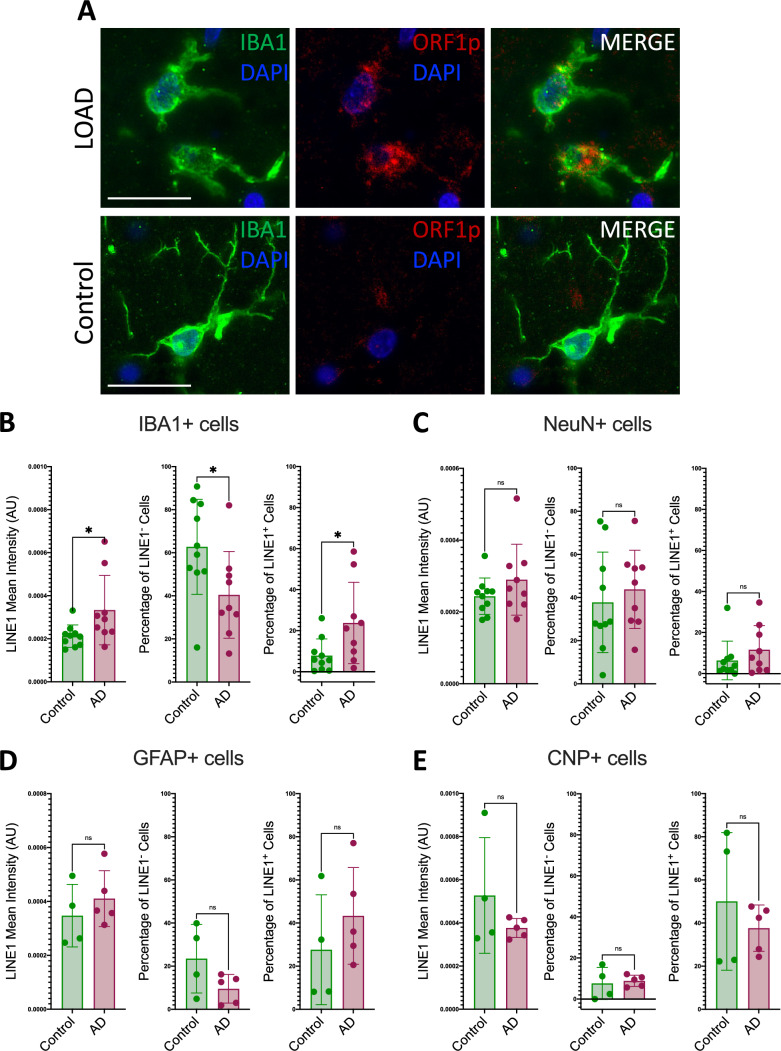
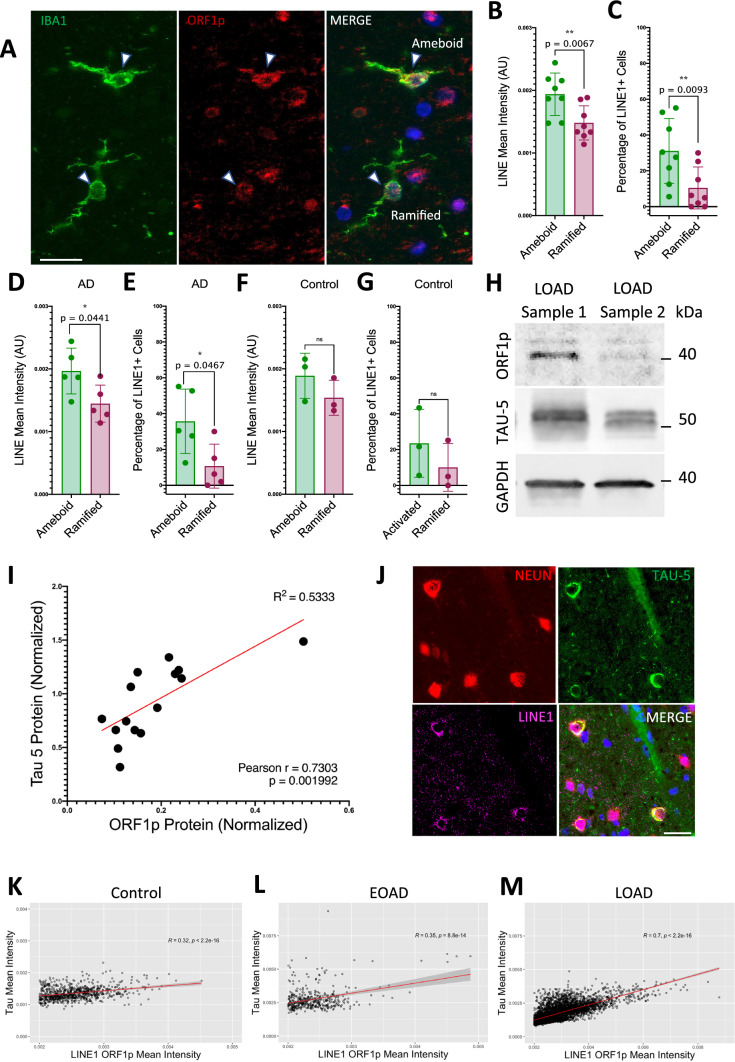
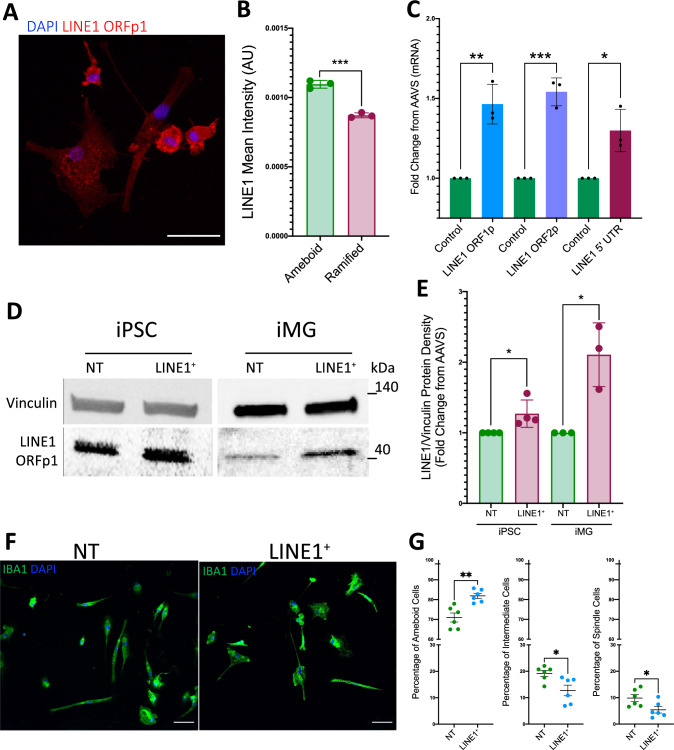
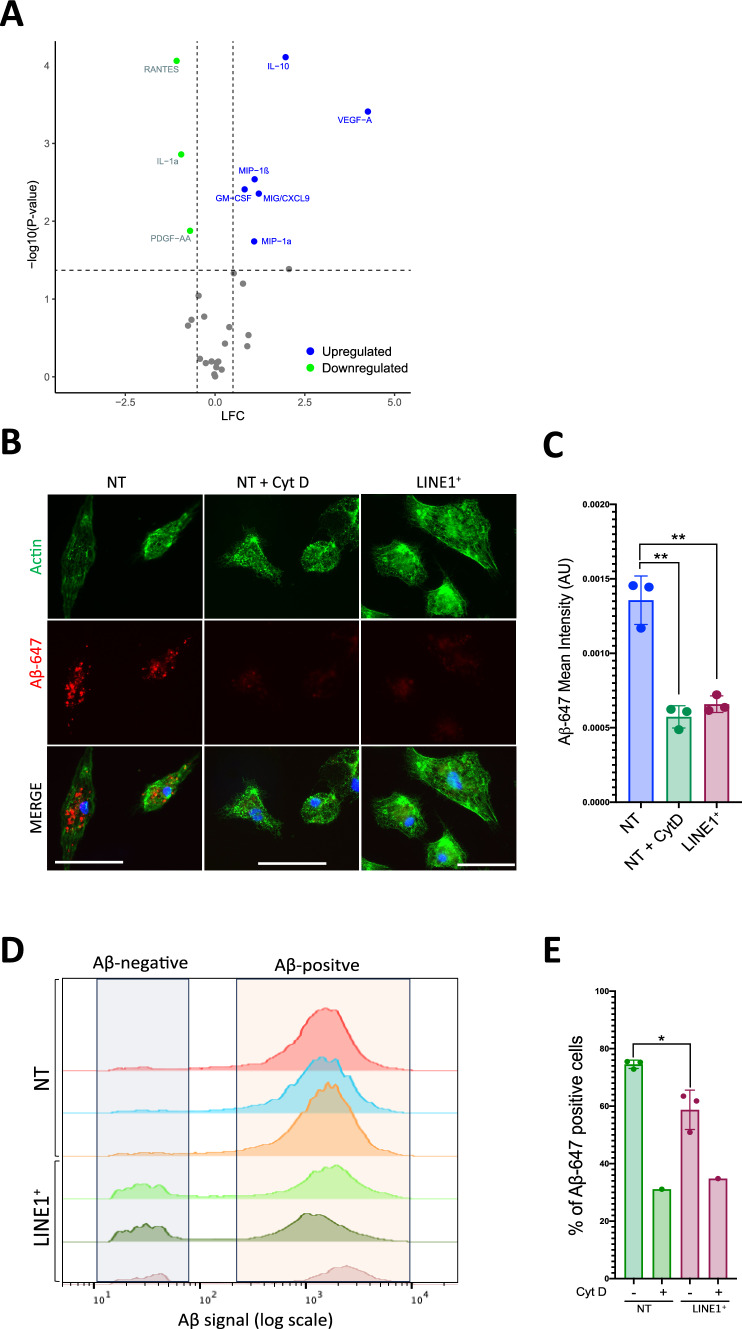
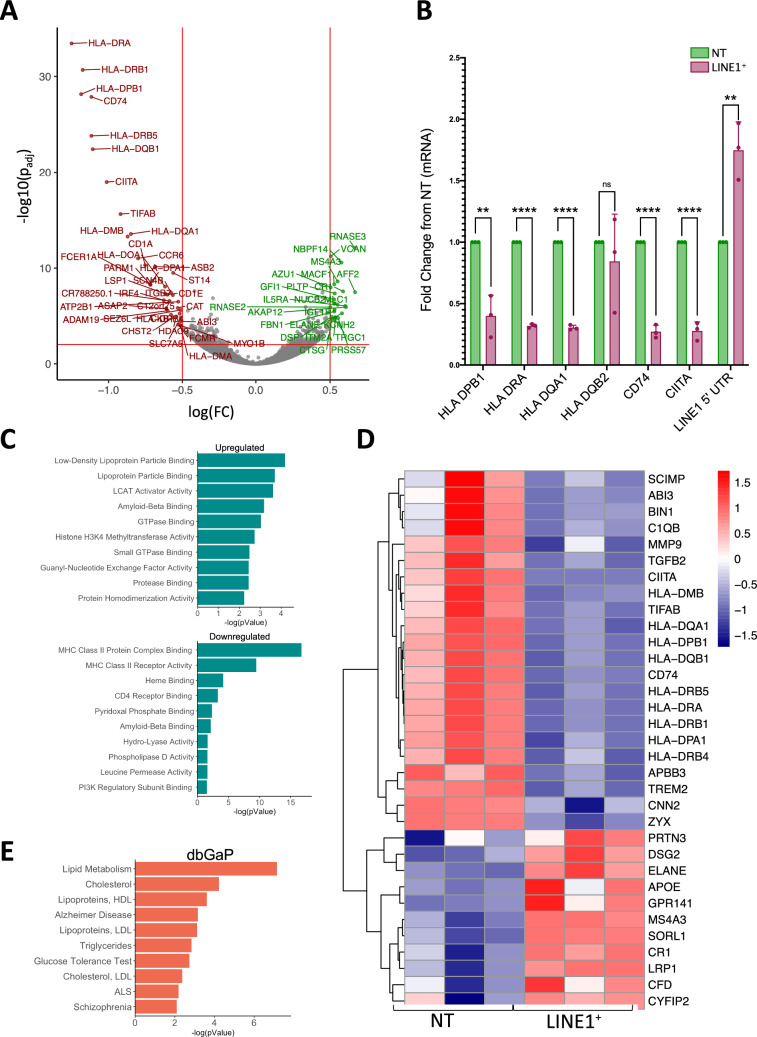
Aberrant activity of the retrotransposable element long interspersed nuclear element-1 (LINE-1) has been hypothesized to contribute to cellular dysfunction in age-related disorders, including late-onset Alzheimer's disease (LOAD). However, whether LINE-1 is differentially expressed in cell types of the LOAD brain, and whether these changes contribute to disease pathology is largely unknown. Here, we examined patterns of LINE-1 expression across neurons, astrocytes, oligodendrocytes, and microglia in human postmortem prefrontal cortex tissue from LOAD patients and cognitively normal, age-matched controls. We report elevated immunoreactivity of the open reading frame 1 protein (ORF1p) encoded by LINE-1 in microglia from LOAD patients and find that this immunoreactivity correlates positively with disease-associated microglial morphology. In human iPSC-derived microglia (iMG), we found that CRISPR-mediated transcriptional activation of LINE-1 drives changes in microglial morphology and cytokine secretion and impairs the phagocytosis of amyloid beta (Aβ). We also find LINE-1 upregulation in iMG induces transcriptomic changes genes associated with antigen presentation and lipid metabolism as well as impacting the expression of many AD-relevant genes. Our data posit that heightened LINE-1 expression may trigger microglial dysregulation in LOAD and that these changes may contribute to disease pathogenesis, suggesting a central role for LINE-1 activity in human LOAD.

Keywords: Alzheimer’s disease; LINE-1; Microglia; Neuroinflammation; Retrotransposons; Transposable elements.


Conflict of interest statement

Declarations. Conflict of interest: The authors declare no competing interests. Ethics approval and consent to participate: The research was conducted in accordance with the guidelines of Institutional Review Board (IRB) of Columbia University New York under protocol AAAR4962. This study utilized induced pluripotent stem cell (iPSC)-derived microglia, hence no direct human participants were involved. Human iPSC lines C1-iPSC (Gibco, catalog A18945), C2-iPSC (ATCC, catalog no. ACS-1024), and CU-iPSC (Columbia Stem Cell Initiative core facility), were obtained in accordance with ethical guidelines for research. Consent for publication: This manuscript does not contain data from individuals necessitating consent for publication.

Figures

Fig. 1
Fig. 1
LINE-1 activity is found in major CNS cell types of the aged human brain. A Representative images showing endogenous LINE-1 ORF1 (ORF1p) protein expression in cognitively healthy human DLFPC postmortem brain tissue in NeuN, IBA1, CNP and GFAP positive cells using indirect immunohistochemistry. B Quantification of average ORF1p integrated (total) fluorescence intensity/cell from three healthy DLPFC donors. Number of cells analyzed are 5937, 1565, 440 and 62 for NeuN + , IBA1 + , CNP + and GFAP + cells respectively. C A representative image of LINE-1 ORF1p expression in the nucleus. Scale bar represents 10 µm. Cell type markers are shown in green, ORP1p shown in red and DAPI represented as blue
Fig. 2
Fig. 2
Microglial LINE-1 ORF1p protein expression is increased in LOAD patients. A Representative images of IBA1 (green), ORF1p (red) and DAPI (blue) immunostaining in human postmortem brain tissue from LOAD patients and cognitively healthy controls examined by fluorescence microscopy. Scale bars represent 10 µm. BE Comparison of average LINE-1 ORF1p mean fluorescence per cell (AU) (left), the percentage of ORF1p-low expressing cells (middle) and the percentage of ORF1p-high expressing cells (right) between control and LOAD DLPFC microglia (B), neurons (C), astrocytes (D) and oligodendrocytes (E). Experimental information is as follows: B IBA1 + cells; n = 9 (control subjects) and n = 10 (LOAD subjects); average of 417 cells analyzed per patient. (C) NeuN + cells; n = 9 (control subjects) and n = 10 (LOAD subjects); average of 532 cells analyzed per patient. (D) GFAP + cells; n = 4 (control subjects) and n = 5 (LOAD subjects); average of 176 cells analyzed per patient. E CNP + cells; n = 4 (control subjects) and n = 5 (LOAD subjects); average of 74 cells analyzed per patient. Data are presented as mean ± S.D. and analyzed using an unpaired two-tailed t test; *P ≤ 0.05; ns: not significant. Exact P values can be found in source text. A detailed table with information regarding the human subjects and diagnosis can be found in Supplementary Table 1. Further information on image acquisition and analysis can be found in the Methods
Fig. 3
Fig. 3
LINE-1 activity correlates with AD-associated phenotypes in the human brain. A Representative images of IBA1 (green), ORF1p (red) and DAPI (blue) immunostaining demonstrating ORF1p expression level correlating with morphology in microglia; example cells denoted by white arrow. Scale bars represent 20 µm. B Comparison of average LINE-1 ORF1p mean fluorescence intensity per cell (AU) in ameboid and ramified microglia. C Comparison of percentage of cells with LINE-1 activity in ameboid and ramified microglia. DG Data from B and C stratified by disease state: LOAD (D and E) and control (F and G). n = 8 subjects (5 LOAD and 3 control). An average of 428 microglial cells were analyzed per individual subject. H Representative immunoblot and (I) and immunoblot quantification shown on a scatterplot of LINE-1 ORF1p and Tau-5 levels from 5 control and 10 LOAD patients, finding a strong linear correlation (Pearson r = 0.7303) between LINE-1 ORF1p and Tau-5 protein levels. Image densities were normalized to GAPDH expression prior to examining correlation. J Representative immunostaining from LOAD postmortem brain tissue showing strong overlap between LINE-1 ORF1p expression (pink) and Tau expression (green) in NeuN-labeled neurons (red). Scale bars represent 10 µm. KM Scatter plots demonstrating a modest correlation between Tau and LINE-1 in neurons from control patients, and a strong correlation between Tau and LINE-1 in neurons from EOAD and LOAD patients. n = 2 control subjects, with an average of 804 neurons analyzed per subject; n = 3 EOAD subjects, with an average of 358 neurons analyzed per subject; n = 4 LOAD subjects, with an average of 1358 neurons analyzed per subject. Data in B-G are presented as mean ± S.D. and analyzed using an unpaired two-tailed t test; *P ≤ 0.05; **P ≤ 0.01, ns: not significant. Exact P values can be found in source text. A detailed table with information regarding the human subjects and diagnosis can be found in Supplementary Table 1. Further information on image acquisition and analysis can be found in the Methods
Fig. 4
Fig. 4
Overexpression of LINE-1 induces hyporamification in iMG. A Representative fluorescence microscopy image of wild-type iMG ORF1p (red) and DAPI (blue) immunostaining in iMG showing increased expression ameboid iMG and reduced expression in ramified iMG. Scale bar represents 10µM. B Comparison of ORFp1 immunofluorescence intensity in ameboid and ramified iMG. n = 3 (three independent differentiations). An average of 245 iMG were analyzed per iMG line/experiment. C Relative mRNA expression of LINE-1 ORF1p, LINE-1 ORF2p and LINE-1 5’ UTR is increased in LINE-1+ iMG compared to control (NT-iMG). n = 3 biologically independent experiments. D Representative immunoblots and E quantifications of LINE-1 ORF1p and Vinculin protein showing increased ORF1p in iPSCs and corresponding iMG overexpressing LINE-1 compared to control (NT-iMG). F Representative images of IBA1 (green) and DAPI (blue) immunostaining showing cellular morphology in LINE-1-overexpressing iMG and NT control iMG. Scale bar represents 50 µm. G Quantification of the percentage of cells with ameboid, intermediate, and ramified morphology of LINE-1-overexpressing or NT control iMG, showing a significant increase of ameboid cells and a significant decrease in intermediate and ramified cells in LINE-1 overexpressing iMG compared with NT control. n = 6 experimental replicates, 3 biologically independent samples. An average of 274 iMG were analyzed per experimental replicate. Data are presented as mean ± S.D. and analyzed using an unpaired two-tailed t test; *P ≤ 0.05; **P ≤ 0.01, ***P ≤ 0.001, ns: not significant. Exact P-values can be found in source text
Fig. 5
Fig. 5
Increased LINE-1 activity drives altered immune response in iMG. A Volcano plot with data from multiplex array measuring cytokine concentration levels in supernatants from NT control and LINE-1 overexpressing iMG. Labeled cytokines indicate a significant (p < 0.05) difference in the concentration of the given cytokine between NT and LINE-1 overexpressing iMG. P values have been adjusted using the Benjamini–Hochberg FDR correction procedure. Dashed line indicates a LFC of 0.5. B Representative microscopy images of Aβ42 phagocytosis in NT control, NT control + Cytochalasin D, and LINE-1+ iMG. C Quantification of phagocytosis. n = 3 biologically independent experiments. An average of 265 iMG were analyzed per iMG line for each condition. D Histograms (flowcytometry) showing proportion of Aβ42-positive and negative cells in both populations. E Quantification of percentage differences in flow. Data are presented as mean ± S.D. and analyzed using an unpaired two-tailed t test; *P ≤ 0.05; **P ≤ 0.01. Exact P values can be found in source text. Scale bar represents 50 µm. LFC log fold change
Fig. 6
Fig. 6
Transcriptomic analysis of LINE-1+ iMG reveal compromised antigen presentation. A Volcano plot highlighting differential expression of LINE-1+ iMG compared to NT control iMG, analyzed using DESeq2. n = 3 biologically independent experiments. B qPCR validation of several top differentially expressed hits. n = 3 biologically independent experiments. C GO analysis of top 100 most significant differentially expressed hits upregulated and downregulated in LINE-1+ iMG using Enrichr examining Molecular Function GO terms. D Heatmap showing gene expression variation (Z score) for selected AD-associated genes between control and LINE-1 overexpressing iMG. E Enrichr-based GO analysis of top 100 upregulated hits using dbGaP database to identify phenotypes associated with LINE-1+ transcriptional signature. Data are presented as mean ± S.D. and analyzed using an unpaired two-tailed t test; *P ≤ 0.05; **P ≤ 0.01, ***P ≤ 0.001, ****P P ≤ 0.0001, ns not significant. Scale bar represents 50µM. FC fold change

References

    1. Akiyama H, Barger S, Barnum S, Bradt B, Bauer J, Cole GM et al (2000) Inflammation and Alzheimer’s disease. Neurobiol Aging 21:383–421. 10.1016/S0197-4580(00)00124-X - PMC - PubMed
    1. del Alejandra C, Alonso IG-I& KI (1996) Alzheimer’s disease hyperphosphorylated tau sequesters normal tau into tangles of filaments and disassembles microtubules. Nat Med 2:783–787 - PubMed
    1. Andreone BJ, Przybyla L, Llapashtica C, Rana A, Davis SS, van Lengerich B et al (2020) Alzheimer’s-associated PLCγ2 is a signaling node required for both TREM2 function and the inflammatory response in human microglia. Nat Neurosci 23:927–938. 10.1038/s41593-020-0650-6 - PubMed
    1. Bachiller S, del Pozo-Martín Y, Carrión ÁM (2017) L1 retrotransposition alters the hippocampal genomic landscape enabling memory formation. Brain Behav Immun 64:65–70. 10.1016/J.BBI.2016.12.018 - PubMed
    1. Baillie JK, Barnett MW, Upton KR, Gerhardt DJ, Richmond TA, De Sapio F et al (2011) Somatic retrotransposition alters the genetic landscape of the human brain. Nature 479:534. 10.1038/NATURE10531 - PMC - PubMed

Publication types

Substances