. 2024 Dec;4(12):1760-1771.
doi: 10.1038/s43587-024-00744-7. Epub 2024 Nov 27.

Late-life protein or isoleucine restriction impacts physiological and molecular signatures of aging

Affiliations

Late-life protein or isoleucine restriction impacts physiological and molecular signatures of aging

Chung-Yang Yeh et al. Nat Aging. 2024 Dec.

Abstract

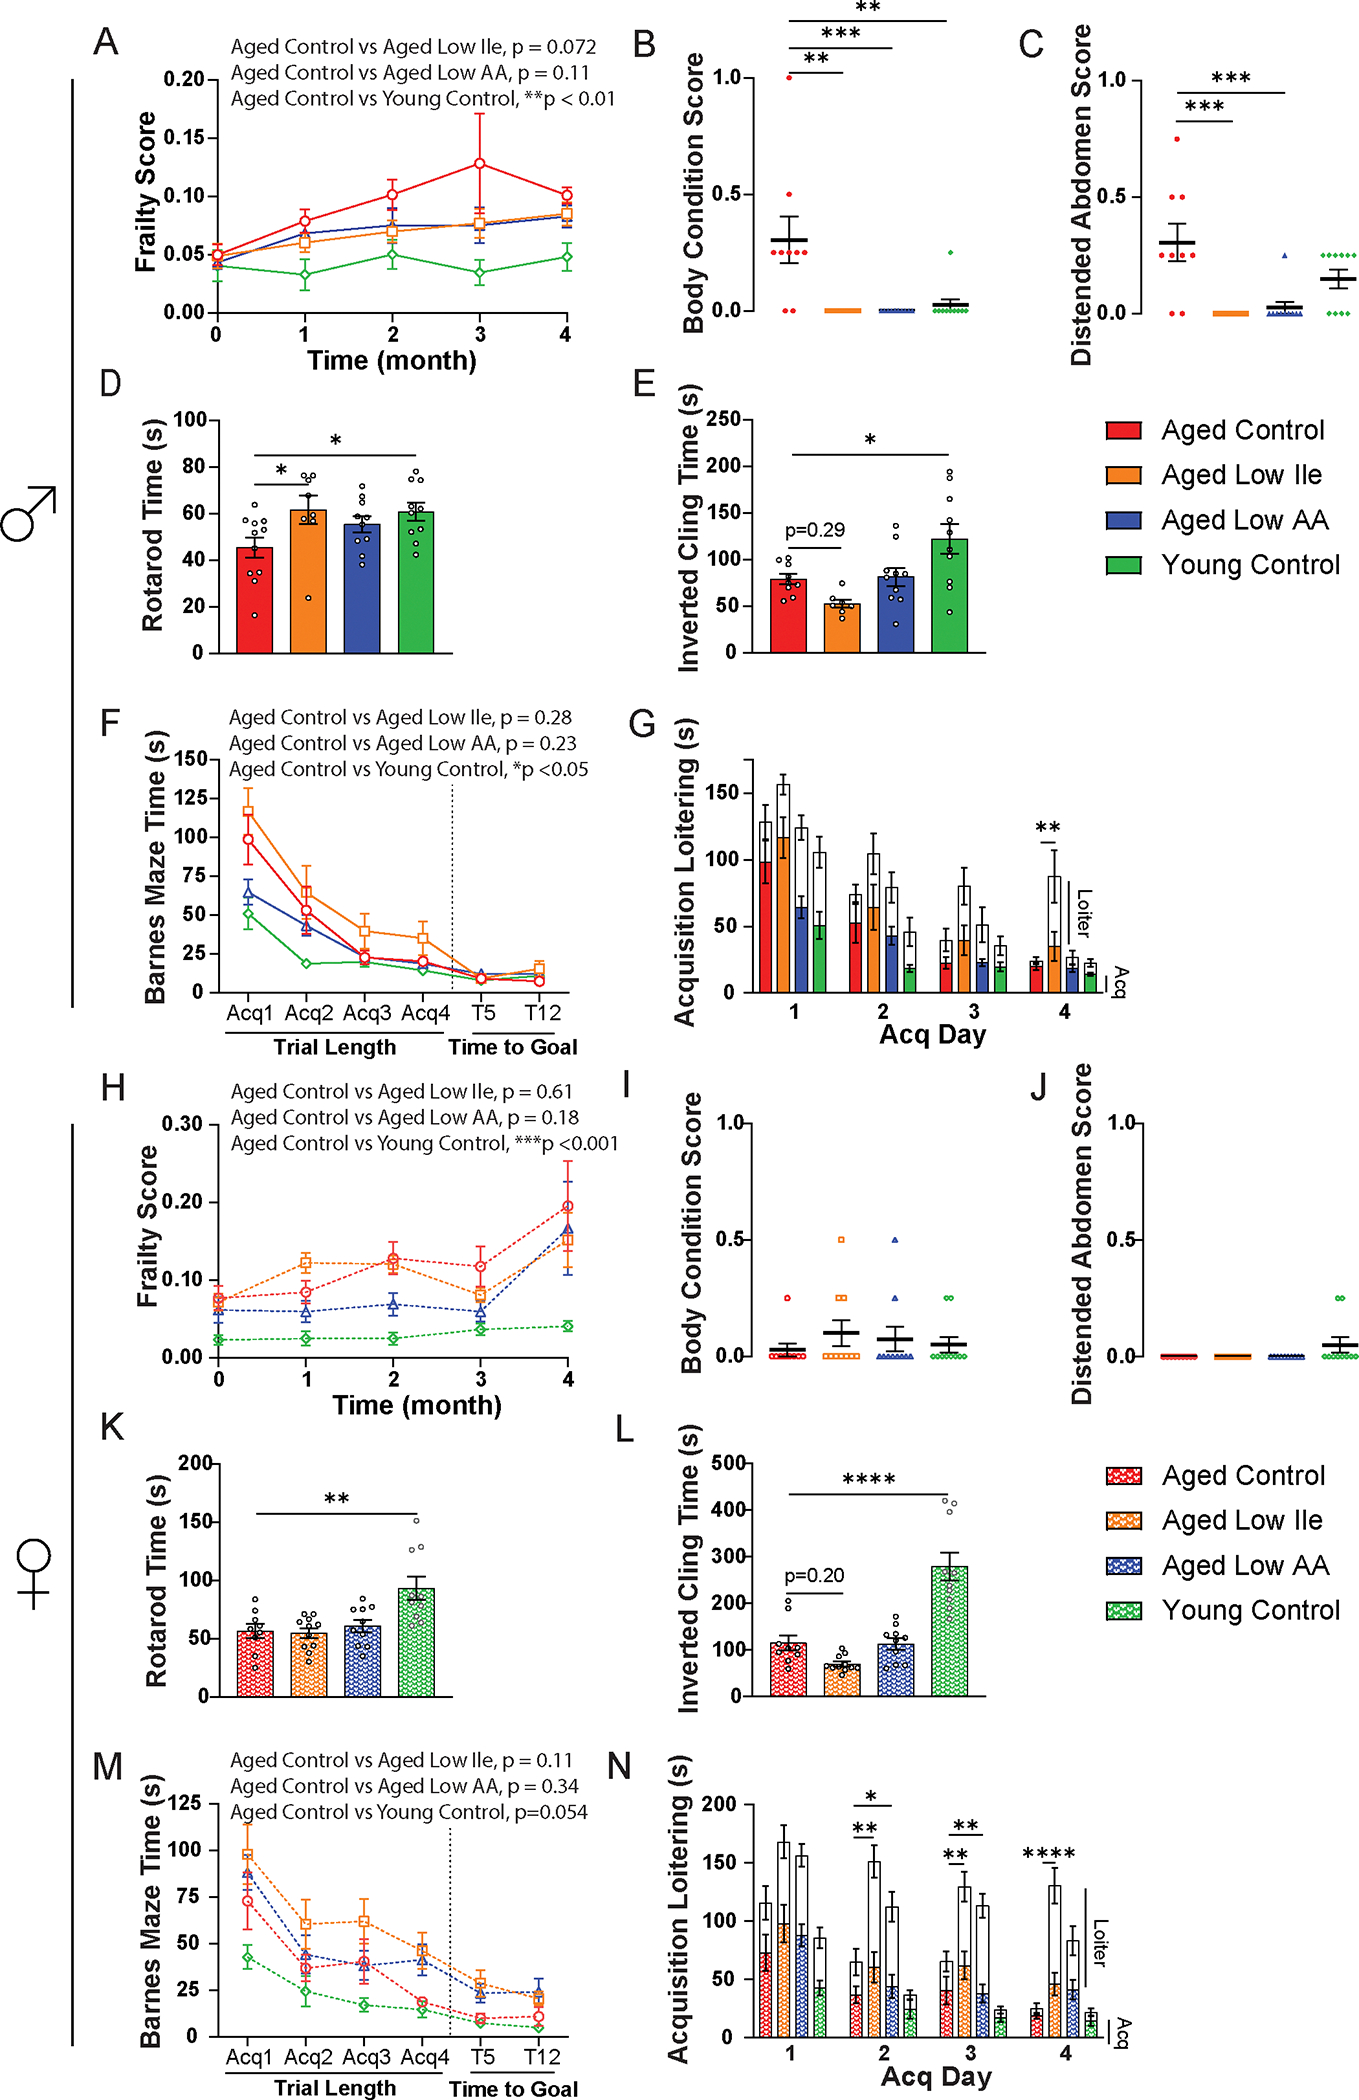
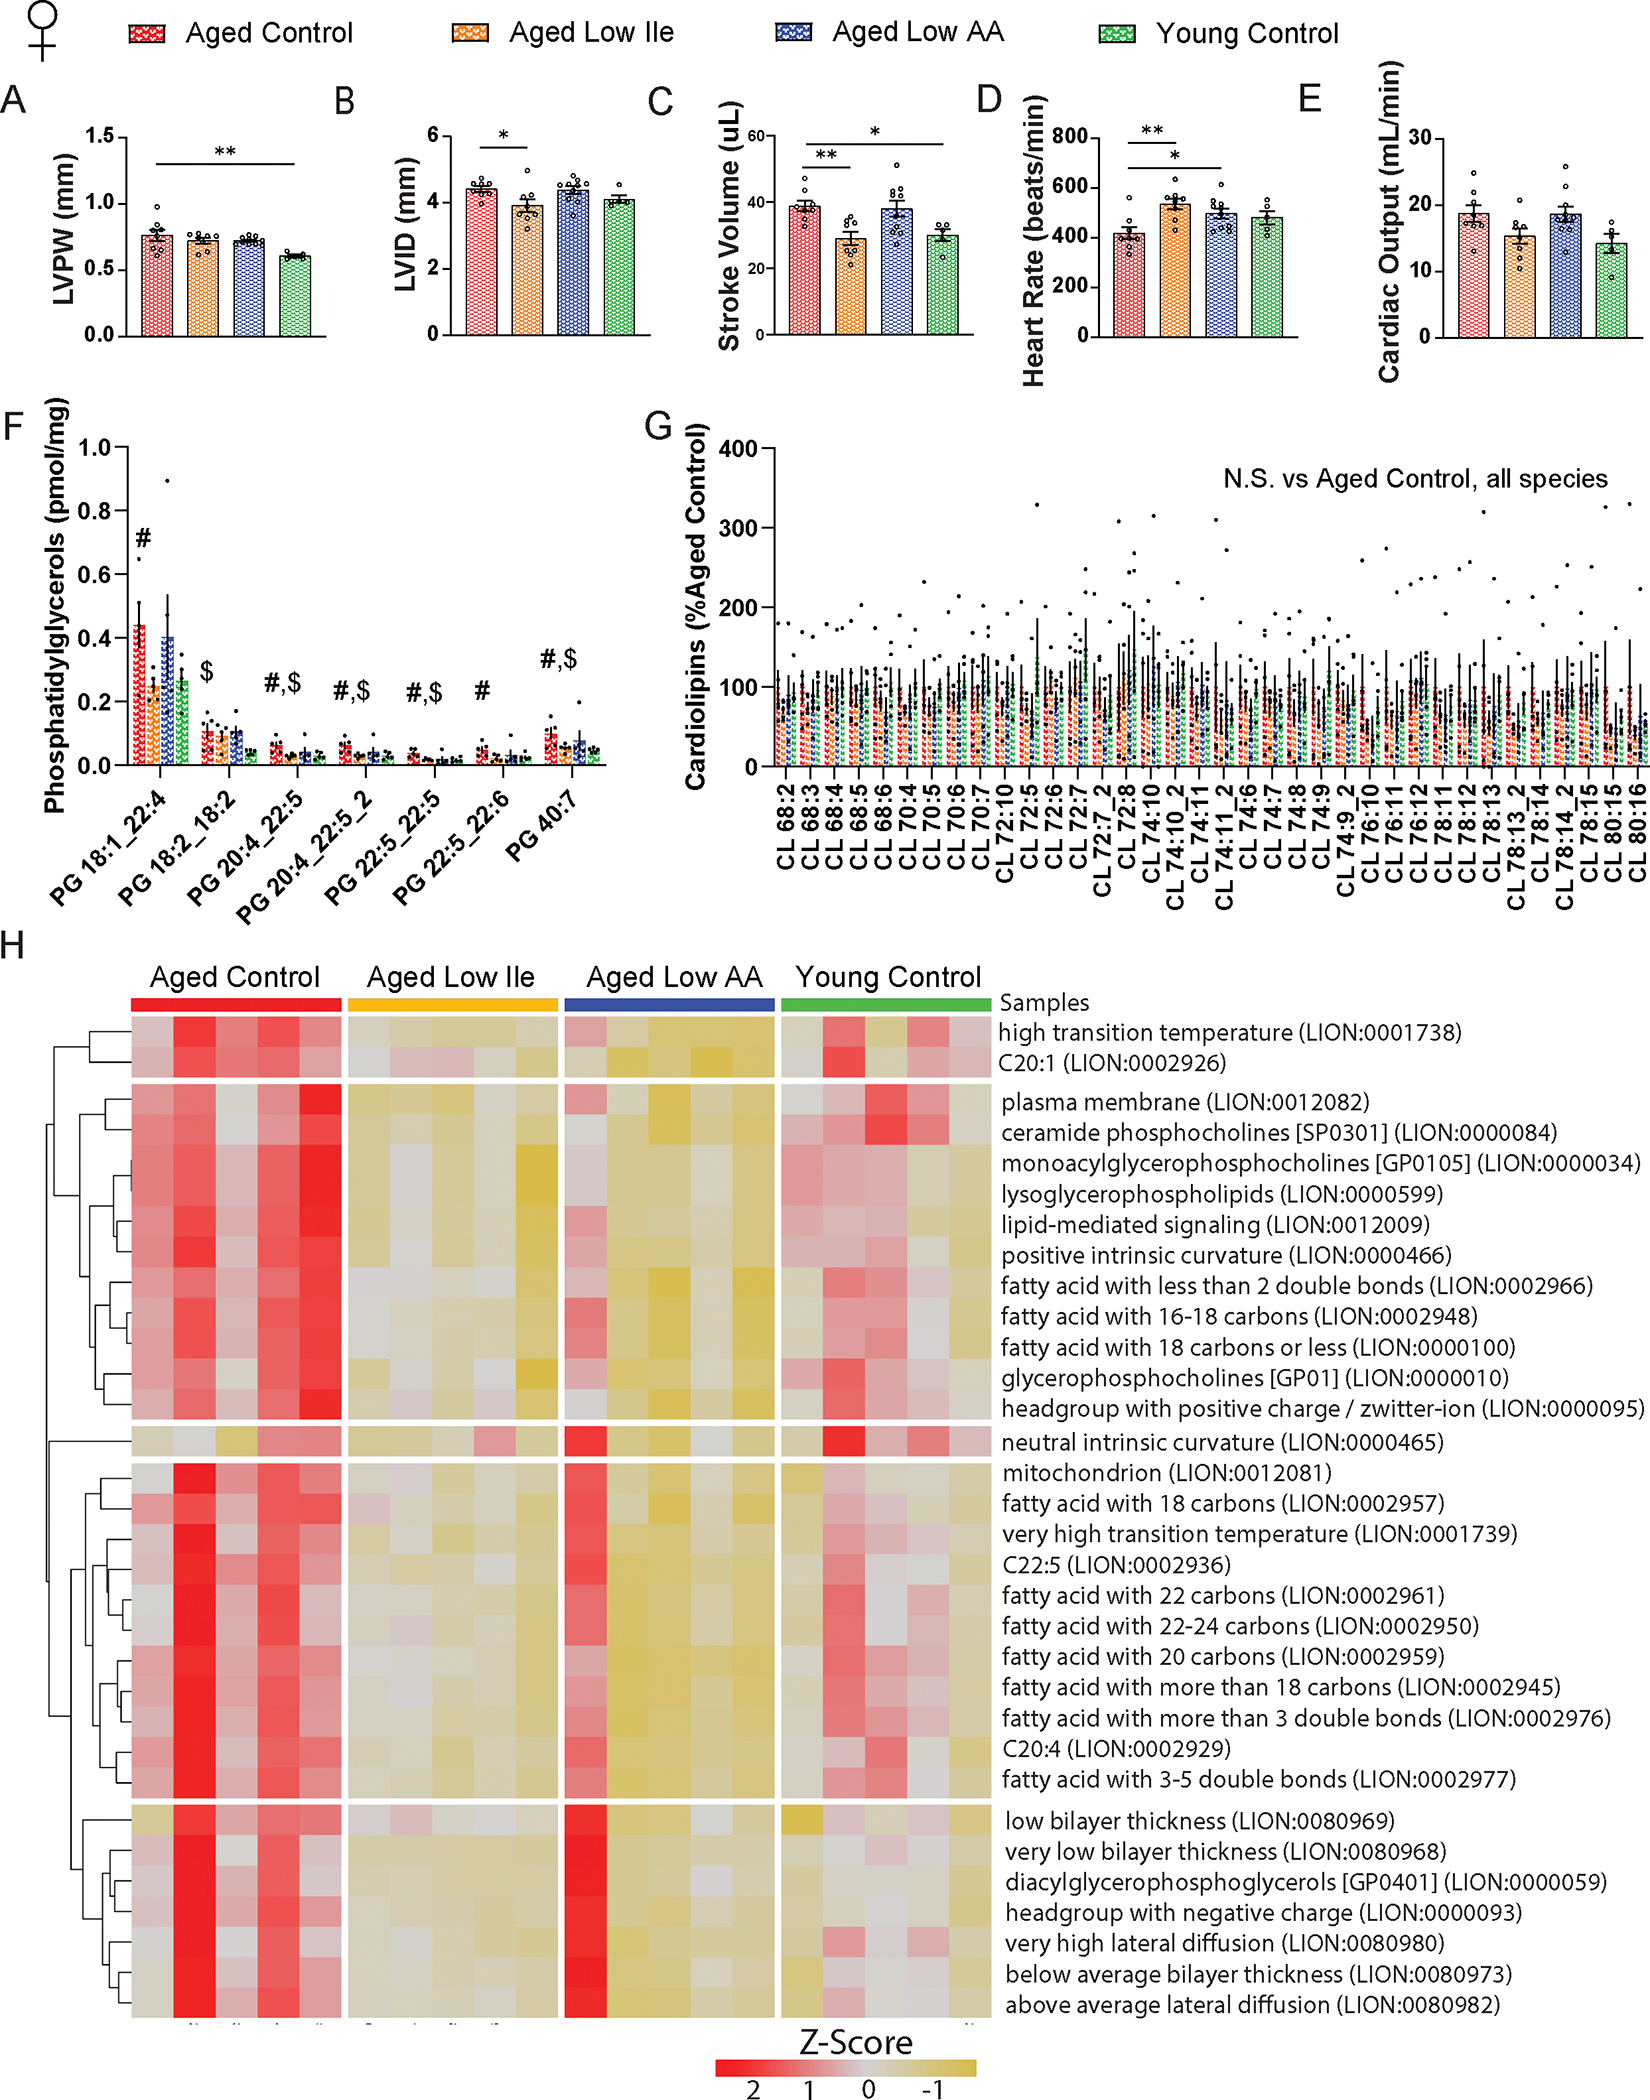
Restricting the intake of protein or the branched-chain amino acid isoleucine promotes healthspan and extends lifespan in young or adult mice. However, their effects when initiated in aged animals are unknown. Here we investigate the consequences of consuming a diet with 67% reduction of all amino acids (low AA) or of isoleucine alone (low Ile), in male and female C57BL/6J.Nia mice starting at 20 months of age. Both dietary regimens effectively promote overall metabolic health without reducing calorie intake. Both low AA and low Ile diets improve aspects of frailty and slow multiple molecular indicators of aging rate; however, the low Ile diet reduces grip strength in both sexes and has mixed, sexually dimorphic effects on the heart. These results demonstrate that low AA and low Ile diets can promote aspects of healthy aging in aged mice and suggest that similar interventions might promote healthy aging in older adults.


Conflict of interest statement

Competing interests: D.W.L. has received funding from, and is a scientific advisory board member of, Aeovian Pharmaceuticals, which seeks to develop novel, selective mTOR inhibitors for the treatment of various diseases. The other authors declare no competing interests.

Figures

Extended Data Fig. 1
Extended Data Fig. 1. The effect of late-life feeding of a Low Ile or a Low AA diet on fat and lean mass, food consumption, fasting blood glucose, insulin tolerance, and glucose tolerance at 25 months of age.
(A-B) Changes in (A) fat and (B) lean mass in males over time. (A-B) n varies over time, maximum n=10, 11, 10, and 10. (C) Food consumption of male mice throughout the experiment; n varies over time, maximum n=5, 5, 6, and 6 cages. (D) Fasting blood glucose of 21-month-old male after 3 weeks on the indicated diets; n=12, 13, 12, and 10. (E) Insulin tolerance test of 21-month-old male after 4 weeks on the indicated diets; n=9, 9, 11, and 10. (F) Glucose tolerance test in a separate group of 25 months old mice; n=6, 7, 6, and 5. (G-H) Changes in (G) fat and (H) lean mass in females over time. (G-H) maximum n=10, 11, 10, and 10. (I) Food consumption of female mice throughout the experiment. (I) n varies over time, maximum n=4 cages/group. (J) Fasting blood glucose of 21-month-old female mice after 3 weeks on the indicated diets; n=10, 11, 10, and 10. (K) Insulin tolerance test; n=10, 11, 10, and 10. (L) Glucose tolerance test in a separate group of 25 months old mice.; n=9, 8, 10, and 5. n-value indicate biologically independent animals (or cages if indicated). ANOVA followed by two-sided Dunnett’s test vs. Aged Control-fed mice. *p<0.05, **p<0.01, ***p<0.001, ****p<0.0001. N-values denote biologically independent animals unless otherwise specified and are listed in the order of Aged Control, Aged Low Ile, Aged Low AA, and Young Control. Data presented as mean ± SEM. The exact p-values are provided in Source data.
Extended Data Fig. 2
Extended Data Fig. 2. Effects of late-life Low AA and Low Ile diets on energy balance.
(A-B) ANCOVA of energy expenditure with lean mass as a covariate in (C) male and (D) female mice. (C-D) Spontaneous activity of (E) male and (F) female mice during the metabolic chambers experiments. Shaded period indicates dark phase. (E-F) Metabolic chambers were used to determine the respiratory exchange ratio of (A) male and (B) female mice. Shaded period indicates dark phase. (A-F) Male n=8, 7, 10, and 10; Female n=9, 10, 10, and 10. N-values denote biologically independent animals unless otherwise specified and are listed in the order of Aged Control, Aged Low Ile, Aged Low AA, and Young Control. *p<0.05, ANOVA followed by two-sided Dunnett’s test; ANOVA conducted separately for the light and dark cycles. Data represented as mean ± SEM. The exact p-values are provided in Source data.
Extended Data Fig. 3
Extended Data Fig. 3. Western blotting of aging markers in the gastrocnemius muscle.
(A-B) Quantification of (A) total and (B) phosphorylated S6 in male muscle. (C-D) Quantification of (C) total and (D) phosphorylated AKT in male muscle. (E-F) Quantification of (E) total and (F) phosphorylated S6 in female muscle. (G-H) Quantification of (G) total and (H) phosphorylated AKT in female muscle. (I-J) Representative Western blots for (K) male and (J) female mice muscles. For all groups, n=6. n-value indicates biologically independent animals. *p<0.05, **p<0.01, ***p<0.001 vs. Aged Control mice, ANOVA followed by two-sided Dunnett’s test. Data presented as mean ± SEM. The exact p-values are provided in Source data.
Extended Data Fig. 4
Extended Data Fig. 4. Volcano plots of hepatic DEGs after Low Ile feeding in aged mice.
(A-B) Volcano plots of differentially expressed genes in the liver of (blue) male and (red) female mice with (A) age and (B) diet. DEGs were identified using an empirical Bayes moderated linear model, and log coefficients and Benjamini-Hochberg (BH) adjusted p-values were generated for each comparison of interest (α = 0.10).
Extended Data Fig. 5
Extended Data Fig. 5. Venn diagram and enrichment analysis of differentially expressed hepatic genes.
(A) Venn diagram showing the number of overlapping and non-overlapping (left) age-driven and (right) diet-driven DEGs between male and females. (B-C) Significantly enriched KEGG pathways by (B) age and (C) diet in male mice. (D-E) Significantly enriched GO terms by (D) age and (E) diet in male mice. (F-G) Significantly enriched KEGG pathways by (F) age and (G) diet in female mice. (H-I) Significantly enriched GO terms by (H) age and (I) diet in female mice.
Extended Data Fig. 6
Extended Data Fig. 6. Expression analysis of senescence markers in the aged male liver.
Expression of the indicated genes in the livers of 20-month-old mice on the indicated diets for 4 months was determined by qPCR. n=6 biologically independent animals (P21 Aged Control, Il-6 Aged Control, Il-6 Aged Low Ile), 8 biologically independent animals (P21 Aged Low AA, P16 Aged Low AA, Il1-b Aged Low AA, Mcp-1 Aged Low AA, Il-10 Aged Low AA), 5 biologically independent animals (Il-6 Aged Low AA), and 7 biologically independent animals for all other groups and genes, *p<0.05, 2-way mixed-effects analysis (REML) followed by two-sided Dunnett’s test vs. Aged Control. Data presented as mean ± SEM. The exact p-values are provided in Source data.
Extended Data Fig. 7
Extended Data Fig. 7. H&E and F4/80 staining of the mice liver.
(A) Representative hematoxylin and eosin (H&E) staining of the mouse liver. Black arrows mark extramedullary hematopoiesis, indicative of lobular inflammation. (B-I) Quantification of (B-E) male and (F-I) female H&E staining in Nonalcoholic Fatty Liver Disease Activity Score (NAS) score and its component scores: steatosis, lobular inflammation, and hepatocyte ballooning. (J) Positive and negative control (without antibody) staining of the mouse liver with the F4/80 antibody. (K) Representative F4/80 staining of the mouse liver. Black arrows mark loci of extramedullary hematopoiesis, indicative of lobular inflammation, similar to the H&E staining. (L-M) Quantification of (L) male and (M) female F4/80 staining mean intensity. For all groups n=4. *p<0.05, **p<0.01, ANOVA followed by two-sided Dunnett’s test vs. Aged Control. Data presented as mean ± SEM. A blinded evaluator scored the sections three times and the average score for each animal was taken for statistical analysis. The exact p-values are provided in Source data.
Extended Data Fig. 8
Extended Data Fig. 8. Oil Red O and Sirius Red staining of the mice liver.
(A) Representative oil red O (ORO) staining of the mouse liver. (B-E) Quantification of (B-C) male and (D-E) female ORO staining in % area and mean intensity. (F) Representative polarized light microscopy of the Sirius Red (SR) staining birefringence in the mouse liver. White arrow highlights bridging, an indication of advanced liver fibrosis. (G-H) Quantification of male (G) and female (H) liver fibrosis score. For all groups n=4. ANOVA followed by two-sided Dunnett’s test vs. Aged Control. *p<0.05. Data presented as mean ± SEM. A blinded evaluator scored the sections three times and the average score for each animal was taken for statistical analysis. The exact p-values are provided in Source data.
Figure 1.
Figure 1.. Low Ile and Low AA diets promote leanness and metabolic health in aged mice.
(A) Experimental scheme. Three different amino acid defined diets were utilized: Control, Low Ile, and Low AA. Aged mice began their respective diets at 20 months of age, while young mice were fed the Control diet starting at 6 months of age. GTT: Glucose Tolerance Test; ITT: Insulin Tolerance Test. (B-D) Male (B) body weight over time, (C) final changes in body weight, fat mass and lean mass, and (D) body composition, n-value varies over time, maximum n=12, 13, 12, and 10. (E) Plasma FGF21, n=7, 6, 7, and 6. (F) GTT in male mice fed the indicated diets, n=12, 13, 12, and 10. (G) Metabolic chambers were used to determine the energy expenditure of male mice,n=8, 7, 10, and 10. Shaded period indicates dark phase. (H-J) Female (H) body weight over time, (I) final changes in body weight, lean mass, and fat mass, and (J) body composition, n-value varies over time, maximum n=10, 11, 10, and 10. (K) Plasma FGF21, n=5, 6, 5, and 6. (L) GTT, n=10, 11, 10, and 10. (M) Energy expenditure of female mice, n=9, 10, 10, and 10. Shaded period indicates dark phase. N-values denote biologically independent animals and are listed in the order of Aged Control, Aged Low Ile, Aged Low AA, and Young Control. All comparisons in this figure: *p<0.05, **p<0.01, ***p<0.001, ****p<0.0001, ANOVA followed by two-sided Dunnett’s test vs. Aged Control-fed mice. Data presented as mean ± SEM. The exact p-values are provided in Source data.
Figure 2.
Figure 2.. Late-life feeding of Low Ile and Low AA diets promotes aspects of healthspan.
(A) Frailty score of male mice was tracked between 20 and 24 months of age (n-value varies over time, maximum n=12, 13, 12, and 10). (B-C) Male (B) body condition and (C) distended abdomen frailty score, presented as the average of scores during the 3rd and 4th month of the experiment; n=9, 7, 10, and 10. (D-E) Male (D) rotarod and (E) inverted cling performance were assessed between 22–23 months of age; n=11, 8, 10, and 10. (F) Male Barnes Maze Test performance at 24 months of age. (G) Barnes Maze Test acquisition trial duration with loitering. (F-G) n=8, 7, 10, and 10. (H) Frailty score of female mice was tracked between 20 and 24 months of age (n-value varies over time, maximum n=10, 11, 10, and 10). (I-J) Female (I) body condition and (J) distended abdomen frailty score, presented as the average of scores during the 3rd and 4th month of the experiment; n=9, 10, 10, and 10. (K-L) Female (K) rotarod and (L) inverted cling performance were assessed between 22–23 months of age; n=9, 11, 10, and 10. (M) Female Barnes Maze Test performance at 24 months of age. (N) Barnes Maze Test acquisition trial duration with loitering. (M-N) n=8, 9, 9, and 10. (A, H) Pair-wise 2-way mixed-effects analysis (REML) or (F, M) 2-way RM ANOVA vs. Aged Control-fed mice, p-value represents the main effect of diet. (B-E, I-L) ANOVA followed by two-sided Dunnett’s test vs. Aged Control-fed mice. (G, N) Test on loitering time only, ANOVA followed by two-sided Dunnett’s test vs. Aged Control-fed mice. N-values denote biologically independent animals and are listed in the order of Aged Control, Aged Low Ile, Aged Low AA, and Young Control. *p<0.05, **p<0.01, ***p<0.001, ****p<0.0001. Data presented as mean ± SEM. The exact p-values are provided in Source data.
Figure 3.
Figure 3.. Low Ile and Low AA diet ameliorates multiple molecular indicators of aging rate in the liver.
(A-D) Diet and age alters aging rate indicators related to (A) mTOR signaling, (B) MAPK ERK signaling, (C) cap-independent translation (CIT), and (D) lipid oxidation in the liver of male mice. (E-H) Diet and age alters aging rate indicators related to (E) mTOR signaling, (F) MAPK ERK signaling, (G) cap-independent translation (CIT), and (H) lipid oxidation in the liver of female mice. (I) Representative Western blots of the proteins analyzed. (A-I) n=6 biologically independent animals/group, ANOVA followed by two-sided Dunnet’s test. *p<0.05, **p<0.01, ***p<0.001, ****p<0.0001. Data presented as mean ± SEM. The exact p-values are provided in Source data. (J) A summary of the effect of Low Ile on the age-driven differentially expressed gene sets in males (left) and females (right). Inner ring represents the genes up or downregulated by aging, while the outer ring represents the effect of a Low Ile diet on the DEGs altered with aging. n=5 (Female Aged Low Ile), 6 (all other groups) biologically independent animals. (K) MAGIC transcription factor enrichment analysis, top 20 results from each rejuvenation category. DEGs were identified using an empirical Bayes moderated linear model, and log coefficients and Benjamini-Hochberg (BH) adjusted p values were generated for each comparison of interest (α = 0.10).
Figure 4.
Figure 4.. Low Ile diet promotes youthful functional and molecular aspects of the female mice heart.
(A-E) Echocardiogram evaluation of female mice at 25 months of age. (A) Left ventricle posterior wall diameter, (B) left ventricle inner diameter, (C) stroke volume, (D) heart rate, and (E) cardiac output. n=6, 7, 5, and 5, *p<0.05, **p<0.01, ANOVA followed by two-sided Dunnett’s test. (F-G) Statistically significant (F) phosphatidylglycerols (PG) and all (G) cardiolipins (CL) in female mice hearts at 24 months of age after 4 months of dietary intervention. n=8, 8, 10, and 5, #p<0.05 Aged Control vs. Aged Low Ile, $p<0.05 Aged Control vs. Young Control, two-tailed t-test. (H) LION lipid ontology analysis of significantly altered lipid species in the female mice heart. N-values denote biologically independent animals and are listed in the order of Aged Control, Aged Low Ile, Aged Low AA, and Young Control. Data presented as mean ± SEM. The exact p-values are provided in Source data.

Update of

Similar articles

Cited by

References

    1. Mihaylova MM et al. When a calorie is not just a calorie: Diet quality and timing as mediators of metabolism and healthy aging. Cell Metab 35, 1114–1131 (2023). 10.1016/j.cmet.2023.06.008 - DOI - PMC - PubMed
    1. Levine ME et al. Low protein intake is associated with a major reduction in IGF-1, cancer, and overall mortality in the 65 and younger but not older population. Cell Metab 19, 407–417 (2014). 10.1016/j.cmet.2014.02.006 - DOI - PMC - PubMed
    1. Sluijs I et al. Dietary intake of total, animal, and vegetable protein and risk of type 2 diabetes in the European Prospective Investigation into Cancer and Nutrition (EPIC)-NL study. Diabetes Care 33, 43–48 (2010). 10.2337/dc09-1321 - DOI - PMC - PubMed
    1. Fontana L et al. Decreased Consumption of Branched-Chain Amino Acids Improves Metabolic Health. Cell reports 16, 520–530 (2016). 10.1016/j.celrep.2016.05.092 - DOI - PMC - PubMed
    1. Ferraz-Bannitz R et al. Dietary Protein Restriction Improves Metabolic Dysfunction in Patients with Metabolic Syndrome in a Randomized, Controlled Trial. Nutrients 14 (2022). 10.3390/nu14132670 - DOI - PMC - PubMed

Grants and funding