Meta-Analysis
. 2024 Dec;636(8043):719-727.
doi: 10.1038/s41586-024-08260-9. Epub 2024 Nov 27.

Study design features increase replicability in brain-wide association studies

Collaborators, Affiliations
Meta-Analysis

Study design features increase replicability in brain-wide association studies

Kaidi Kang et al. Nature. 2024 Dec.

Abstract

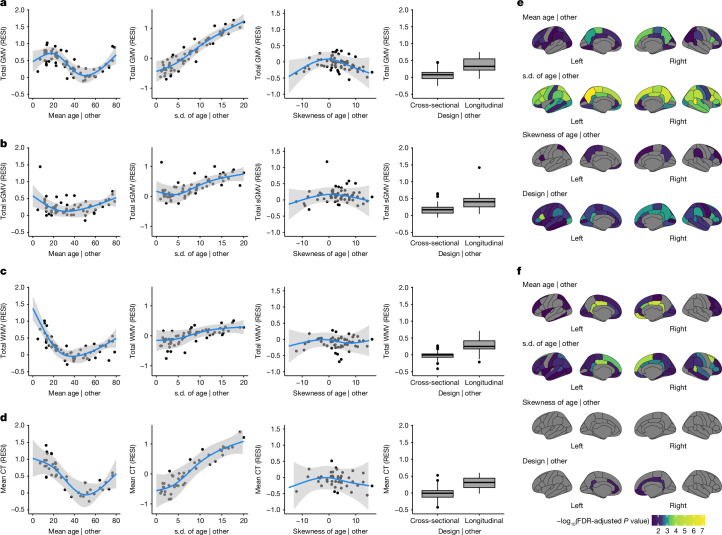
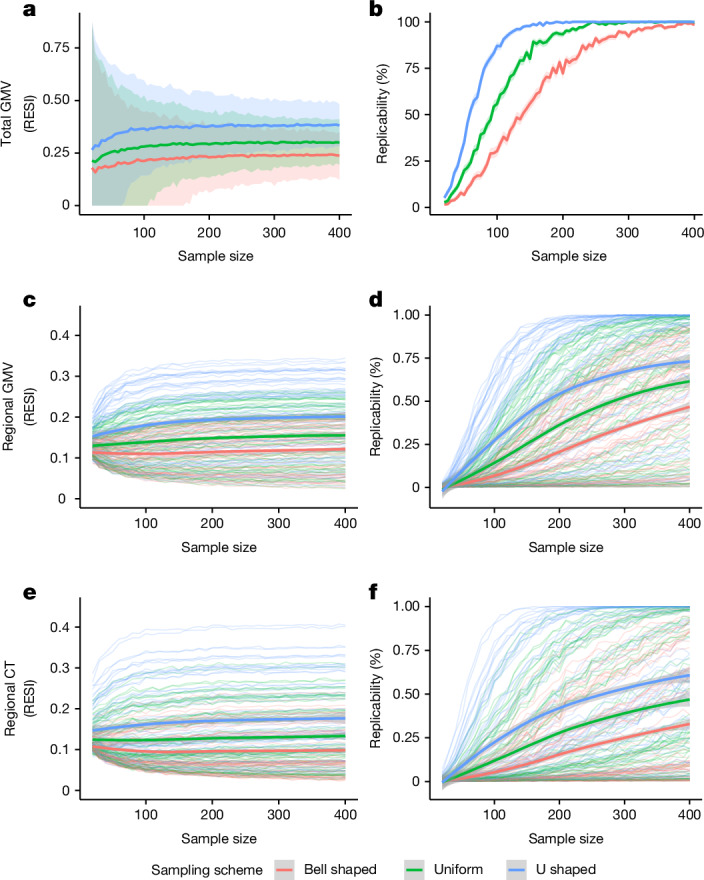
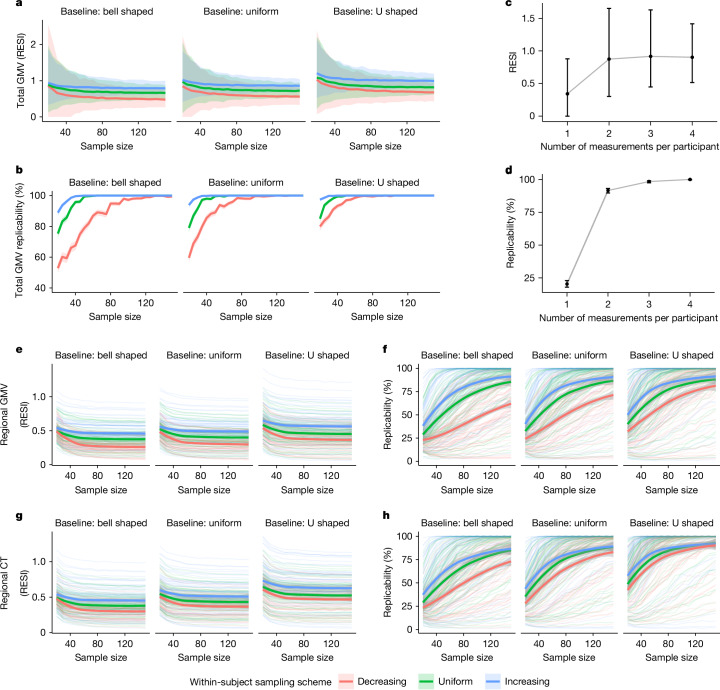
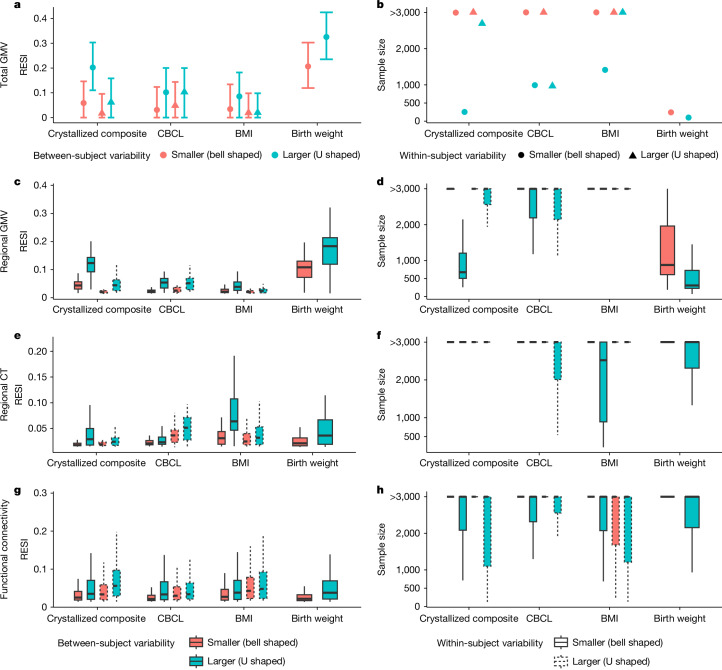
Brain-wide association studies (BWAS) are a fundamental tool in discovering brain-behaviour associations1,2. Several recent studies have shown that thousands of study participants are required for good replicability of BWAS1-3. Here we performed analyses and meta-analyses of a robust effect size index using 63 longitudinal and cross-sectional MRI studies from the Lifespan Brain Chart Consortium4 (77,695 total scans) to demonstrate that optimizing study design is critical for increasing standardized effect sizes and replicability in BWAS. A meta-analysis of brain volume associations with age indicates that BWAS with larger variability of the covariate and longitudinal studies have larger reported standardized effect size. Analysing age effects on global and regional brain measures from the UK Biobank and the Alzheimer's Disease Neuroimaging Initiative, we showed that modifying study design through sampling schemes improves standardized effect sizes and replicability. To ensure that our results are generalizable, we further evaluated the longitudinal sampling schemes on cognitive, psychopathology and demographic associations with structural and functional brain outcome measures in the Adolescent Brain and Cognitive Development dataset. We demonstrated that commonly used longitudinal models, which assume equal between-subject and within-subject changes can, counterintuitively, reduce standardized effect sizes and replicability. Explicitly modelling the between-subject and within-subject effects avoids conflating them and enables optimizing the standardized effect sizes for each separately. Together, these results provide guidance for study designs that improve the replicability of BWAS.


Conflict of interest statement

Competing interests: J.Seidlitz and R.A.I.B. are directors and hold equity in Centile Bioscience. A.A.-B. holds equity in Centile Bioscience and received consulting income from Octave Bioscience in 2023. S.M.N. consults for Turing Medical, which commercializes FIRMM. This interest has been reviewed and managed by the University of Minnesota in accordance with its conflict of interest policies. All other authors declare no competing interests.

Figures

Fig. 1
Fig. 1. Meta-analyses reveal study design features that are associated with larger standardized effect sizes of age on different brain measures.
ad, Partial regression plots of the meta-analyses of standardized effect sizes (RESI) for the association between age and global brain measures — total GMV (a), total sGMV (b), total WMV (c) and mean cortical thickness (CT) (d) — show that standardized effect sizes vary with respect to the mean and standard deviation (s.d.) of age in each study. Box plots show the median (horizontal line), interquartile range (grey box), min-max values (vertical lines), and outliers (points). ‘| other’ means after fixing the other features at constant levels: design was cross-sectional, mean age of 45 years, sample age s.d. = 7 and/or skewness of age = 0 (symmetric). The blue curves are the expected standardized effect sizes for age from the locally estimated scatterplot smoothing (LOESS) curves. The grey shading areas are the 95% confidence bands from the LOESS curves. e,f, The effects of study design features on the standardized effect sizes for the associations between age and regional brain measures (regional GMV (e) and regional cortical thickness (f)). Regions with Benjamini–Hochberg-adjusted P < 0.05 are shown in colour. FDR, false discovery rate.
Fig. 2
Fig. 2. Increased standardized effect sizes and replicability for age associations with different brain measures under three sampling schemes in the UKB study.
n = 29,031 for total GMV and n = 29,030 for regional GMV and cortical thickness. The sampling schemes target different age distributions to increase the variability of age: bell shaped < uniform < U shaped (Extended Data Fig. 1a). a,b, Using the sampling schemes, increasing age variability increases the standardized effect sizes (a) and replicability (b; at significance level of 0.05) for total GMV–age association. cf, The same result holds for regional GMV (c,d) and regional cortical thickness (e,f). The curves represent the average standardized effect size or estimated replicability at a given sample size and sampling scheme. The shaded areas represent the corresponding 95% confidence bands. The bold curves are the average standardized effect size or replicability across all regions with significant uncorrected effects using the full UKB data (cf).
Fig. 3
Fig. 3. Increased standardized effect sizes and replicability for age associations with structural brain measures under different longitudinal sampling schemes in the ADNI data.
Three different sampling schemes (Extended Data Fig. 1b,c) are implemented in bootstrap analyses to modify the between-subject and within-subject variability of age, respectively. a,b, Implementing the sampling schemes results in higher (between-subject and/or within-subject) variability and increases the standardized effect size (a) and replicability (b; at significance level of 0.05) for the total GMV–age association. The curves represent the average standardized effect size or estimated replicability, and the shaded areas are the 95% confidence bands across the 1,000 bootstraps. c,d, Increasing the number of measurements from one to two per participant provides the most benefit on standardized effect size (c) and replicability (d) for the total GMV–age association when using uniform between-subject and within-subject sampling schemes and n = 30. The points represent the mean standardized effect sizes or estimated replicability, and the whiskers are the 95% confidence intervals. eh, Increased standardized effect sizes (e,g) and replicability (f,h) for the associations of age with regional GMV (e,f) and regional cortical thickness (g,h) across all brain regions under different sampling schemes. The bold curves are the average standardized effect size or estimated replicability across all regions with significant uncorrected effects using the full ADNI data. The shaded areas are the corresponding 95% confidence bands. Increasing the between-subject and within-subject variability of age by implementing different sampling schemes can increase the standardized effect sizes of age, and the associated replicability, on regional GMV and regional cortical thickness.
Fig. 4
Fig. 4. Heterogeneous improvement of standardized effect sizes for select cognitive, mental health and demographic associations with structural and functional brain measures in the ABCD study with bootstrapped samples of n = 500.
a,b, U-shaped between-subject sampling scheme (blue) that increases between-subject variability of the non-brain covariate produces larger standardized effect sizes (a) and reduces the number of participants scanned to obtain 80% replicability (b) in total GMV. The points and triangles are the average standardized effect sizes across bootstraps, and the whiskers are the 95% confidence intervals. Increasing within-subject sampling (triangles) can reduce standardized effect sizes. cf, A similar pattern holds in regional GMV (c,d) and regional cortical thickness (e,f) as in panels a,b. The boxplots show the distributions of the standardized effect sizes across regions (or region pairs for functional connectivity). Box plots are as in Fig. 1. g,h, By contrast, regional pairwise functional connectivity standardized effect sizes improve by increasing between-subject (blue) and within-subject (dashed borders) variability (g) with a corresponding reduction in the number of participants scanned for 80% replicability (h). See Extended Data Fig. 2 for the results for all non-brain covariates examined.
Fig. 5
Fig. 5. Longitudinal study designs can reduce standardized effect sizes and replicability due to differences in between-subject versus within-subject associations of brain and behavioural measures.
Plots show the distribution of the standardized effect sizes. ac, Cross-sectional analyses (using only the baseline measures; indicated by ‘1st’ on the x axes) can have larger standardized effect sizes than the same longitudinal analyses (using the full longitudinal data; indicated by ‘all’ on the x axes) for total GMV (a), regional GMV (b) and regional cortical thickness (c) in the ABCD dataset. Data in a are estimates (points) with 95% confidence intervals (whiskers). Box plots in bd are as in Fig. 1. d, Functional connectivity measures do not show such a reduction of standardized effect sizes in longitudinal modelling. See Extended Data Fig. 4 for the results for all non-brain covariates examined. e,f, Most regional GMV associations (e) have larger between-subject parameter estimates (βb; x axis) than within-subject parameter estimates (βw; y axis; see equation (13) in Supplementary Information), whereas functional connectivity associations (f) show less heterogeneous relationships between the two parameters.
Extended Data Fig. 1
The illustration of implemented sampling schemes and the region-specific improvement in the standardized effect sizes and replicability for the age associations in UKB. (a) The sampling scheme implemented in UKB. The sampling schemes adjust the variability of age in the samples by assigning heavier or lighter weights to the participants with age at the two tails of the population. The U-shaped scheme produces the largest variability of age in the samples, followed by uniform and bell-shaped sampling schemes. (b-c) Between- and within-subject sampling schemes implemented in ADNI. (b) The between-subject variability of age is adjusted by assigning heavier or lighter weights to the participants with baseline age closer to the two tails of the population baseline age distribution. (c) The within-subject variability in age is adjusted by increasing or decreasing the probability of selecting the follow-up observation(s) with a larger change in age since baseline. (d-e) Region-specific improvement in the RESI and replicability in UKB for the association between age and (d) regional gray matter volume (GMV) and (e) regional cortical thickness (CT), respectively, by using U-shaped sampling scheme compared with bell-shaped sampling scheme, when N = 300.
Extended Data Fig. 2
Extended Data Fig. 2. Heterogeneous improvement of standardized effect sizes (ESs) for cognitive, mental health, and demographic associations with structural and functional brain measures in the ABCD study with bootstrapped samples of N = 500.
(a) U-shaped between-subject sampling scheme (blue) that increases between-subject variability of the non-brain covariate produces larger standardized ESs and (b) reduces the number of participants scanned to obtain 80% replicability in total gray matter volume (GMV). The points and triangles are the average standardized ESs across bootstraps and the whiskers are the 95% confidence intervals. Increasing within-subject sampling (triangles) can reduce standardized ESs. A similar pattern holds in (c-d) regional GMV and (e-f) regional cortical thickness (CT); boxplots show the distributions of the standardized ESs across regions. In contrast, (g) regional pairwise functional connectivity (FC) standardized ESs are improved by increasing between- (blue) and within-subject variability (dashed borders) with a corresponding reduction in the (h) number of participants scanned for 80% replicability. c-h, Boxplots show the median (horizontal line), interquartile range (grey box), and min-max values (vertical lines).
Extended Data Fig. 3
Extended Data Fig. 3. Boxplots showing the distributions of (log2 of) reduction factors of the sample size N needed for 80% replicability by increasing between-subject variability of the covariates across all the associations with each of the outcomes in ABCD (Fig. 4 and Extended Data Fig. 2).
The reduction factors are derived by comparing the sample sizes needed for 80% replicability with U-shaped to the one with bell-shaped between-subject sampling scheme when the within-subject sampling scheme is bell-shaped (Extended Data Fig. 1b). GMV, gray matter volume; CT, cortical thickness; FC, functional connectivity. Boxplots show the median (horizontal line), interquartile range (grey box), min-max values (vertical lines), and outliers (points).
Extended Data Fig. 4
Extended Data Fig. 4. Longitudinal study designs can reduce standardized effect sizes (ESs) and replicability.
Boxplots show the distributions of the standardized ESs across regions. The cross-sectional analyses use only the baseline or the 2nd measures (indicated by “1st”s or “2nd”s on the x-axes, respectively). The longitudinal analyses use the full longitudinal data (indicated by “all”s on the x-axes). (a-c) Cross-sectional analyses can have larger standardized ESs than the same longitudinal analyses for structural brain measures in ABCD. (d) The functional connectivity (FC) measures have a slight benefit of longitudinal modeling. GMV, grey matter volume; CT, cortical thickness. b-d, Boxplots show the median (horizontal line), interquartile range (grey box), and min-max values (vertical lines).
Extended Data Fig. 5
Extended Data Fig. 5. The influence of sampling schemes on the standardized effect sizes (ESs) for between- and within-subject associations, respectively, of cognition, mental health, and demographic covariates with different brain measures in the ABCD study at N = 500.
Boxplots show the distribution of the standardized ESs across regions. Between-subject standardized ESs are predominantly affected by the between-subject variance, whereas within-subject standardized ESs are predominantly affected by the within-subject variance. Consistent results were found for structural brain measures total grey matter volume (GMV; a, b), regional GMV (c-d), regional cortical thickness (CT; e,f) and functional brain measures (g,h). The results for covariates birthweight and handedness, which do not vary within participants, are not included as the within-subject sampling schemes do not apply to them. c-h, Boxplots show the median (horizontal line), interquartile range (box), and min-max values (vertical lines).
Extended Data Fig. 6
Extended Data Fig. 6. The estimated standardized effect sizes (ESs) from cross-sectional and longitudinal analyses, respectively, for the between-subject associations for cognition, mental health, and demographic covariates with different brain measures in the ABCD study.
The estimated RESIs for cross-sectional analyses (that only use the baseline measures) are indicated by “1st”s on the x-axes; the estimated RESIs for the between-subject effects from longitudinal analyses (that use the full longitudinal data and a specification of separate between- and within-subject effects (see Methods: Estimation of the between-subject and within-subject effects) are indicated by “all”s on the x-axes. By separating the between- and within-subject effects in the longitudinal model, we can avoid averaging the different between- and within-subject effects and maintain the benefit of longitudinal designs on the estimated RESIs for the between-subject effects on both structural brain measures (a-c) and functional brain measures (d). The results for covariates birthweight and handedness are not included, as they do not vary within-subjects so only their between-subject effects can be estimated (which are shown in Extended Data Fig. 4). b-d, Boxplots show the median (horizontal line), interquartile range (gray box), and min-max values (vertical lines).
Extended Data Fig. 7
Extended Data Fig. 7. Decision tree for modified sampling strategy for a single primary covariate.
Random/representative sampling is needed to unbiasedly estimate the variance of the covariate distribution in the population in order to obtain standardized effect size (ES) estimates consistent with the population. (a) A two-phase design is needed to modify the covariate distribution(s) in the sample to increase standardized ESs and replicability, where random sampling is performed first in a larger dataset to collect covariate values and sampling based on collected covariates values is used to optimize the standardized ESs and replicability; unbiased population standardized ES estimates still can be obtained using weighted estimation (see Discussion: Optimal design considerations). (b) If the distribution(s) of the covariate(s) in the population is bell-shaped, a uniform covariate distribution in the sample can still increase the standardized ES and replicability in detecting the overall association. (c) The particular target distribution will depend on the difficulty of collecting participants in the tail of the distributions (see section 4.1 in Supplementary Information).
Extended Data Fig. 8
Extended Data Fig. 8. Optimal study design and analysis depends on characteristics of the hypothesized association(s).
(a) Visualization can be performed in pilot or study data to evaluate this assumption as in Supplementary Fig. 4 (section 5 in Supplementary Information). (b) If the between- and within-subject effects are hypothesized to be equal, either a cross-sectional or longitudinal design can be applied, but the efficiency per scan depends on the size of the within-subject error of the brain measure; pilot/study data can be used to evaluate this question (section 5.1 in Supplementary Information). (c) If estimating the between- and within-subject effects separately, a longitudinal design is required and common longitudinal data analysis tools such as generalized estimating equations (GEEs) and linear mixed models (LMMs) with separate between- and within-subject effects are required to unbiasedly estimate these effects (see section 5.2 in Supplementary Information). (d) If there are different between- and within-subject effects, the investigators may still use a model to target the average effect (i.e., a weighted average of the underlying between- and within-subject effects) if they have cross-sectional data, or if they want results from a longitudinal study that are consistent for the same biological effect as cross-sectional studies. For longitudinal studies, a GEE with independence working covariance structure targets the same average effect as the cross-sectional model, but it is less statistically efficient than the cross-sectional model (see section 5.3 in Supplementary Information). All recommendations are based on the empirical findings in the paper and the theory for exchangeable covariance longitudinal linear models in the Supplementary Information.

Update of

References

    1. Marek, S. et al. Reproducible brain-wide association studies require thousands of individuals. Nature603, 654–660 (2022). - PMC - PubMed
    1. Owens, M. M. et al. Recalibrating expectations about effect size: a multi-method survey of effect sizes in the ABCD study. PLoS ONE16, e0257535 (2021). - PMC - PubMed
    1. Spisak, T., Bingel, U. & Wager, T. D. Multivariate BWAS can be replicable with moderate sample sizes. Nature615, E4–E7 (2023). - PMC - PubMed
    1. Bethlehem, Ra. I. et al. Brain charts for the human lifespan. Nature604, 525–533 (2022). - PMC - PubMed
    1. Nosek, B. A. et al. Replicability, robustness, and reproducibility in psychological science. Annu. Rev. Psychol.73, 719–748 (2022). - PubMed

Publication types

LinkOut - more resources