. 2024 Dec;636(8043):762-768.
doi: 10.1038/s41586-024-08271-6. Epub 2024 Nov 27.

Stereochemistry in the disorder-order continuum of protein interactions

Affiliations

Stereochemistry in the disorder-order continuum of protein interactions

Estella A Newcombe et al. Nature. 2024 Dec.

Abstract

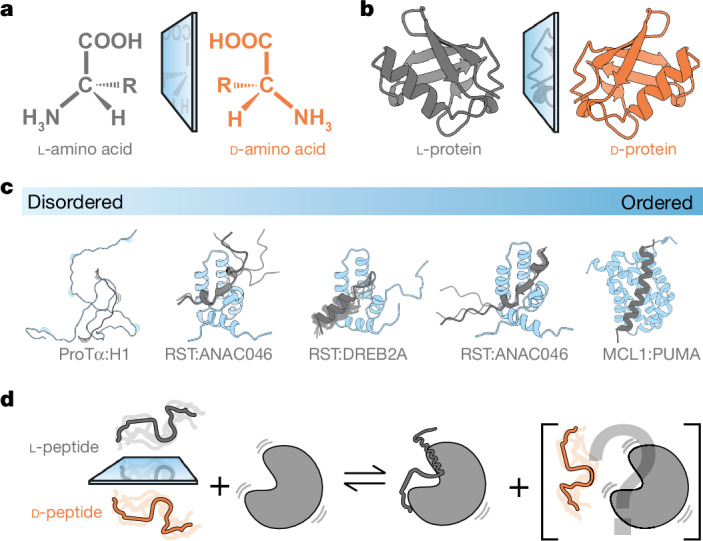
Intrinsically disordered proteins can bind via the formation of highly disordered protein complexes without the formation of three-dimensional structure1. Most naturally occurring proteins are levorotatory (L)-that is, made up only of L-amino acids-imprinting molecular structure and communication with stereochemistry2. By contrast, their mirror-image dextrorotatory (D)-amino acids are rare in nature. Whether disordered protein complexes are truly independent of chiral constraints is not clear. Here, to investigate the chiral constraints of disordered protein-protein interactions, we chose as representative examples a set of five interacting protein pairs covering the disorder-order continuum. By observing the natural ligands and their stereochemical mirror images in free and bound states, we found that chirality was inconsequential in a fully disordered complex. However, if the interaction relied on the ligand undergoing extensive coupled folding and binding, correct stereochemistry was essential. Between these extremes, binding could be observed for the D-ligand with a strength that correlated with disorder in the final complex. These findings have important implications for our understanding of the molecular processes that lead to complex formation, the use of D-peptides in drug discovery and the chemistry of protein evolution of the first living entities on Earth.


Conflict of interest statement

Competing interests: The authors declare no competing interests.

Figures

Fig. 1
Fig. 1. Chirality in protein–protein interactions.
a,b, l- and d-amino acids (a) and l- and d-proteins are mirror images of each other, illustrated in b by ubiquitin (Protein Data Bank (PDB): 4GSW). c, The five protein pairs constituting our model system covering a continuum of disordered (ProTα:H1), to ordered (MCL1:PUMA) protein complexes, and three intermediate interactions of RST with ANAC046, DREB2A and ANAC013. d, l-protein pairs will interact, but the features that might allow l-proteins and d-proteins to interact are unclear.
Fig. 2
Fig. 2. Effects of chirality on protein interactions.
a, ProTα and the H1155–175 peptide remain disordered during their interaction. b, Far-UV CD spectra of l-H1155–175 and d-H1155–175 peptides and their sum. MRE, mean residue ellipticity (cm2 dmol−1 residue−1; n = 1). c,d, CSP (c) and ΔCSPl-d (n = 1) (d) caused by the addition of l-H1 or d-H1 (500 µM) to ProTα (50 µM). e, ITC of interactions of ProTα with l-H1155–175 and d-H1155–175. Raw ITC thermograms (left) and fitted one-site binding isotherms (right). DP, differential power. f, smFRET of l-H1155–175 or d-H1155–175 with ProTα, fitting FRET efficiency (⟨E⟩) as a function of ligand concentration to obtain Kd values. g, MCL1 is folded and interacts with the disordered PUMA peptide, which forms an α-helix upon interaction via induced fit. h, Far-UV CD spectra of l-PUMA and d-PUMA peptides, and their sum. i, ITC performed under the same conditions for both l-PUMA and d-PUMA (= 3, figure is representative). N/A, not applicable. j, ITC performed using higher concentrations of both MCL1 and d-PUMA (70 µM and 700 µM, respectively; n = 3, figure is representative). k, CSPs induced by the interaction of MCL1 (50 µM) with l-PUMA and d-PUMA at equal (90%) saturation (n = 1). l, Changes in NMR peak intensities upon addition of l-PUMA or d-PUMA to MCL1 at 90% saturation (n = 1). In all panels, l-peptides are represented in grey, and d-peptides are in orange. Blue diamonds indicate missing assignments, assigned residues that could not be tracked, or prolines. Source Data
Fig. 3
Fig. 3. RST interactions with l- and d-peptides vary depending on remaining disorder in the complex.
ac, The peptides of ANAC046 (a), DREB2A (b) and ANAC013 (c) are disordered in their free state, and form varying structures upon binding to RST (top right). Far-UV CD spectra show the l- and d-enantiomers of each peptide as mirror images (sum of l- and d-peptide spectra is shown in blue). df, ITC for binding of 10–100 µM RST in the cell with 100–1,000 µM of ANAC046 (d), DREB2A (e) or ANAC013 (f) peptide in the syringe (n = 3, figure is representative). gi, NMR CSPs of the interactions of RST with of ANAC046 (g), DREB2A (h) or ANAC013 (i) peptide showing the differences between the l- and d-enantiomers (>99% saturation, n = 1). Blue diamonds, indicate missing assignments, untraceable assigned residues or prolines. Source Data
Fig. 4
Fig. 4. Ability to bind d-enantiomers scales with disorder of the complex.
a, 13Cα SCS of l-enantiomers of ANAC046, DREB2A and ANAC013 in complex with RST. Four or more consecutive positive values indicate helical structure and three or more consecutive negative values indicate β-strand or extended structure. Grey regions highlight core structure. Key RST-interacting residues, shown as sticks in b, are highlighted in bold. b, Left, AlphaFold3-predicted structures of the RST complexes. Right, expanded view highlighting the binding sites, with interacting residues as sticks. c, Structure-based sequence alignment (top) and 15NH transverse relaxation rate constants (bottom) of free (light) and bound (dark) states of the RST-binding partners (error bars are standard errors of the fit). Asterisks indicate chemical exchange. The dashed line shows the outlier-excluded average R2 value for free RST,. Possible structures formed are indicated by the top schematic and key RST-interacting residues, shown as sticks in b, are highlighted in bold. d, Ionic strength dependence of Kd value (error bars are s.d. from two technical replicates). The line is a linear fit of log(Kd) versus [NaCl] with concentrations varying from 10–30 µM RST in the cell and 100–300 µM peptide in the syringe (n = 2 except at 100 mM NaCl, where = 3). e, Thermodynamic parameters of l- and d-enantiomer binding to RST. f, Stereosensitivity of the five model protein systems shown as the difference in ΔG (ΔΔGd-l, left y axis) and the fractional loss of binding energy (ΔΔGd-l/∣ΔGL∣, right y axis). g, Correlation between total CSP of the partner protein (ProTα, RST or MCL1) induced by l-enantiomer binding and the sensitivity to stereochemistry expressed as fractional loss of binding energy. In f,g, the wedge indicates the extent of bound-state heterogeneity and error bars were calculated from s.d. of ITC parameter shown in Extended Data Tables 2 and 3. Source Data
Extended Data Fig. 1
Extended Data Fig. 1. 13C-HSQC NMR spectra showing Cα and Cβ chemical shifts of L- and D-peptides.
A L-H1155-175 and D-H1155-175; B L-ANAC046 and D-ANAC046; C L-DREB2A and D-DREB2A; D L-ANAC013 and D-ANAC013; E L-PUMA and D-PUMA. All L-peptides displayed in grey and D-peptides in orange. For A and E, a line at 35 ppm in the 13C-dimension originates from the presence of Tris in the buffer.
Extended Data Fig. 2
Extended Data Fig. 2. AlphaFold3 models of ANAC046 and ANAC013 peptides in complex with RST.
Peptide models agreeing with experimental data colored according to the pLDDT of ANAC046 (A) and ANAC013 (B). RST is shown in grey in a representative conformation to ease the comparison of the peptide models. The color scheme is shown at the top and matches the scale used by Alphafold3. PyMol version 2.6.0a0 was used to visualise the structures.
Extended Data Fig. 3
Extended Data Fig. 3. Comparison of NMR peak intensities from binding L- and D-enantiomers to RST.
Intensity ratios reported for the interactions of RST with D- (orange) and L-version (grey) of ANAC046319-338 (top), DREB2A255-272 (middle), and ANAC013254-274 (bottom). The saturation was in all cases 99% or above.
Extended Data Fig. 4
Extended Data Fig. 4. NMR lineshape analysis of titration of RST with RST-interacting peptides using TITAN.
A L-ANAC046; B D-ANAC046; C L-DREB2A; D D-DREB2A; E L-ANAC013; F D-ANAC013. A concentration range of 0, 20, 40, 60, 80, 100, and 200 µM peptide (final concentration in sample) was titrated into 15N-RST with a concentration of 100 µM.
Extended Data Fig. 5
Extended Data Fig. 5. Free energy diagrams of transcription factor-peptide interactions with RST.
Differences in binding free energies, ΔΔG from ITC and differences in activation free energies between D- and L-peptides, ΔΔGunbound-ǂ,D-L, from NMR lineshape analysis (Extended Data Fig. 4, Extended Data Table 3). (orange: D; gray: L).
Extended Data Fig. 6
Extended Data Fig. 6. Cα-CEST profiles of 13C,15N-labeled L-ANAC046319-338 peptide with 5% RST.
A concentration of 1 mM13C,15N-L-ANAC046319-338 with 50 µM RST was used in the CEST experiment to ensure 5% saturation based on the Kd from ITC. The used pulse sequences modulate HSQCs as a function of i−1 carbon saturation. Hence the HSQC peak of residue e.g. S321 is modulated as a function of K320 carbon saturation. The profiles shown correspond to the Cα of the residue given at each plot. The pulse sequence used cannot probe the Cα of G325 in the peptide. The dots show the experimental data while the line shows the fit. The vertical grey dotted, and solid lines correspond to the chemical shift given from the fit of the peptide’s unbound and bound states, respectively. Residuals are shown above each plot. The additional smaller dips in the CEST profile of D328 could not be recaptured in the 15N-CEST or 13C’-CEST profiles, suggesting they originate form noise.
Extended Data Fig. 7
Extended Data Fig. 7. ZZ-exchange NMR spectroscopy of L-ANAC013 in complex with RCD1-RST at 25 °C.
The ZZ-exchange spectrum of L-ANAC013 (100 µM L-ANAC013 + 50 µM RST, grey) is overlayed with L-ANAC013 in its free (650 µM L-ANAC013, yellow) and bound form (650 µM L-ANAC013 + 800 µM RST, orange). The dashed lines connect the peaks from the free state to those of the bound state via ZZ-exchange cross-peaks. Example highlighted for Glu262.

References

    1. Holehouse, A. S. & Kragelund, B. B. The molecular basis for cellular function of intrinsically disordered protein regions. Nat. Rev. Mol. Cell Biol.25, 187–211 (2024). - PMC - PubMed
    1. Mason, S. F. Origins of biomolecular handedness. Nature311, 19–23 (1984). - PubMed
    1. Silverman, M. P., Badoz, J. & Briat, B. Chiral reflection from a naturally optically active medium. Opt. Lett.17, 886 (1992). - PubMed
    1. Ikawa, M. & Snell, E. E. Cell wall composition of lactic acid bacteria. J. Biol. Chem.235, 1376–1382 (1960). - PubMed
    1. Ikawa, M. & Snell, E. E. d-glutamic acid and amino sugars as cell wall constituents in lactic acid bacteria. Biochim. Biophys. Acta19, 576–578 (1956). - PubMed