. 2024 Nov 27;7(1):1532.
doi: 10.1038/s42003-024-07069-6.

Proximal tubule cell maturation rate and function are controlled by PPARα signaling in kidney organoids

Affiliations

Proximal tubule cell maturation rate and function are controlled by PPARα signaling in kidney organoids

Yoshiki Sahara et al. Commun Biol. .

Abstract

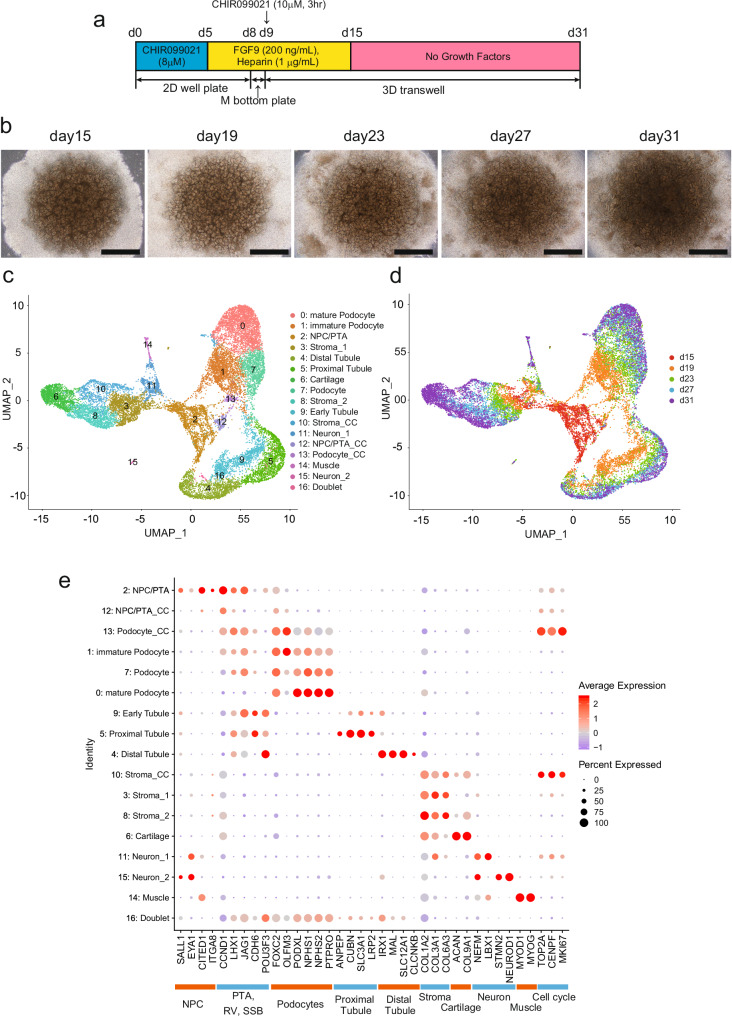
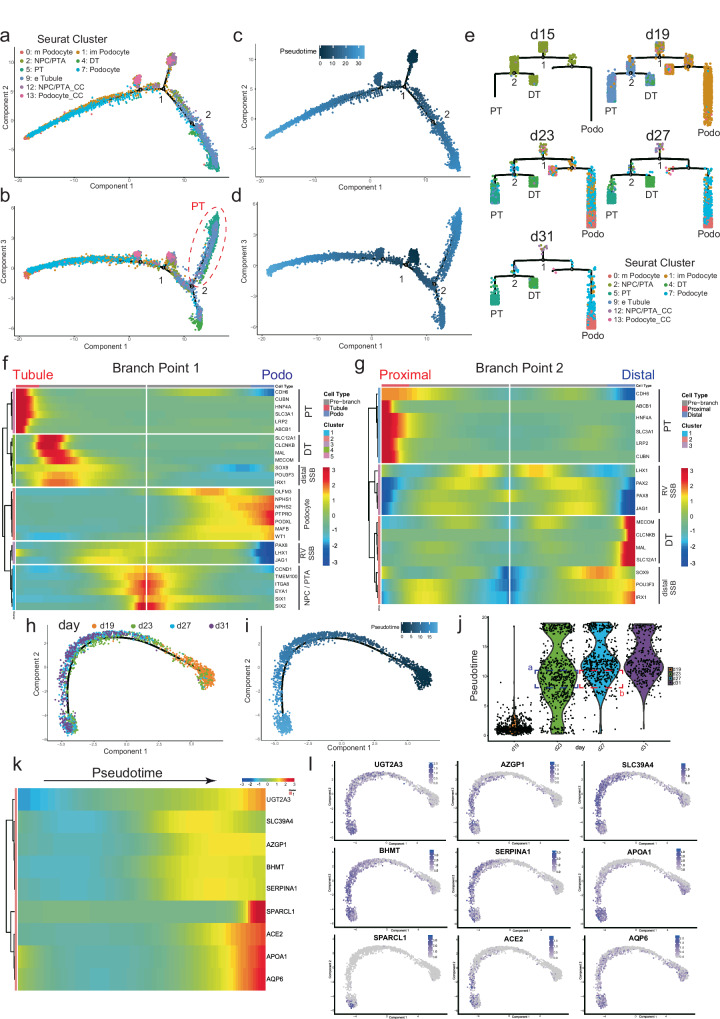
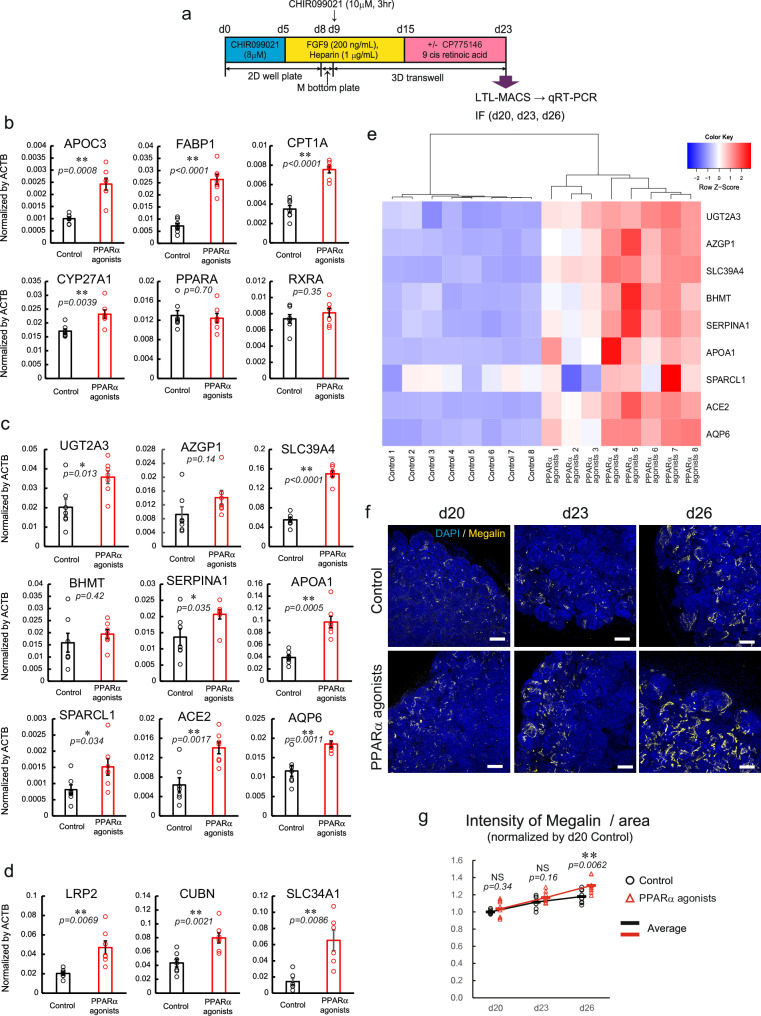
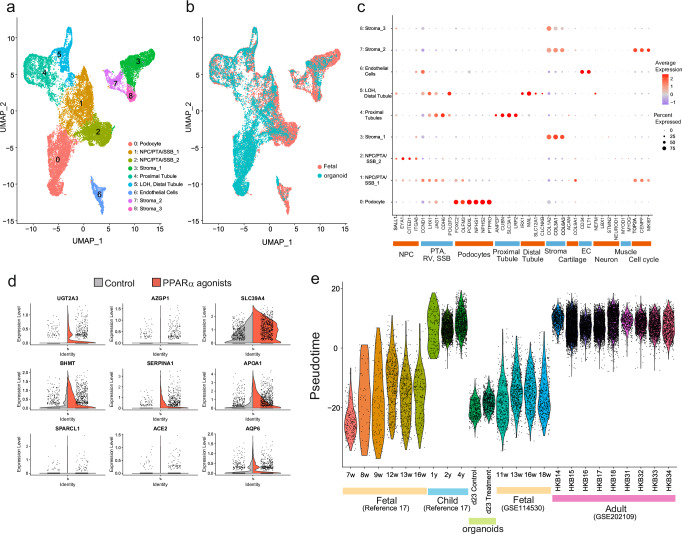
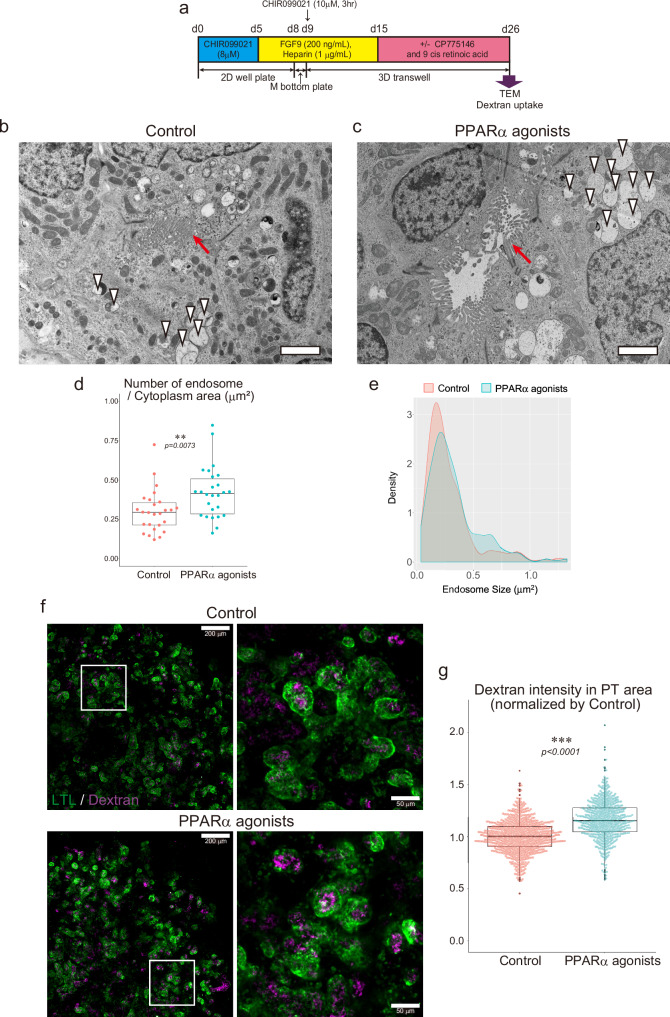
Human pluripotent stem cell-derived kidney organoids are expected to be a useful tool for new drug discoveries, however, the immaturation of kidney organoids causes difficulties in recapitulating renal pharmacokinetics using organoids. Here, we performed time-course single-cell RNA sequencing of kidney organoids and revealed cell heterogeneity in the maturation rate of the proximal tubule. An unbiased analysis to identify upstream targets of genes that are expressed differentially between cells with low and high maturation rates revealed a higher activation of PPARα signaling in rapidly maturing cells. Treatment with a combination of a PPARα agonist and an RXRα agonist induced genes related to proximal tubule maturation and increased the capacity for protein uptake as well as the sensitivity to nephrotoxicity by cisplatin. This method to promote the maturation rate of proximal tubule cells has the potential to be utilized in microphysiological systems to recapitulate proximal tubule functions and to screen nephrotoxic drugs.


Conflict of interest statement

Competing interests: The authors declare no competing interests.

Figures

Fig. 1
Fig. 1. Cell heterogeneity in kidney organoids differentiated from human iPSCs.
a Scheme of the induction protocol of kidney organoids from iPSCs. b Phase contrast images of kidney organoids at days 15, 19, 23, 27 and 31. Scale bars, 1 mm. c, d Uniform Manifold Approximation and Projection (UMAP) plot of kidney organoids colored by clusters (c) and differentiation day (d). e Dotplot of all clusters with known kidney marker genes.
Fig. 2
Fig. 2. Pseudotime cell trajectories of kidney lineage cells in kidney organoids.
ad Pseudotime cell trajectory of component 1 against component 2 colored by Seurat clusters (a) and pseudotime (c). Pseudotime cell trajectory of component 1 against component 3 colored by Seurat clusters (b) and pseudotime (d). 1 and 2 indicate the branch points. The red dashed line indicates the proximal tubule state (PT). e Plot complex cell trajectory of each time point colored by Seurat clusters. 1 and 2 indicate the branch points. f, g Branched heatmap for known marker genes of kidney development at branch point 1 (f) and branch point 2 (g). h, i Pseudotime cell trajectory of proximal tubule lineage cells in kidney organoids colored by day (h) and colored by pseudotime (i). j Violin plot of cells from proximal tubule lineage cells against pseudotime at each time point. Blue and red brackets indicate proximal tubule cells with pseudotime 8-11 at day 23 and day 27, respectively. k, l Pseudotime heatmap of genes altered in the late stage of pseudotime cell trajectory using proximal tubule lineage cells (k) and feature plots of those genes (l).
Fig. 3
Fig. 3. Activation of the PPARα pathway increases the expression of maturation markers in proximal tubule cells sorted by LTL-MACS from kidney organoids.
a Scheme of the induction protocol of kidney organoids from hiPSCs treated with PPARα agonists. bd Gene expression levels of downstream genes of the PPARα pathway and gene expression levels of PPARA and RXRA (b), maturation markers (c) and proximal tubule markers (d) in proximal tubule cells of day 23; means ± SE, n = 7–8 experiments. e Heatmap showing the expression levels of maturation marker genes from each sample treatment with or without PPARα agonists. Columns indicate data for each sample from positive fractions of LTL-MACS-sorted kidney organoids treated with vehicle or PPARα agonists. f Immunostaining of megalin in kidney organoids at day 20, 23, and 26 treatments with vehicle (Control) or PPARα agonists. Megalin: Yellow, DAPI: Blue, Scale bars, 100 µm. g Dotplots of the intensity of megalin per area in the control group and PPARα agonists-treated group at days 20, 23, and 26 of kidney organoids normalized by the control group at day 20; means ± SE, n = 7 experiments. Statistical significance was determined by unpaired two-tailed t-test (*p < 0.05, **p < 0.01).
Fig. 4
Fig. 4. Comparison of maturity levels of proximal tubule cells within fetal, child, and adult kidneys and kidney organoids by using scRNA-seq.
a, b UMAP plot of kidney organoids and fetal kidneys colored by clusters (a) and origin of data (b). c Dotplot of all clusters with known kidney marker genes. d Violin plot of CL4 in kidney organoids with proximal tubule maturation markers. Gray: control group, Red: PPARα agonists-treated group. e Violin plot of pseudotime of proximal tubule maturation in KCA fetal, KCA child, organoids, fetal kidneys, and adult kidneys.
Fig. 5
Fig. 5. Functional maturation of proximal tubules by activation of the PPARα pathway.
a Scheme of the induction protocol of kidney organoids from hiPSCs treated with PPARα agonists for TEM and dextran uptake assay. b, c TEM images from the control (b) and the PPARα agonists-treated group (c). White arrowheads indicate endosomes; Red arrows indicate brush borders. Scale bar, 2 μm. d, e Number of endosomes per 1 μm2 of cytoplasm in the proximal tubule cell (d), and density plot for endosome size in proximal tubule cells (e) from TEM image treated with control or PPARα agonists-treated group; n = 26 cells. f Immunostaining of pHrodo™ Red Dextran uptake into kidney organoids in control and in PPARα agonists-treated group. Right panels represent magnifying images of each condition. LTL: Green, pHrodo™ Red Dextran 10,000 MW: Magenta, scale bars: 200 μm and 50 μm. g Dotplots of intensity of dextran in PT areas normalized by control group; n = 746 (from 5 organoids) in control group, n = 652 (from 5 organoids) in PPARα agonists-treated group. Statistical significance was determined by unpaired two-tailed t-test (**p < 0.01, ***p < 0.001).
Fig. 6
Fig. 6. Cisplatin-induced nephrotoxicity assay using mature proximal tubules in kidney organoids.
a Scheme of the induction protocol of kidney organoids from hiPSCs treated with PPARα agonists for cisplatin-induced nephrotoxicity assay. b Representative immunostaining images of cisplatin treatment for 1 day and 6 days in the control and PPARα agonists-treated groups. Blue: DAPI, Green: LTL, Magenta: γH2AX. Scale bars, 100 μm. c Quantification of total γH2AX counts in the PT area within kidney organoids after cisplatin treatment for 1 day and 6 days in the control and PPARα agonists-treated groups. The Y-axes were normalized to the average value of the cisplatin-untreated group, which was set as 1. Images of the entire kidney organoid were captured, and the staining was performed using three organoids per group. Data are presented as means ± SE, n = 3 experiments. Statistical significance was determined by unpaired two-tailed t-test (*p < 0.05, **p < 0.01). d Representative histograms of LTL-FITC in the control group with untreated (upper left), with CDDP 5 μM (upper right), or in PPARα agonists-treated group with untreated (lower left), with CDDP 5 μM (lower right). The numbers represent the percentage of LTL-FITC positive cells (PT cells). e Percentage of LTL-positive cells in the control group and PPARα agonists-treated group before and after treatment with CDDP 5 μM for 6 days. The color of the lines indicates the same experimental run; n = 5 experiments. Statistical significance was determined by paired t-test.

References

    1. Takasato, M. et al. Kidney organoids from human iPS cells contain multiple lineages and model human nephrogenesis. Nature526, 564–568 (2015). - PubMed
    1. Gupta, N. et al. Modeling injury and repair in kidney organoids reveals that homologous recombination governs tubular intrinsic repair. Sci. Transl. Med.14, eabj4772 (2022). - PMC - PubMed
    1. Lemos, D. R. et al. Interleukin-1b activates a MYC-dependent metabolic switch in kidney stromal cells necessary for progressive tubulointerstitial fibrosis. J. Am. Soc. Nephrol.29, 1690–1705 (2018). - PMC - PubMed
    1. Shimizu, T. et al. A novel ADPKD model using kidney organoids derived from disease-specific human iPSCs. Biochem. Biophys. Res. Commun.529, 1186–1194 (2020). - PubMed
    1. Vishy, C. E. et al. Genetics of cystogenesis in base-edited human organoids reveal therapeutic strategies for polycystic kidney disease. Cell Stem Cell31, 537–553.e5 (2024). - PMC - PubMed

MeSH terms