. 2024 Nov 28;43(1):311.
doi: 10.1186/s13046-024-03231-4.

Tailoring glioblastoma treatment based on longitudinal analysis of post-surgical tumor microenvironment

Affiliations

Tailoring glioblastoma treatment based on longitudinal analysis of post-surgical tumor microenvironment

Chiara Bastiancich et al. J Exp Clin Cancer Res. .

Abstract

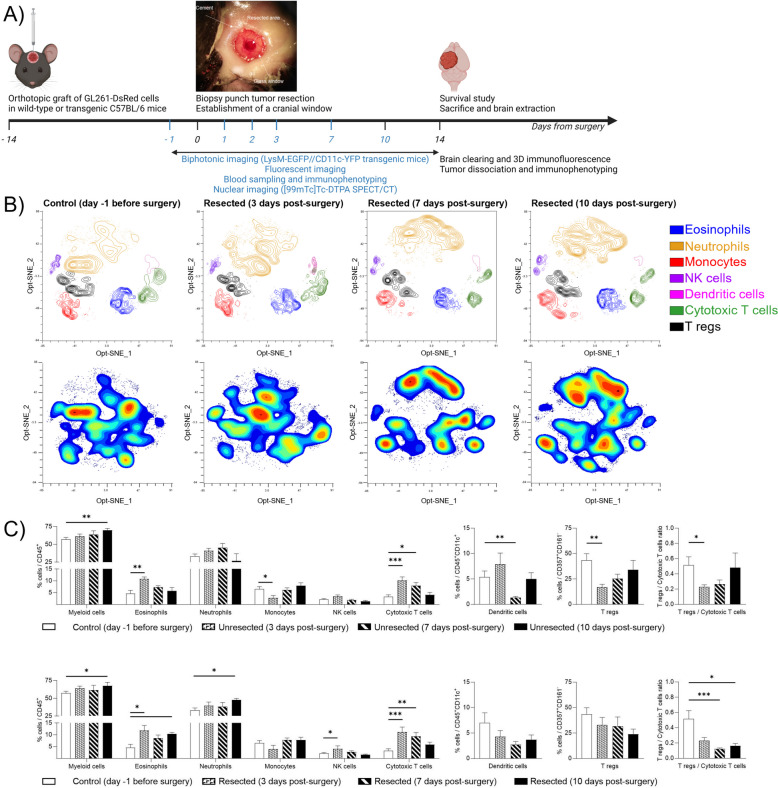
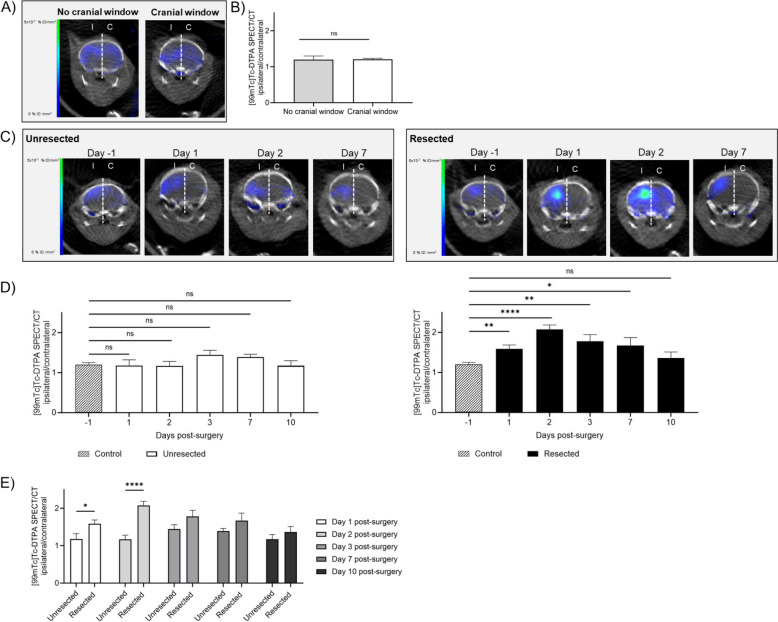
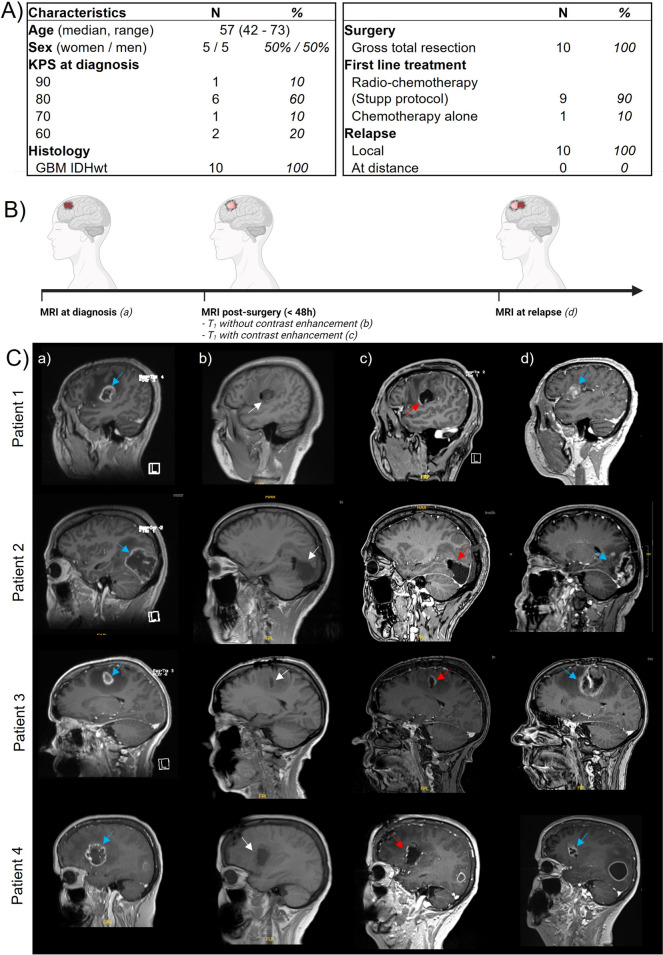
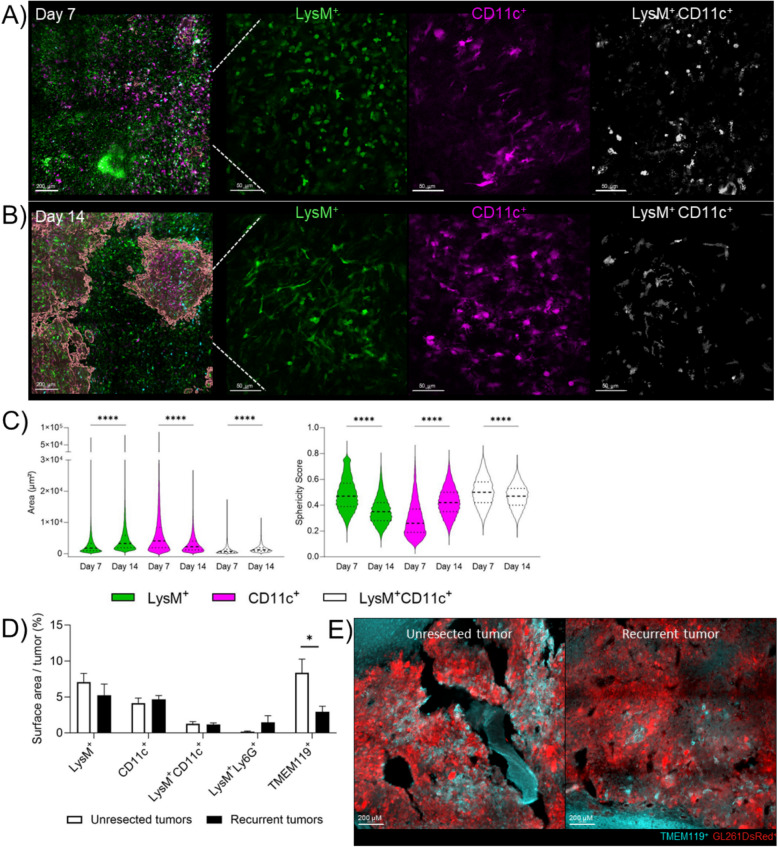
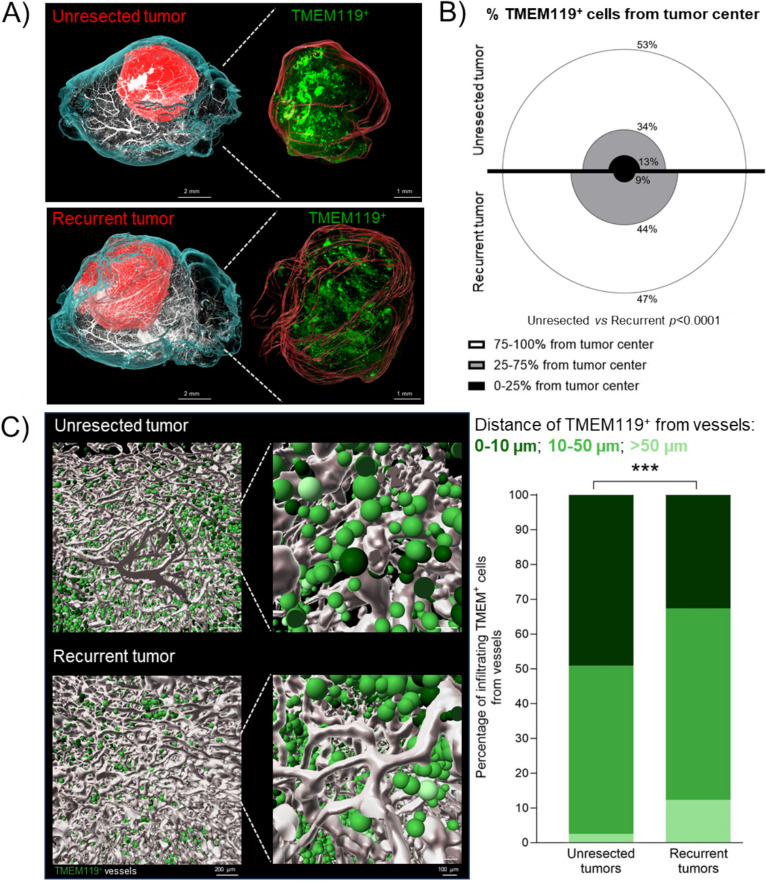
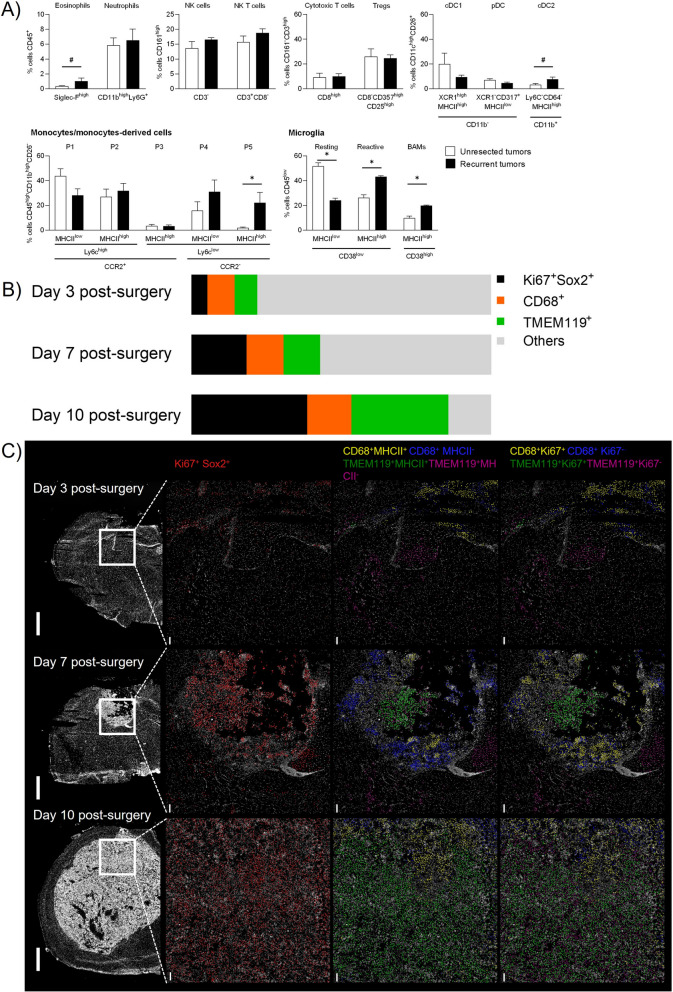
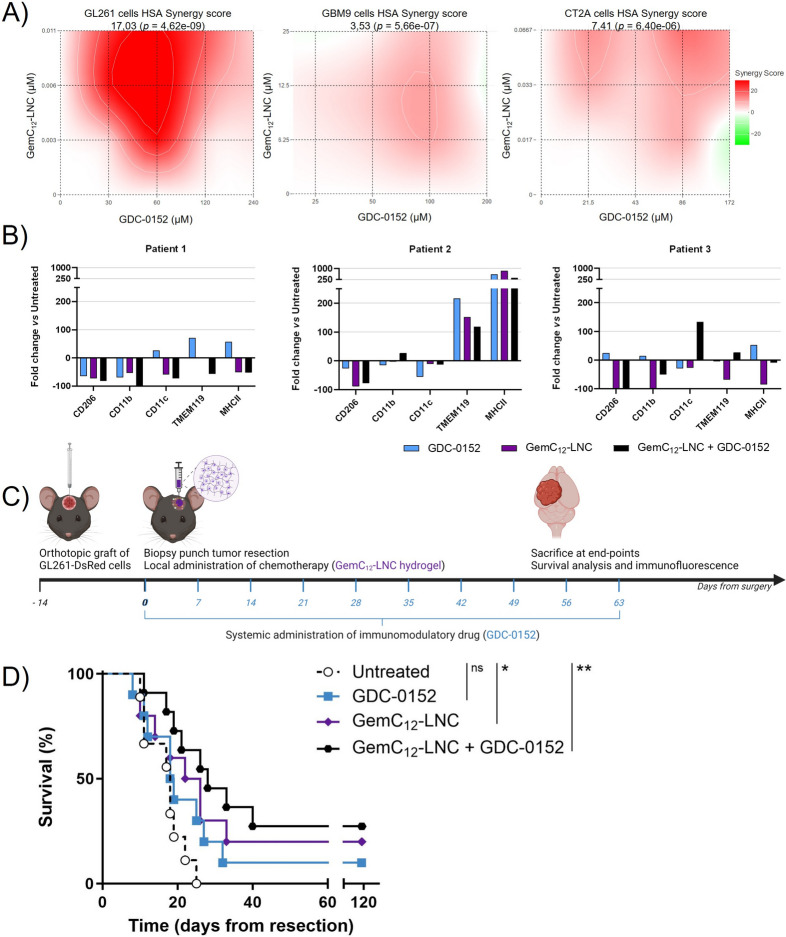
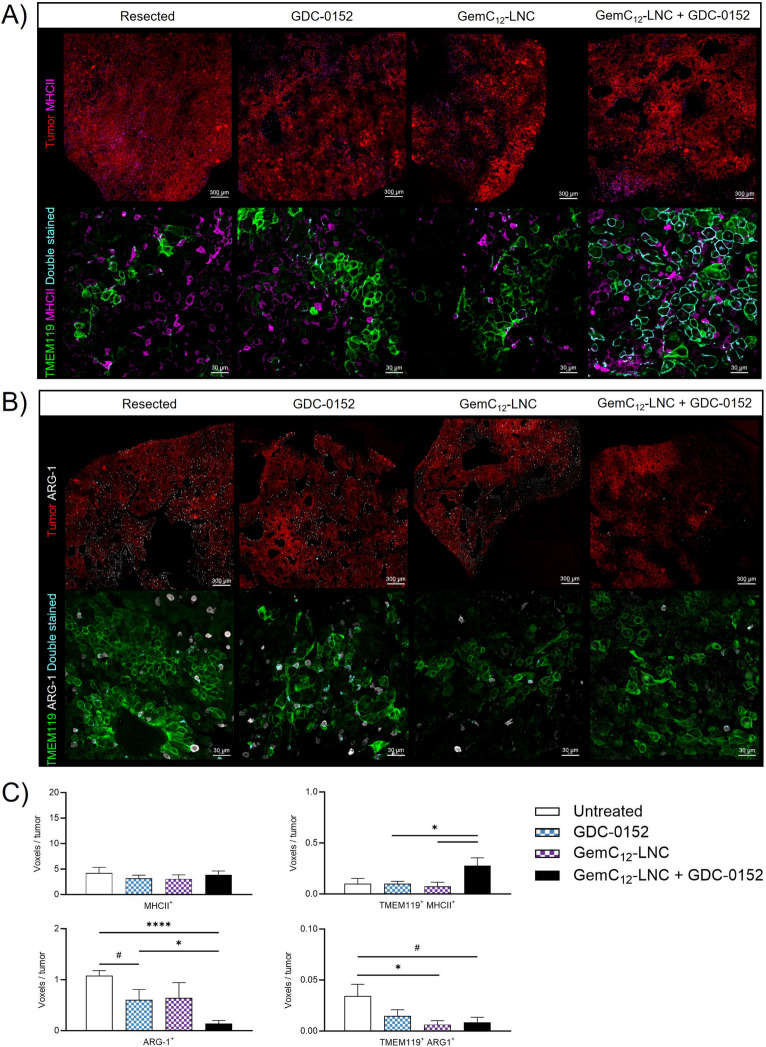
Glioblastoma (GBM), an incurable primary brain tumor, typically requires surgical intervention followed by chemoradiation; however, recurrences remain fatal. Our previous work demonstrated that a nanomedicine hydrogel (GemC12-LNC) delays recurrence when administered post-surgery. However, tumor debulking also triggers time-dependent immune reactions that promote recurrence at the resection cavity borders. We hypothesized that combining the hydrogel with an immunomodulatory drug could enhance therapeutic outcomes. A thorough characterization of the post-surgical microenvironment (SMe) is crucial to guide combinatorial approaches.In this study, we performed cellular resolution imaging, flow cytometry and spatial hyperplexed immunofluorescence imaging to characterize the SMe in a syngeneic mouse model of tumor resection. Owing to our dynamic approach, we observed transient opening of the blood-brain barrier (BBB) during the first week after surgery. BBB permeability post-surgery was also confirmed in GBM patients. In our murine model, we also observed changes in immune cell morphology and spatial location post-surgery over time in resected animals as well as the accumulation of reactive microglia and anti-inflammatory macrophages in recurrences compared to unresected tumors since the first steps of recurrence growth. Therefore we investigated whether starting a systemic treatment with the SMAC mimetic small molecule (GDC-0152) directly after surgery would be beneficial for enhancing microglial anti-tumoral activity and decreasing the number of anti-inflammatory macrophages around the GemC12-LNC hydrogel-loaded tumor cavity. The immunomodulatory effects of this drug combination was firstly shown in patient-derived tumoroids. Its efficacy was confirmed in vivo by survival analysis and correlated with reversal of the immune profile as well as delayed tumor recurrence.This comprehensive study identified critical time frames and immune cellular targets within the SMe, aiding in the rational design of combination therapies to delay recurrence onset. Our findings suggest that post-surgical systemic injection of GDC-0152 in combination with GemC12-LNC local treatment is a promising and innovative approach for managing GBM recurrence, with potential for future translation to human patient.

Keywords: Brain tumor surgery; Drug Delivery; Glioblastoma; Neuro-oncology; Targeted therapy; Tumor microenvironment.


Conflict of interest statement

Declarations. Ethics approval and consent to participate: All patient data were obtained according to a protocol approved by the local institutional review board and ethical committee (PADS 20–343). The present study was conducted in accordance with the declaration of Helsinki. The in vivo experiments reported in this work have been approved by the institution’s Animal Care and Use Committee (CE71, Aix-Marseille Université, reference n° 22185) and performed following the French national regulation guidelines in accordance with EU Directive 2010/63/EU. Competing interests: The authors report no competing interests within this study.

Figures

Fig. 1
Fig. 1
Longitudinal characterization of the impact of surgery on tumor recurrence: mouse model and systemic immune modifications. A) Time and work flow of the methods used in this paper to characterize longitudinally the systemic and local brain microenvironment from surgery to recurrence, as well as the post-mortem analysis performed to identify therapeutic targets in the microenvironment of recurrent tumors. The panel shows a light microscope image of the cranial window and resected area immediately after tumor resection; B) Identification of immune cell population in mice blood using flow cytometry. The upper panels show Opt-SNE of manually selected cell cluster validated by FlowSOM analysis for control and resected animals at day 3, 7 and 10 post-surgery. The lower panel represents, for the same groups of animals, the density contour plot of the different immune cell clusters in mice blood projected onto an Opt-SNE map; C) Frequency of repartition of blood immune cell clusters for control and unresected (upper panel) or resected (lower panel) animals at day 3, 7 and 10 post-surgery compared to day one before surgery. Numbers are expressed as percentage of cells related to CD45+ cells (for myeloid cells CD11b+, eosinophils, neutrophils, NK cells, Cytotoxic T cells), CD45+CD11c+ cells (for dendritic cells), CD357+CD161 (for Tregs). The right panel represents the ratio between Tregs and Cytotoxic T cells. (average ± SEM, n = 5–9; Kruskal–Wallis nonparametric analysis with uncorrected Dunn's test, *p < 0.05; **p < 0.01; ***p < 0.001)
Fig. 2
Fig. 2
Longitudinal characterization of the impact of surgery on BBB permeability. A) Brain representative SPECT/CT tomographic images of [99mTc]Tc-DTPA distribution in animals that did not received cranial window implantation (no cranial window, left panel) or received cranial window implantation at the time of tumor cells grafting (cranial window, right panel) at day 13 post-grafting. The white dotted line represents the separation between ipsilateral (I) and contralateral (C) brain hemispheres that were used for the quantifications; B) Quantification of [99mTc]Tc-DTPA activity at day 13 post-grafting (one day prior to operation) in animals that did not received cranial window implantation (no cranial window) or received cranial window implantation at the time of tumor cells grafting (cranial window). These two groups of animals (representing the resection control and cranial window control, respectively) were then combined to establish the control group in panel D; C) Brain representative SPECT/CT tomographic images of [99mTc]Tc-DTPA distribution in animals that received cranial window implantation (unresected, left panel) or resective surgery and cranial window implantation (resected, right panel) 14 days following tumor cells grafting. Images were acquired at different times pre- and post-operation; D) Quantification of [99mTc]Tc-DTPA activity in control animals (imaging of control animals at day 13 post-grafting) vs animals 1, 2, 3, 7, 10 days post-implantation of the cranial window (unresected, left panel) or resective surgery and cranial window implantation (resected, right panel); E) Quantification of [99mTc]Tc-DTPA activity in animals 1, 2, 3, 7, 10 days post-surgery (cranial window implantation vs resection and cranial window implantation). For panels B, D and E panels, results are expressed as I/C ratio (n = 5–13, mean ± SEM; Unpaired t test with Welch’s correction; ns = not significant, *p < 0.05, **p < 0.01, ****p < 0.0001)
Fig. 3
Fig. 3
Surgery induces local modifications to the cerebral microenvironment in GBM patients. A) Patient characteristics of peri-operative cohort; B) Study design: GBM patients were enrolled in the study and magnetic resonance imaging (MRI) was performed at time of diagnosis, within 48 h post-surgery (without and with contrast enhancement) and at relapse; C) Illustrative brain MRI imaging of four patients showing a T1 sequence with (a, c, d) or without (b) contrast enhancement, before (a) and after gross total resection (b and c) and at relapse (d). The blue arrows show the initial and recurrent tumor location, the white arrows show the tumor cavity location (b) and the red arrows show contrast enhancement associated with post-surgery BBB opening (c)
Fig. 4
Fig. 4
Post-surgical modulation of the brain and tumor microenvironment over time. A-B) Two-photon images at day 7 (panel A) and 14 (panel B) post-resection and cranial window implantation showing LysM+ cells (green), CD11c+ cells (purple), LysM+CD11c+ cells (white). The reconstruction of the tumor is represented in red in the left panels. Scale bar = 200 µm in the left panels, 50 µm in the three right panels; C) Violin plots representing the area (left panel) and sphericity score (right panel) of LysM+, CD11c+ and LysM+CD11c+ cells at day 7 and 14. The bar graphs represent mean ± SEM (n = 3 animals per group; paired nonparametric Wilcoxon test, ****p < 0.0001); D) Percentage of cells expressing LysM+, CD11c+, LysM+CD11c+, LysM+Ly6G+ or TMEM119+ in unresected or recurrent tumors at time of sacrifice (n = 3–4 animals per group; Mann–Whitney test *p < 0.05); E Representative pictures of TMEM119 staining in unresected and recurrent tumors, where tumor cells are GL261-DsRed+. Reconstitution, image analyses and cells quantifications were performed using Imaris software
Fig. 5
Fig. 5
3D spatial characterization of the TMEM+ microglia distribution in unresected and recurrent tumors. A) Representative 3D light-sheet microscopy images of C57BL/6 mouse brains bearing GBM unresected and recurrent tumors (left and right panel, respectively). The hemi-brains were labeled for: blood vessels (CD31, Podocalyxin and a-SMA in white) and microglia (TMEM119, in green). The reconstruction of the brain and tumor are represented in cyan and red, respectively. Scale bar: 2 mm in left panel, 1 mm in right panel; B) Graphical representation of the percentage of TMEM119+ microglia from tumor center in each of the distance zone (n = 5; Chi2 test of independence); C) Graphical representations (left panels) and quantification (right panels) of the distance of TMEM119+ microglia from vessels (n = 5;Chi2 test of independence, ****p < 0.0001). Vessels are represented in white, and TMEM119+ in different shades of green (darker: 0–10 µm from vessels; medium: 10–50 µm; lighter: > 50 µm). Scale bar: 200 µm in each left panel, 100 µm in each right panel. Reconstitution and image analyses were performed by using Imaris software
Fig. 6
Fig. 6
The immune landscape of unresected and recurrent tumors and the SMe. A) Multiparametric flow cytometry analysis of tumors using the gating strategy reported in Figure S8 (DC: dendritic cells; BAMs: border associated macrophages). Statistical analysis was performed using nonparametric Mann–Whitney test (mean ± SEM, n = 4–5; #p = 0.05, *p < 0.05); B) Percent of Ki67+Sox2+, CD68+, TMEM119+ among the total cells quantified in the region of interest of hyperplexed immunofluorescence images during GL261 recurrence development at day 3, 7, 10 post-surgery (average value from 3 different slices); C) Representative images of post surgical resection cavity in GL261-DsRed bearing animals imaged with MACSima technology during recurrence development at day 3, 7 and 10 post surgery (left panels, white DAPI staining). The right panels show the spatial location of Ki67+Sox2+ (middle left panel), CD68+MHCII+, CD68+MHCII, TMEM119+MHCII+, TMEM119+MHCII cells (middle right panel) and CD68+Ki67+,CD68+ Ki67, TMEM119+Ki67+, TMEM119+Ki67 (right panel). Scale bar: 1 mm in left panel, 100 µm in the other panels
Fig. 7
Fig. 7
A tailored combinatory approach to target the SMe and delay the onset of GBM recurrences. A) Heat maps representing the HSA synergy score obtained using a 3 × 4 matrix to test the GemC12-LNC and GDC-0152 combination on GL261 (left panel), GBM9 (middle panel) and CT2A cells (right panel); B) Effect of GDC-0152, GemC12-LNC and their combination on the immune cells expression of CD206, CD11b, CD11c, TMEM119, MHCII in tumoroids from three different patients as fold change versus untreated tumoroids; C) Schematic representation of the treatment regimen proposed to target the SMe and the post-mortem analysis performed on the extracted brains; D) Kaplan–Meier survival curves of the tumor-bearing C57BL/6 mice receiving tumor surgery and treatment at day 14 post-grafting (n = 8–9; ns = non-significant; *p < 0.05; **p < 0.01)
Fig. 8
Fig. 8
A combinatory approach to reverse the post-surgical immunity. A-B) Representative confocal microscopy images of coronal brain slices from animals who had received resection or resection plus treatment(s). Sections were immuno-stained against MHCII (lower panel A, in purple), ARG-1 (lower panel B, in white) and TMEM119 (lower panels A and B, in green) while tumor cells transgenetically expressed DsRed (in red in the upper panels A and B). MHCII+/TMEM119+ cells (panel A) and ARG-1+/TMEM119+ (panel B) are represented in cyan in the lower panels to evaluate the level of microglial activation and the anti-inflammatory status, respectively. Scale bar: 300 µm for upper panels, 30 µm for lower panels; C) Quantifications of the densities of each cell sub-population (mean ± SEM, n = 4; Unpaired t test, # 0.05 < p < 0.06; *p < 0.05; ****p < 0.0001)

References

    1. Bagley SJ, Kothari S, Rahman R, Lee EQ, Dunn GP, Galanis E, et al. Glioblastoma clinical trials: current landscape and opportunities for improvement. Clin Cancer Res. 2022;28(4):594–602. - PMC - PubMed
    1. Weller M, van den Bent M, Tonn JC, Stupp R, Preusser M, Cohen-Jonathan-Moyal E, et al. European Association for Neuro-Oncology (EANO) guideline on the diagnosis and treatment of adult astrocytic and oligodendroglial gliomas. Lancet Oncol. 2017;18(6):e315–29. - PubMed
    1. Stupp R, Mason WP, van den Bent MJ, Weller M, Fisher B, Taphoorn MJ, et al. Radiotherapy plus concomitant and adjuvant temozolomide for glioblastoma. N Engl J Med. 2005;352(10):987–96. - PubMed
    1. Hamard L, Ratel D, Selek L, Berger F, van der Sanden B, Wion D. The brain tissue response to surgical injury and its possible contribution to glioma recurrence. J Neurooncol. 2016;128(1):1–8. - PubMed
    1. Knudsen AM, Halle B, Cédile O, Burton M, Baun C, Thisgaard H, et al. Surgical resection of glioblastomas induces pleiotrophin-mediated self-renewal of glioblastoma stem cells in recurrent tumors. Neuro Oncol. 2022;24(7):1074–87. - PMC - PubMed

LinkOut - more resources