[Preprint]. 2024 Nov 12:2024.11.11.622123.
doi: 10.1101/2024.11.11.622123.

Extensive binding of uncharacterized human transcription factors to genomic dark matter

Affiliations

Extensive binding of uncharacterized human transcription factors to genomic dark matter

Rozita Razavi et al. bioRxiv. .

Abstract

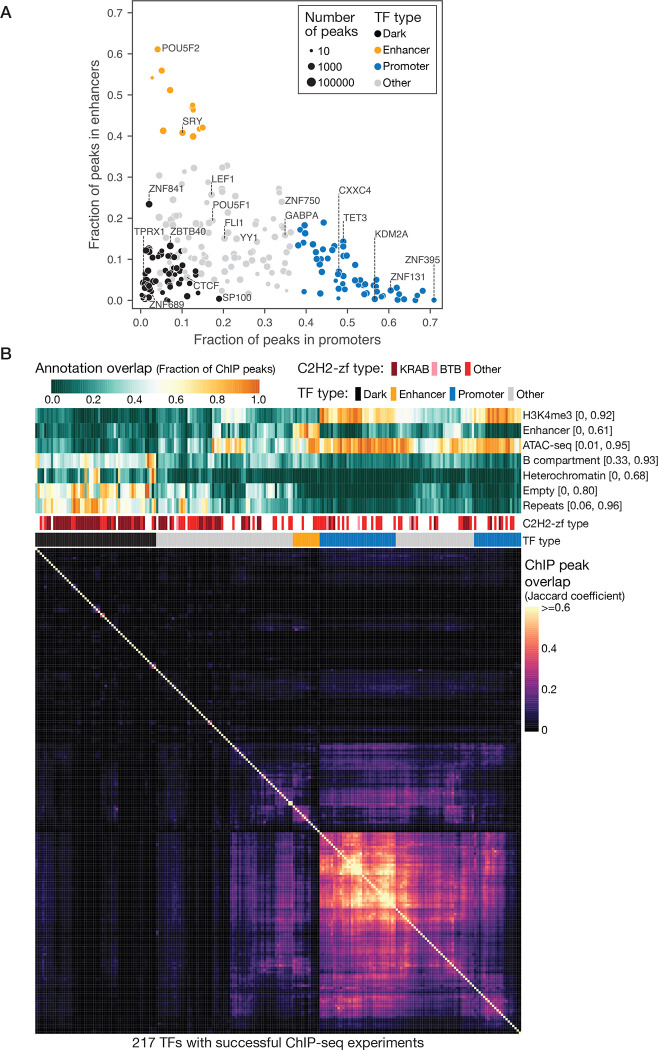
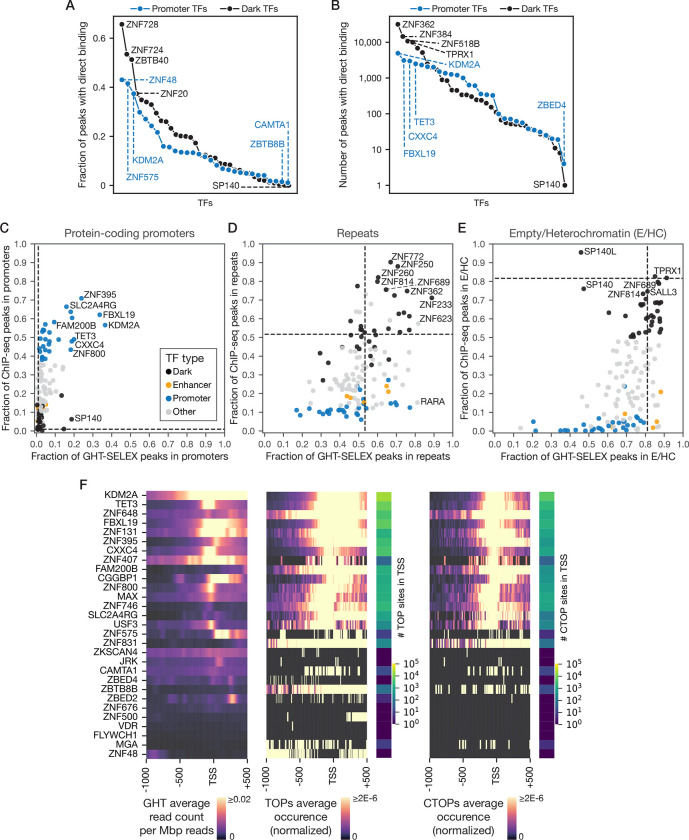
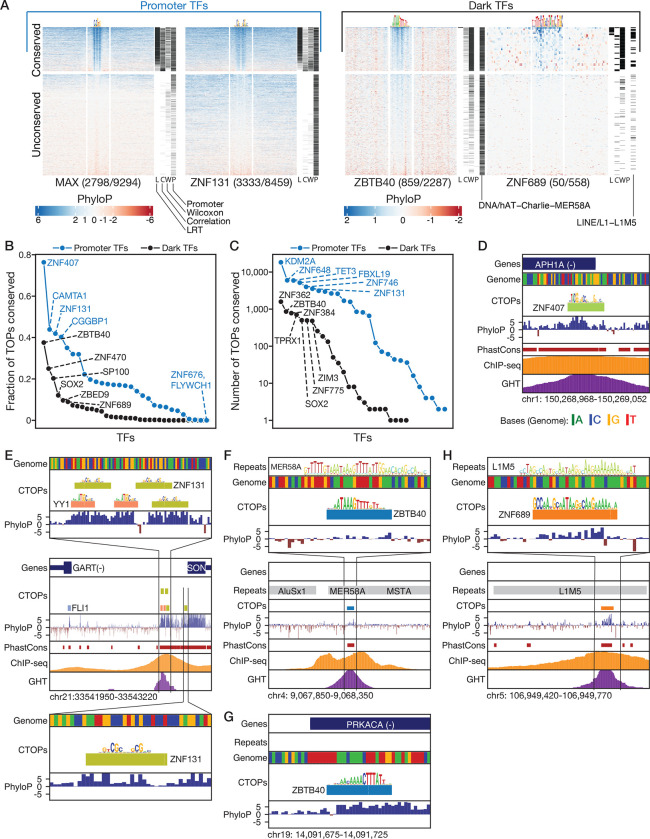
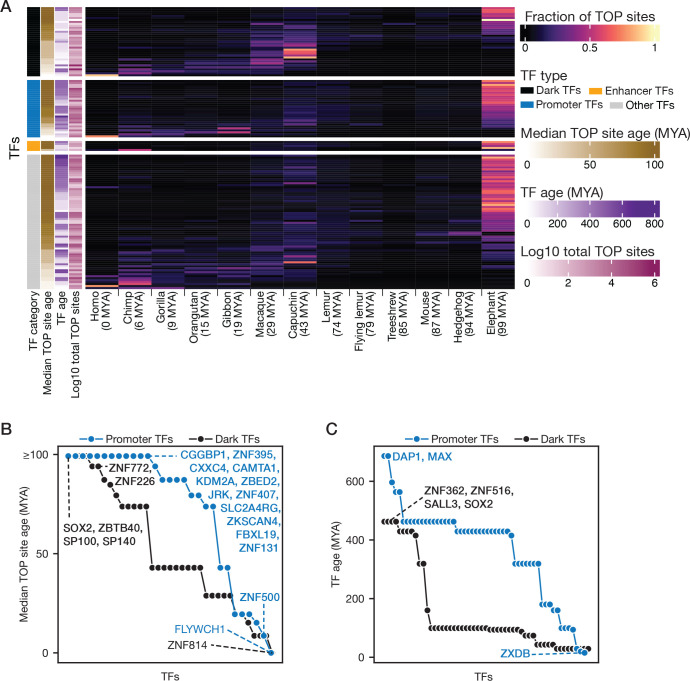
Most of the human genome is thought to be non-functional, and includes large segments often referred to as "dark matter" DNA. The genome also encodes hundreds of putative and poorly characterized transcription factors (TFs). We determined genomic binding locations of 166 uncharacterized human TFs in living cells. Nearly half of them associated strongly with known regulatory regions such as promoters and enhancers, often at conserved motif matches and co-localizing with each other. Surprisingly, the other half often associated with genomic dark matter, at largely unique sites, via intrinsic sequence recognition. Dozens of these, which we term "Dark TFs", mainly bind within regions of closed chromatin. Dark TF binding sites are enriched for transposable elements, and are rarely under purifying selection. Some Dark TFs are KZNFs, which contain the repressive KRAB domain, but many are not: the Dark TFs also include known or potential pioneer TFs. Compiled literature information supports that the Dark TFs exert diverse functions ranging from early development to tumor suppression. Thus, our results sheds light on a large fraction of previously uncharacterized human TFs and their unappreciated activities within the dark matter genome.

Keywords: C2H2; ChIP-seq; Codebook; GHT-SELEX; Gene regulation; KRAB zinc finger protein; PWM; SELEX; Transcription factor (TF).


Figures

Figure 1.
Figure 1.. Project overview.
(A) Overview of the TF categories assayed in this study. (B) A schematic of the experimental pipeline for production of 372 inducible EGFP-labelled TF cell lines used in ChIP experiments and deriving TF binding sites. (C) Samples of representative motifs obtained from different families of control TFs.
Figure 2.
Figure 2.. Overlapping in vivo binding sites of 217 TFs with each other and with various genomic regions.
(A) Fraction of ChIP-seq peaks in protein-coding promoters (x-axis) and HEK293 enhancers (y-axis). Point sizes are proportional to the number of peaks for each TF (log scale). (B) Bottom (square) heatmap: Jaccard similarity coefficient between ChIP-seq peaks of all TF pairs. Top heatmap: Fraction of ChIP-seq peaks falling within genomic regions, as indicated, and other properties of the TFs. Fractions are scaled to fit in [min, max] range across the TFs for better visualization, as indicated in the right. TF ordering is determined by hierarchical clustering with Ward linkage and Euclidean distance, using the tracks ‘H3K4me3’, ‘ATAC-seq’, ‘B compartment’, ‘Empty’ + ‘Heterochromatin’, ‘Repeats’, ‘CpG’, ‘Protein-coding promoters’, ‘H3K27ac’ (the last three not shown), along with the one-hot encoded ‘TF type’ to aid in illustration.
Figure 3.
Figure 3.. Characteristics of Promoter TFs, Enhancer TFs, and Dark TFs interaction with specific genomic sites.
Fraction (A) and absolute number (B) of peaks with direct binding (i.e. TOP sites) for Promoter TFs and Dark TFs. TFs are sorted to compare distributions. The denominator for (A) is the total number of ChIP peaks at the same optimized threshold. (C, D, E) Fraction of GHT-SELEX (x-axis) and ChIP-seq (y-axis) peaks falling in the specified genomic regions (protein-coding promoters, repeats, and empty or heterochromatin), using the peaks at the universal threshold. Dashed lines show the expected fraction if peaks were distributed at random. (F) Density of GHT-SELEX signal (left), TOP sites (middle), and CTOP sites (right) by position relative to TSS of protein-coding promoters, for 29 Promoter TFs that have available GHT-SELEX data. Intensity of heatmaps for TOPs (middle) and CTOPs (right) have been normalized by the total number of PWM hits (of TOPs and CTOPs, respectively) in promoters (shown at the right of each heatmap).
Figure 4.
Figure 4.. Conservation patterns of sequence-dependent TFs’ target sites (TOPs).
(A) Heatmaps of FDR-corrected phyloP scores across the TOP sites (rows), split into top and bottom segments that contain conserved and unconserved sites. Bars to the right indicate which tests of conservation are satisfied (Likelihood-ratio, Correlation, Wilcoxon), along with overlaps with promoters (P) and specific repeat families if applicable. 100 bp segments are shown with the PWM hit in the middle. Blue/positive phyloP indicates purifying selection, and red/negative phyloP values represent diversifying selection. (B, C) Fraction (B) and absolute number (C) of TOPs that are conserved, for Promoter TFs and Dark TFs, sorted to compare distributions. (D, E, F, G, H) Genome track displays of CTOP sites for ZNF407 (D), ZNF131 and YY1 (E), ZBTB40 at a hAT/Charlie (MER58A) element (F) and its most-conserved TOP (at the PRKACA promoter) (G), ZNF689 at an L1M5 element (H). The Dfam repeat model sequence logo is also shown for MER58A (F) and L1M1 (H).
Figure 5.
Figure 5.. Enrichment pattern of transposable elements in TFs’ TOPs.
(A) Heatmap of −log10 p-values for TFs (x-axis) that are enriched for binding specific TE families (y-axis). Labels show superfamily/family. (B) Binding of paralogous TFs, ZNF836 and ZNF841, to a homologous region in the two related LTR families, MSTA-int and THE1-int. Bottom plot shows the average ChIP-seq and GHT-SELEX signal (i.e. read count) across all the instances of MST-int and THE1-int aligned to their consensus. (C) Fraction of TOP sites in various repeat elements for two poly-A binding TFs ZNF362 and ZNF384. (D) An example of the Promoter TF ZNF676 binding site targeting an unconserved LTR12C sequence.
Figure 6.
Figure 6.. Age distribution of TOPs and their corresponding TFs.
(A) Heatmap showing the fraction of TOP sites for each TF dating to different mammalian clades in the human lineage, along with information about the TF category, median age of TOP sites and TFs (million years ago, MYA), and log 10 of total TOP sites. (B, C) Sorted median age of the TOP sites (B) and the age of the TFs (C) are compared for Dark TFs and Promoter TFs.
Figure 7.
Figure 7.. Consolidated functional information for Dark TFs.
Compiled protein-protein interactions (PPIs) mostly supported by two independent lines of support and grouped into three categories of TRIM28/33/39 interactions, zinc-finger (ZF) protein interactions, and CBX/HP1 interactions are shown at left. Median binding site age was calculated for TOP sites, only for the TFs with available GHT-SELEX data, shown along with the age of the TF. The fraction of ChIP-seq peaks (using the universal threshold) overlapping with H3K9me3 and H3K27me3 histone marks and with the ChromHMM “empty” state (None) are shown in the middle. For the repeat, in each superclass, the enrichment score (-log(p-value) hypergeometric test) for the most enriched repeat element within that superclass is plotted as a heatmap, and the most enriched repeat subtype across all the superfamilies is mentioned beside. The expert-curated sequence logos are displayed to the right (except for ZNF280D and SCML4 which did not produce any approved PWM), along with the corresponding phenotype for any TF with known biological function through literature review (in the same block).

Similar articles

References

    1. Partridge E.C. et al. Occupancy maps of 208 chromatin-associated proteins in one human cell type. Nature 583, 720–728 (2020). - PMC - PubMed
    1. Long H.K., Prescott S.L. & Wysocka J. Ever-Changing Landscapes: Transcriptional Enhancers in Development and Evolution. Cell 167, 1170–1187 (2016). - PMC - PubMed
    1. Lambert S.A. et al. The Human Transcription Factors. Cell 175, 598–599 (2018). - PubMed
    1. Sullivan P.F. et al. Leveraging base-pair mammalian constraint to understand genetic variation and human disease. Science 380, eabn2937 (2023). - PMC - PubMed
    1. Lenhard B. et al. Identification of conserved regulatory elements by comparative genome analysis. J Biol 2, 13 (2003). - PMC - PubMed

Publication types