[Preprint]. 2024 Nov 15:2024.11.13.623500.
doi: 10.1101/2024.11.13.623500.

Basal cell of origin resolves neuroendocrine-tuft lineage plasticity in cancer

Affiliations

Basal cell of origin resolves neuroendocrine-tuft lineage plasticity in cancer

Abbie S Ireland et al. bioRxiv. .

Update in

  • Basal cell of origin resolves neuroendocrine-tuft lineage plasticity in cancer.
    Ireland AS, Xie DA, Hawgood SB, Barbier MW, Zuo LY, Hanna BE, Lucas-Randolph S, Tyson DR, Witt BL, Govindan R, Dowlati A, Moser JC, Thomas A, Puri S, Rudin CM, Chan JM, Elliott A, Oliver TG. Ireland AS, et al. Nature. 2025 Nov;647(8088):257-267. doi: 10.1038/s41586-025-09503-z. Epub 2025 Sep 17. Nature. 2025. PMID: 40963028 Free PMC article.

Abstract

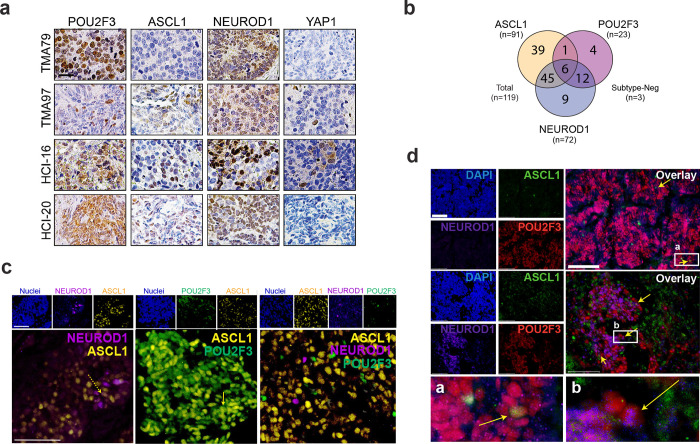
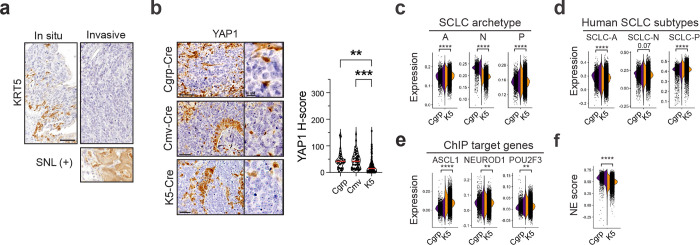
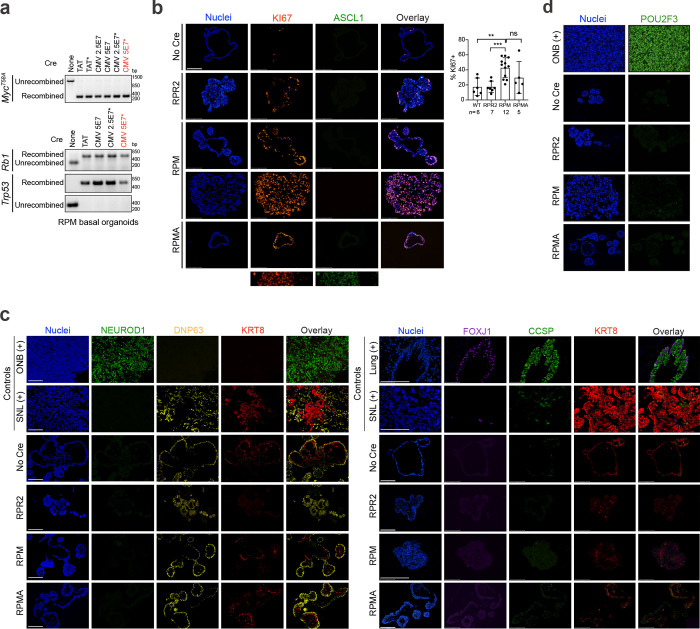
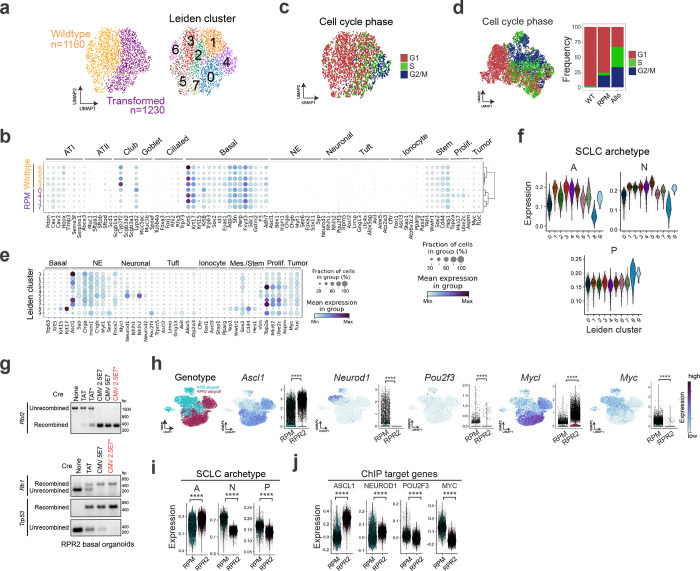
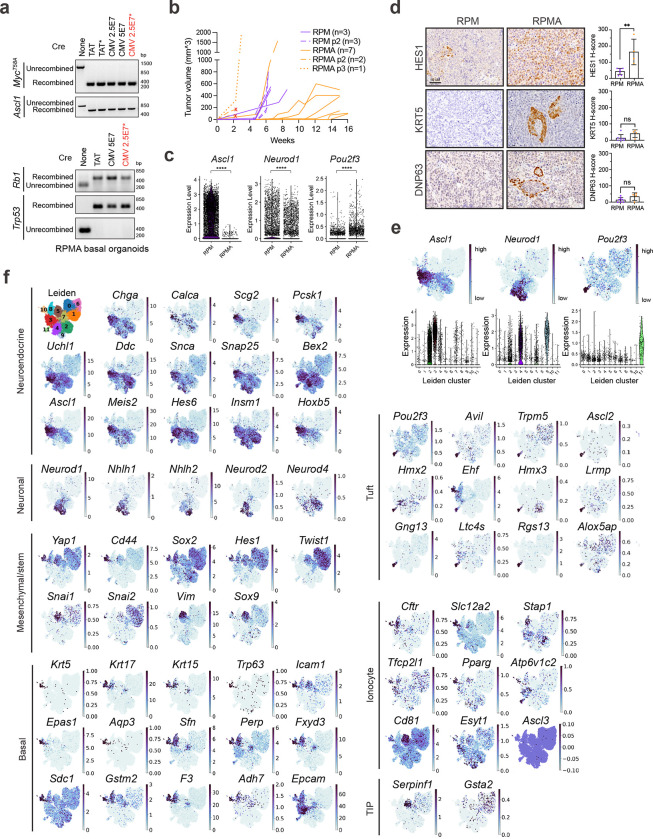
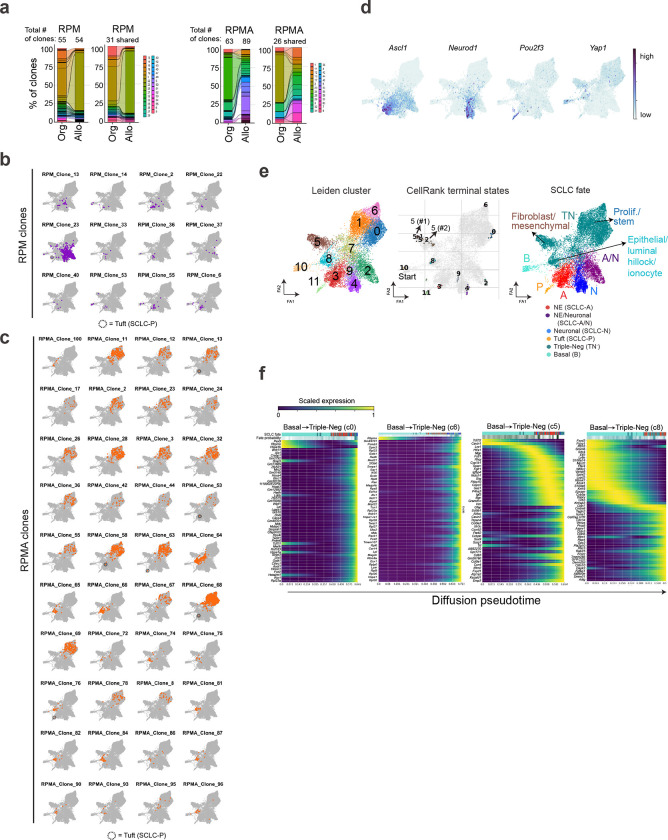
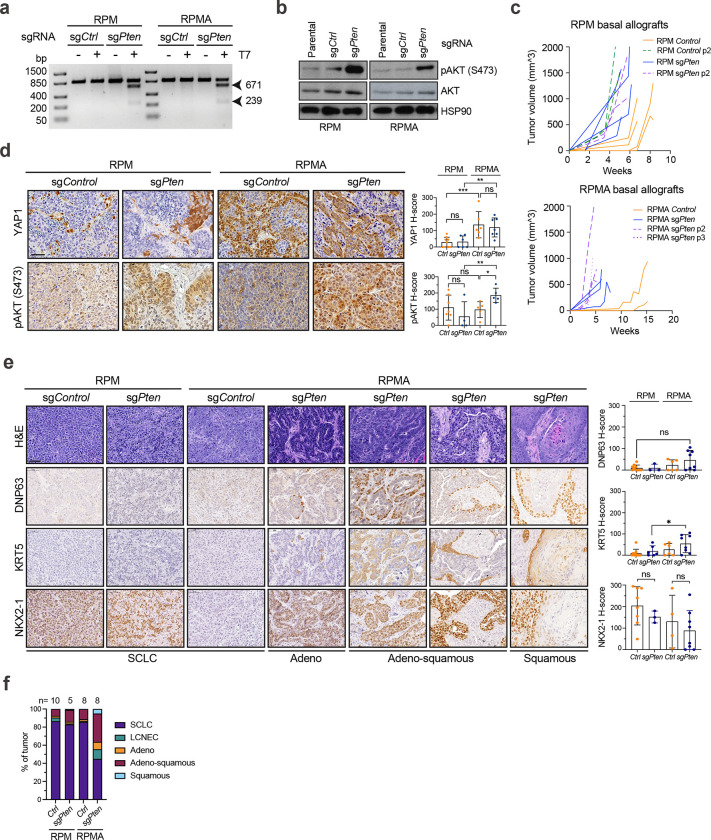
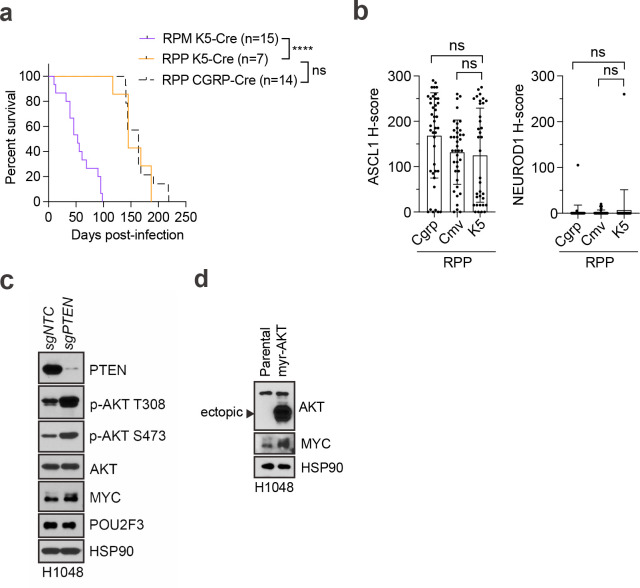
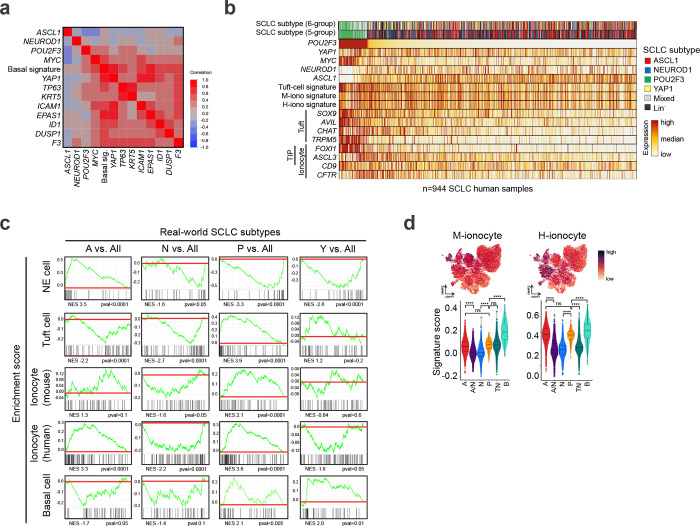
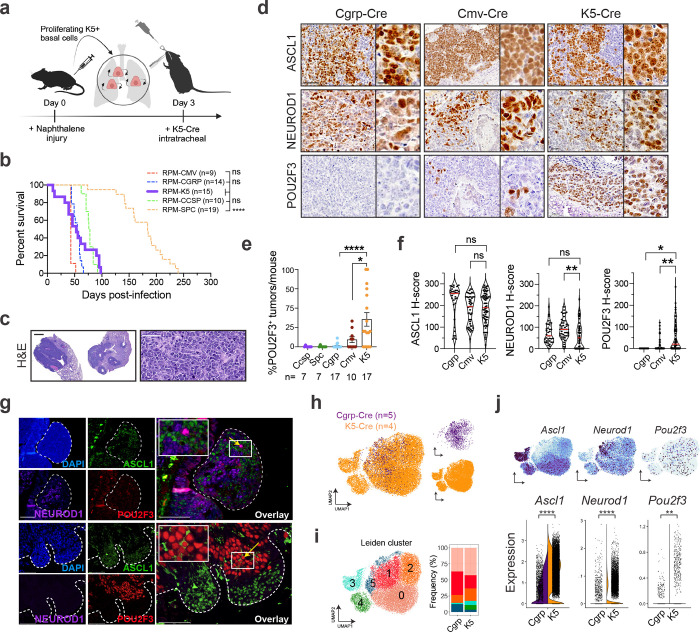
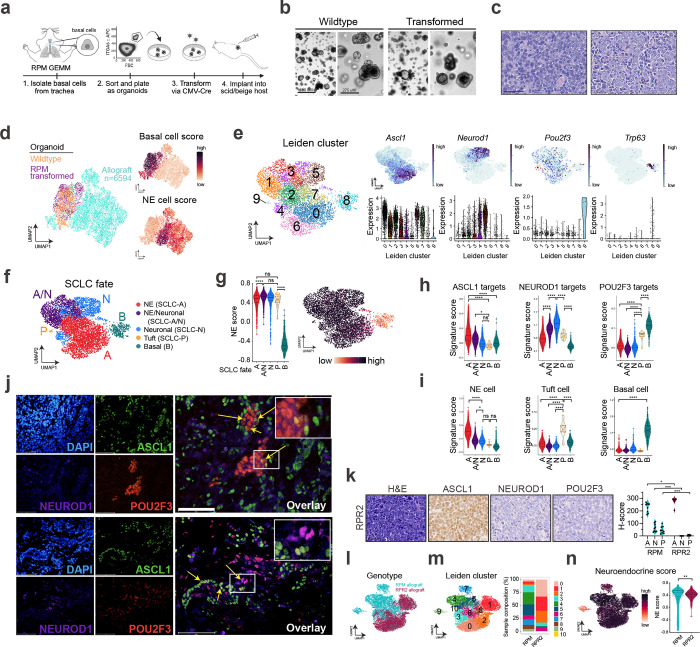
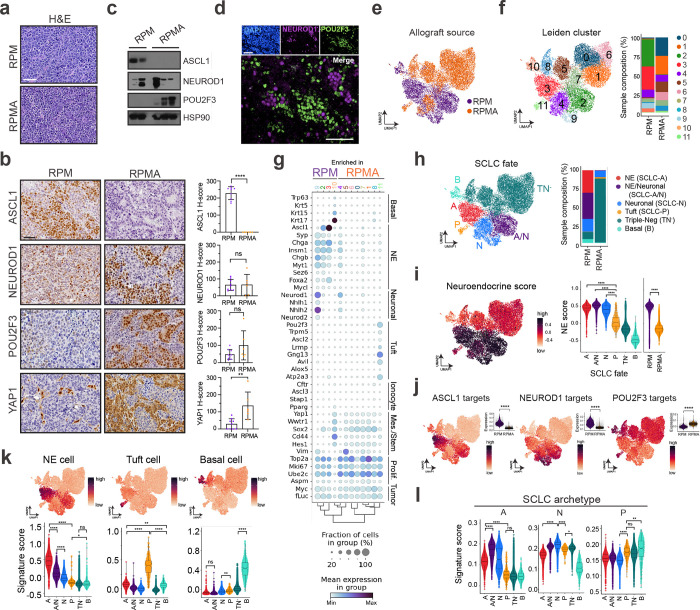
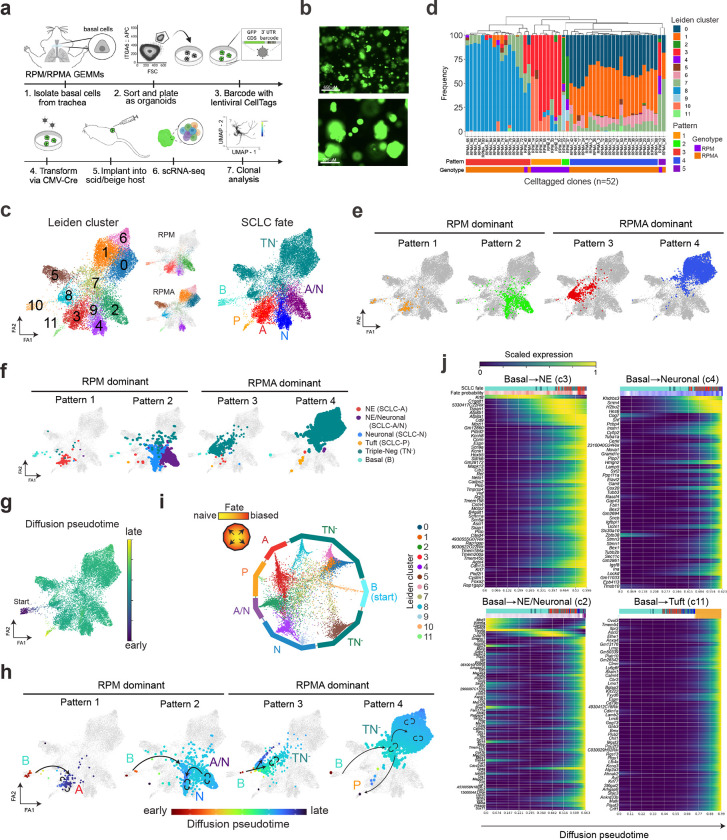
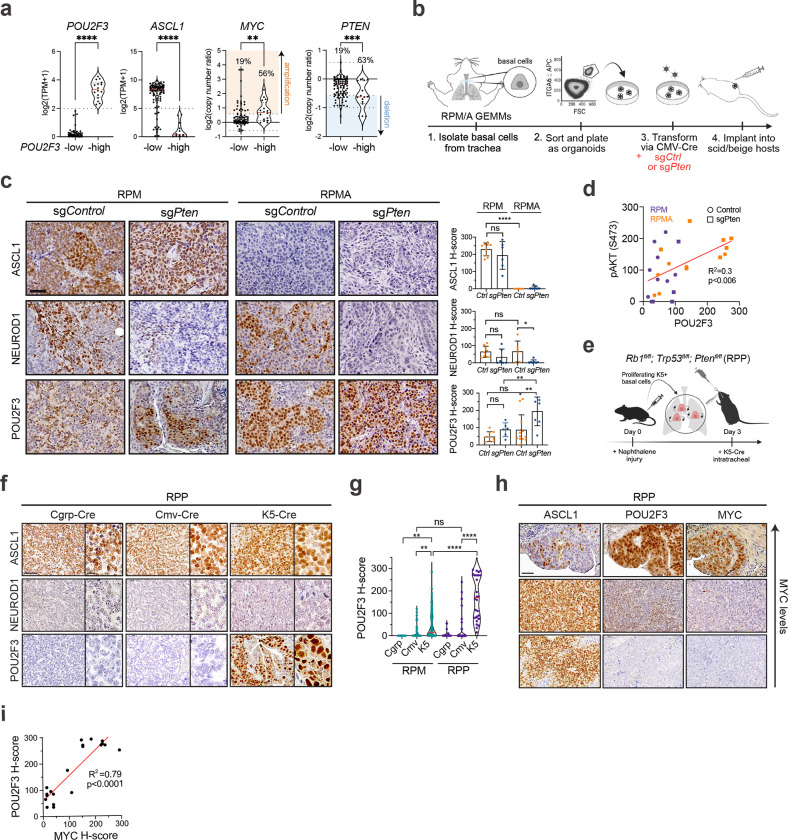
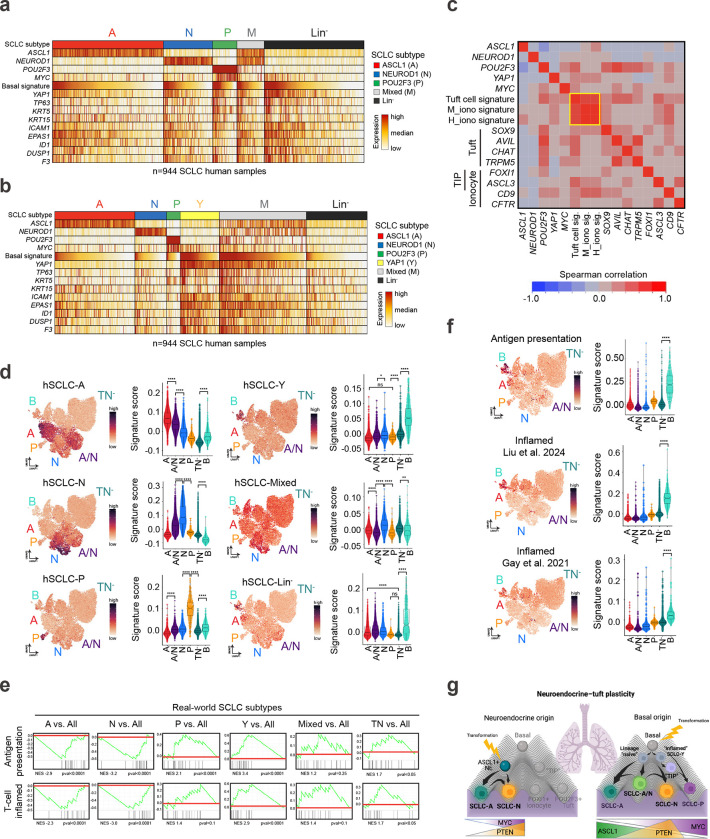
Neuroendocrine and tuft cells are rare, chemosensory epithelial lineages defined by expression of ASCL1 and POU2F3 transcription factors, respectively1,2. Neuroendocrine cancers, including small cell lung cancer (SCLC), frequently display tuft-like subsets, a feature linked to poor patient outcomes3-13. The mechanisms driving neuroendocrine-tuft tumour heterogeneity, and the origins of tuft-like cancers are unknown. Using multiple genetically-engineered animal models of SCLC, we demonstrate that a basal cell of origin (but not the accepted neuroendocrine origin) generates neuroendocrine-tuft-like tumours that highly recapitulate human SCLC. Single-cell clonal analyses of basal-derived SCLC further uncovers unexpected transcriptional states and lineage trajectories underlying neuroendocrine-tuft plasticity. Uniquely in basal cells, introduction of genetic alterations enriched in human tuft-like SCLC, including high MYC, PTEN loss, and ASCL1 suppression, cooperate to promote tuft-like tumours. Transcriptomics of 944 human SCLCs reveal a basal-like subset and a tuft-ionocyte-like state that altogether demonstrate remarkable conservation between cancer states and normal basal cell injury response mechanisms14-18. Together, these data suggest that the basal cell is a plausible origin for SCLC and other neuroendocrine-tuft cancers that can explain neuroendocrine-tuft heterogeneity-offering new insights for targeting lineage plasticity.


Conflict of interest statement

Ethics declarations Competing interests: TGO has a patent related to SCLC subtypes, a sponsored research agreement with Auron Therapeutics, has consulted for Nuage Therapeutics, serves on the scientific advisory board (SAB) for Lung Cancer Research Foundation, and as a consulting editor for Cancer Research and Genes & Development. CMR has consulted regarding oncology drug development with AbbVie, Amgen, AstraZeneca, Boehringer Ingelheim, and Jazz, and receives licensing fees for DLL3-directed therapies. He serves on the scientific advisory boards of Auron Therapeutics, DISCO, Earli, and Harpoon Therapeutics. Supplementary information is available for this paper.

Figures

Extended Data Fig. 1:
Extended Data Fig. 1:. POU2F3+ tumours exhibit intratumoural subtype heterogeneity indicative of plasticity.
(a) Representative images from IHC staining on human SCLC biopsies for given markers. One row = one tumour. Scale bar=25 μm. (b) Venn diagram depicting number of human SCLC biopsies (n=119 total) staining positive for ASCL1, NEUROD1, POU2F3, or lacking all markers (“Subtype-Neg”). (c) Representative images from co-IF staining on human SCLC biopsies for DAPI (nuclei, blue), ASCL1 (yellow), NEUROD1 (purple) and POU2F3 (green). Individual channels (top) and an overlay without DAPI (bottom) are shown. Scale bars=50 μm (n=28 biopsies stained). (d) Representative images from co-IF staining on patient-derived-xenografts (PDX, n=2 distinct models) for DAPI (nuclei, blue), ASCL1 (green), NEUROD1 (purple) and POU2F3 (red). Individual channels (left) and an overlay without DAPI (right) are shown. Yellow arrows and insets (a-b) emphasize co-expressing cells (bottom). Scale bars=75 μm.
Extended Data Fig. 2:
Extended Data Fig. 2:. Basal cells give rise to SCLC with expansive subtype heterogeneity. Related to Fig. 1 and Supplementary Table 2.
(a) Representative IHC images from RPM K5-Cre tumours for KRT5. A Sox2LSL/LSL;Nkx2-1fl/fl;Lkb1fl/fl mouse lung squamous tumour is included as a positive control. (b) Representative IHC for YAP1 in RPM tumours initiated by indicated Ad-Cre viruses (left) and corresponding H-score quantification (right). Median (red bar) and upper and lower quartiles (dotted lines) indicated. One-way ANOVA with Tukey’s correction (e,f). *** p<0.0003, ** p<0.003. (c) Split violin plot depicting expression of SCLC archetype signatures per tumour cell by scRNA-seq in CGRP (purple, left) and K5 (orange, right) tumours in Fig. 1h. (d) Split violin plot depicting transcriptional signatures of human ASCL1, NEUROD1, or POU2F3+ tumours derived from scRNA-seq data or (e) expression of ASCL1, NEUROD1, and POU2F3 target gene signatures derived from ChIP-seq data,,,(Supplementary Table 2) by scRNA-seq for all cells in CGRP (purple, left) and K5 (orange, right) tumours. Each dot is one cell. (f) Split violin plot depicting NE score per tumour cell by scRNA-seq in CGRP (purple, left) and K5 (orange, right) tumours. All scale bars=50 μm. Unless otherwise noted, statistical tests are Student’s unpaired t-tests. **** p<0.0001, ** p<0.01, ns=not significant, p>0.05.
Extended Data Fig. 3:
Extended Data Fig. 3:. Basal-derived GEMM organoids maintain basal identity in vitro. Related to Figs. 2 and 3.
(a) Recombination PCR for RPM basal organoids for indicated alleles pre- and post-treatment with TAT-Cre recombinase or Ad-CMV-Cre at two concentrations (2.5e7 or 5e7 pfu). *Organoids subject to spinoculation with CMV-Cre virus. Red font indicates condition used for subsequent allografting. (b) Co-IF on basal organoids pre-treatment with Cre (No Cre) or following recombination (RPM, RPR2, RPMA) for DAPI (nuclei, blue), KI67 (proliferation, orange), and ASCL1 (NE cell, green). Positive controls for KI67 and ASCL1 (bottom panel) is an RPR2 SCLC lung tumour. Quantification via CellProfiler of KI67 positivity per organoid from indicated conditions (right). Number of organoids quantified per group is labeled. One-way ANOVA with Tukey’s correction. *** p<0.003, ** p<0.005, ns=not significant, p>0.05. Error bars represent mean ± SD. (c) Co-IF on basal organoids pre-treatment with Cre (No Cre) or following recombination (RPM, RPR2, RPMA): Left) DAPI (nuclei, blue), NEUROD1 (neuronal cell, green), DNP63 (basal cell, yellow) and KRT8 (luminal basal cell, red). Positive control (+) for NEUROD1 is an RPM olfactory neuroblastoma tumour and for basal markers is an SNL GEMM lung tumour. Right) DAPI (nuclei, blue), FOXJ1 (ciliated cell, purple), CCSP (SCGB1A1, club cell, green) and KRT8 (luminal basal cell, red). Positive control (+) control for FOXJ1 and CCSP is airway from a normal mouse lung, and for KRT8 is an SNL GEMM lung tumour. (d) Co-IF on basal organoids pre-treatment with Cre (No Cre) or following recombination (RPM, RPR2, RPMA) for DAPI (nuclei, blue) and POU2F3 (tuft cell, green). Positive control (+) is an RPMA olfactory neuroblastoma tumour. All co-IF scale bars=150 μm.
Extended Data Fig. 4:
Extended Data Fig. 4:. Basal-derived GEMM organoids give rise to neuroendocrine, neuronal, and tuft-like SCLC in vivo. Related to Fig. 2 and Supplementary Tables 1 and 2.
(a) UMAP of scRNA-seq data from wildtype (orange) and transformed (purple) RPM basal organoids (left) and annotated by Leiden cluster (right) (Supplementary Table 1). (b) Dot plot expression of genes marking major lung cell types, stem-like, proliferative, and tumour cells for wildtype versus transformed RPM organoids, grouped by Leiden cluster as assigned in (a). Colour indicates level of gene expression and dot size represents frequency of expression per cluster. (c) UMAP of RPM organoids pre- and post-CMV-Cre coloured by cell cycle phase. (d) UMAP as in Fig. 2d of RPM organoids pre- and post-CMV-Cre and RPM basal allograft tumour coloured by cell cycle phase (left). Proportion of cells from WT and transformed (RPM) organoid samples and RPM allograft tumour in each phase, represented as % of all cells per sample (right). (e) Dot plot expression of genes marking indicated cell types, stem-like, proliferative, and tumour cells for RPM basal allograft tumour by Leiden cluster derived from scRNA-seq in Fig. 2e. (f) Violin plot expression of SCLC archetype signatures in RPM basal allograft tumour cells by scRNA-seq as in Fig. 2e, grouped by Leiden cluster. (g) Recombination PCR for RPR2 basal organoids for indicated alleles pre- and post-treatment with TAT-Cre recombinase or Ad-CMV-Cre at two concentrations (2.5e7 or 5e7 pfu). *Organoids subject to spinoculation with CMV-Cre virus. Red font indicates condition used for subsequent allografting. (h) UMAP and corresponding violin plots depicting expression of indicated SCLC subtype markers and Myc-family oncogenes in RPM versus RPR2 basal organoid allografts from Fig. 2l. (i) Violin plot expression of SCLC subtype archetype signatures or (j) ChIP target genes signatures (Supplementary Table 2) per tumour cell in RPM vs RPR2 basal allograft tumour samples from scRNA-seq data in Fig. 2l. A=ASCL1, N=NEUROD1, and P=POU2F3. Unless otherwise noted, statistical tests are Student’s unpaired t-test. **** p<0.0001.
Extended Data Fig. 5:
Extended Data Fig. 5:. ASCL1 loss promotes POU2F3+ tuft-like SCLC. Related to Fig. 3 and Supplementary Table 3.
(a) Recombination PCR for RPMA basal organoids for indicated alleles pre- (None) and post-treatment with TAT-Cre recombinase or Ad-CMV-Cre at two concentrations (2.5e7 or 5e7 pfu). *Organoids subject to spinoculation with CMV-Cre virus. Red font indicates condition used for subsequent allografting. (b) Quantification of tumour volume (mm^3) over time (weeks) in RPM (purple) vs RPMA (orange) basal allografts. Number of tumours quantified are indicated in legend. No suffix=Passage 1 (solid line), p2= Passage 2 (dashed line), p3 = Passage 3 (dotted line). Red “X” indicates censored animals due to early tumour ulceration. (c) Violin plot expression of SCLC subtype genes in RPM vs RPMA basal allograft tumours from scRNA-seq data in Fig. 3e. Each dot is one cell. (d) Representative IHC images from RPM and RPMA basal-organoid-derived tumours for indicated markers (left). H-score quantification of IHC for indicated proteins (right). Each dot represents one tumour. For each marker, n=3–9 tumours quantified. Scale bars=50 μm. (e) FeaturePlots depicting expression of indicated SCLC subtype genes in RPM and RPMA basal allograft tumours from scRNA-seq data in Fig. 3e (top) and corresponding violin plots depicting gene expression per Leiden cluster assigned in Fig. 3f. (f) FeaturePlots depicting expression of indicated NE, Neuronal, Mesenchymal/Stem, Tuft, Ionocyte, Tuft-Ionocyte-Progenitor (TIP), and Basal markers in UMAP of RPM and RPMA basal-derived allograft tumours from scRNA-seq data depicted in Fig. 3e. For relevant plots, statistical tests are Student’s unpaired t-test **** p<0.0001, ** p<0.01, ns=not significant, p>0.05. Error bars represent mean ± SD.
Extended Data Fig. 6:
Extended Data Fig. 6:. Lineage-tracing reveal distinct SCLC evolutionary trajectories. Related to Fig. 4 and Supplementary Tables 4 and 5.
(a) Alluvial bar plots depicting number and frequency of CellTag clones captured in RPM and RPMA organoids and resulting allograft tumours. Plots are shown for all clones per genotype (left) as well as only clones shared/captured across both conditions by scRNA-seq (right). Number of clones annotated on figure. (b) Projection of individual CellTag clones from RPM basal allograft tumours projected in FA map from Fig. 4c. Dashed circle indicates cells in the Tuft or SCLC-P state in clones. See Supplementary Table 4. (c) Projection of individual CellTag clones from RPMA basal allograft tumours projected in FA map from Fig. 4c. Dashed circle indicates cells in the Tuft or SCLC-P state in clones. See Supplementary Table 4. (d) UMAP of RPM and RPMA basal allograft tumour cells as in Fig. 4c coloured by expression of SCLC subtype marker genes. (e) FA map annotated by Leiden cluster of RPM and RPMA basal allograft tumour cells from Fig. 4c (left) with corresponding CellRank-predicted terminal states (middle) and assigned SCLC cell fate as in Fig. 4c, with added annotations defining phenotypic variation within TN clusters (right). Predicted CellRank trajectories all had an assigned start of Cluster 10, the cluster most enriched for Basal markers. (f) CellRank trajectory-specific expression trends of putative driver genes (Supplementary Table 5), predicted by fitting gene expression and pseudotime coordinates with Generalized Additive Models (GAMs).
Extended Data Fig. 7:
Extended Data Fig. 7:. PTEN loss promotes POU2F3 in basal-derived SCLC. Related to Fig. 5.
(a) T7 endonuclease genome mismatch assay on transformed RPM and RPMA basal organoids after lentiviral infection of LCV2 with non-targeting (sgCtrl) or Pten-targeting sgRNAs. Expected products of T7 endonuclease digestion with successful editing are 671 and 239 bp. (b) Immunoblot of pAKT (Ser473) and total AKT with HSP90 as a loading control on transformed RPM and RPMA basal organoids after infection with sgCtrl or Pten-targeting sgRNAs. (c) Quantification of tumour volume (mm^3) over time (weeks) in RPM (left) and RPMA (right) sgCtrl (passage 1=orange, solid; passage 2=green, dashed), and sgPten (passage 1=blue, solid; passage 2=purple, dashed, passage 3=purple, dotted), basal organoid allografts. (d) Representative IHC images from RPM and RPMA basal-organoid-derived parental or LCV2-sgCtrl tumours compared to tumours with LCV2-sgPten for indicated markers (left). H-score quantification of IHC for indicated proteins. Each dot represents one tumour. For each genotype, n=3–4 parental, n=2–6 sgCtrl, and n=6–9 sgPten tumours were quantified. Parental and sgCtrl tumours are grouped in the same category labeled as Ctrl. (e) Representative H&E and IHC for diagnostic markers on RPM and RPMA sgCtrl and sgPten tumours with SCLC histopathology versus regions of adenocarcinoma (Adeno), adeno-squamous carcinoma (Adeno-squamous), and Squamous carcinoma differentiation. Corresponding H-score quantification on right. For each genotype, n=3–4 parental, n=2–6 sgCtrl, and n=3–8 sgPten tumours were quantified. Parental and sgCtrl tumours are grouped in the same category labeled as Ctrl. (f) Stacked bar chart depicting average proportions of indicated histopathologies within individual RPM and RPMA control or Pten-deleted tumours. Number of tumours analyzed and represented by the average values indicated above stacked bars. Histopathologies determined via analysis of H&E and NKX2–1, P63, KRT5, and SCLC subtype marker staining. LCNEC is large-cell neuroendocrine carcinoma. All scale bars=50 μm. All statistical tests are two-way ANOVA. *** p<0.0008, ** p<0.007, * p<0.04, ns=not significant, p>0.05. Error bars represent mean ± SD.
Extended Data Fig. 8:
Extended Data Fig. 8:. PTEN loss and MYC cooperate to drive POU2F3+ SCLC. Related to Fig. 5.
(a) Survival of RPP mice infected with K5-Cre or Cgrp-Cre compared to RPM mice infected with K5-Cre. Dashed line indicates historical data. Number of mice indicated in the figure. Mantel-Cox log-rank test; **** p<0.0001, ns=not significant, p >0.05. (b) H-score quantification of ASCL1 and NEUROD1 in RPP GEMM tumours initiated by indicated Ad-Cre viruses. Each dot is one tumour. N=35–40 tumours from n=5–8 mice per cohort. One-way ANOVA with Tukey’s correction. ns=not significant, p>0.05. (c) Immunoblot analysis of human SCLC cell line, H1048, for indicated markers after LentiCRISPRv2 infection with non-targeting (sgNTC) or sgPTEN sgRNAs. (d) Immunoblot analysis of H1048 for indicated markers in parental cells versus cells with ectopic myristoylated-AKT (myrAKT) with HSP90 as a loading control.
Extended Data Fig. 9:
Extended Data Fig. 9:. Human SCLC harbours a basal-like subset. Related to Fig. 6 and Supplementary Table 2.
(a) Spearman correlation matrix depicting individual gene or gene signature correlations by bulk RNA-seq in n=944 human SCLC biopsies. Data include subtype markers, MYC, YAP1, and key basal state markers. (b) Heatmap displays expression by bulk RNA-seq of normal tuft, ionocyte, and tuft-ionocyte-progenitor (“TIP”) markers or gene signatures in n=944 human SCLC biopsies, sorted left to right by expression of POU2F3. Samples are annotated by classified SCLC subtypes (including the 5-group and 6-group classification schemes). (c) Gene set enrichment analysis (GSEA) depicting enrichment of normal neuroendocrine (NE), tuft, basal, and ionocyte cell signatures (Supplementary Table 2) in each human SCLC subtype in the real-world bulk RNA-seq dataset. Normalized enrichment score (NES) and p-values are indicated. (d) Expression of ionocyte signatures derived from mouse (M) or human (H) scRNA-seq studies applied to RPM and RPMA basal allograft tumour cells from Fig. 3e in UMAP space (top) or per assigned SCLC fate in the form of a violin plot (bottom). Box-whisker overlays on violin plots indicate median and upper and lower quartile. One-way ANOVA with Tukey’s correction. **** p<0.0001, ns=not significant, p>0.05.
Fig. 1:
Fig. 1:. Basal cells give rise to SCLC with expansive subtype heterogeneity. See also Extended Data Fig. 2 and Supplementary Tables 1 and 2.
(a) Schematic depicting method to induce SCLC from basal cells in the RPM GEMM. (b) Survival of RPM mice infected with indicated cell type-specific Ad-Cre viruses. Number of mice indicated in the figure. Dashed lines indicate historical data. Mantel-Cox log-rank test comparing each cohort to K5-Cre (purple); **** p<0.0001; ns=not significant, p>0.05. (c) Hematoxylin and eosin (H&E) staining of RPM K5-Cre tumours. Representative whole lung lobes (left) and individual tumour morphology (right) depicted. Scale bars=1 mm (left) or 50 μm (right). (d) Representative IHC images from RPM tumours initiated by indicated Ad-Cre viruses for ASCL1, NEUROD1, and/or POU2F3. Scale bars=50 μm for main images, 10 μm for high magnification insets. (e) Quantification of number of POU2F3+ tumours (H-score >50) vs total tumour number per lung per mouse for indicated cell-type-specific or CMV-Cre adenoviruses. Each dot represents lungs of one mouse. Number of mice indicated in the figure. Error bars represent mean ± SEM. (f) H-score quantification of IHC on K5-Cre RPM tumours vs other cells of origin for indicated proteins. Each dot represents one tumour. For each marker, n=11–101 tumours quantified from n=4–19 mice per Ad-Cre group. Median (red bar) and upper and lower quartiles (dotted line) are indicated. (g) Representative co-immunofluorescent (co-IF) staining for DAPI (nuclei, blue), ASCL1 (green), NEUROD1 (purple), and POU2F3 (red) in RPM K5-Cre tumours. Tumour regions outlined with dashed line. High magnification insets of co-expressing cells (yellow arrows) are in the upper left corner of overlays. Scale bars=75 μm. (h) UMAP of scRNA-seq data from n=5 tumours initiated from NE cells (Cgrp-Cre, purple) from n=5 RPM mice, or n=4 tumours initiated from basal cells (K5-Cre, orange) from n=2 RPM mice. Cells coloured by sample in the same UMAP on right. (i) UMAP in (h) annotated by Leiden cluster (left) (Supplementary Table 1). Proportion of cells in Cgrp vs K5 tumours per Leiden cluster, represented as % of all cells per sample (right). (j) FeaturePlots depicting expression of indicated genes in UMAP, as in (h) (top). Split violin plot depicting mRNA expression of indicated genes by scRNA-seq for all cells in Cgrp (purple, left) and K5 (orange, right) tumours (bottom). Each dot is one cell. Student’s unpaired t-tests. **** p<0.0001, *** p<0.001, ** p<0.01, * p<0.05, ns=not significant, p>0.05. Unless otherwise noted, statistical tests are one-way ANOVA with Tukey’s correction (e,f). **** p<0.0001, ** p<0.006, * p<0.02, ns=not significant, p>0.05.
Fig. 2:
Fig. 2:. Basal-derived GEMM organoids give rise to neuroendocrine, neuronal, and tuft-like SCLC. See also Extended Data Figs. 3 and 4 and Supplementary Tables 1 and 2.
(a) Schematic depicting isolation, growth and transformation of basal cell-derived organoids from RPM mice followed by implantation into the flanks of scid/beige hosts. (b) Representative brightfield images of basal organoids pre- (wildtype) and post- (transformed) CMV-Cre. Scale bars=650 μm (left, low mag) or 275 μm (right, high mag). (c) Representative H&E staining of RPM basal-organoid-derived tumours isolated from scid/beige mouse flanks with more classic (left) or variant (right) histopathology. Scale bar=50 μm. (d) UMAP of scRNA-seq data from wildtype (orange) and transformed (purple) RPM basal organoids, plus basal-organoid-derived RPM allograft tumour cells (turquoise). Allograft sample includes n=5 distinct RPM basal allograft tumours. FeaturePlots depicting expression of gene signatures derived from normal basal versus NE cells (right) (Supplementary Table 2). (e) UMAP of scRNA-seq data from RPM allograft tumours only, annotated by Leiden cluster (left) (Supplementary Table 1), FeaturePlot expression of indicated genes (top, right), and corresponding violin plot expression of indicated genes per Leiden cluster (bottom, right). Red dashed circle outlines Cluster 9 enriched for Pou2f3. (f) UMAP in (e) annotated by SCLC fate. Fates assigned based on enriched cell fate marker gene expression per Leiden cluster. (g) Violin plot of NE score per cell grouped by SCLC fate (left) from data in (f). UMAP of scRNA-seq data in (e) coloured by NE score (right). (h) Violin plot depicting ASCL1, NEUROD1, and POU2F3 ChIP target gene enrichment,,, (Supplementary Table 2) in tumour cells from (e), grouped by SCLC fate assignment. (i) Violin plot depicting gene set enrichment of normal NE, tuft, and basal cells (Supplementary Table 2) in tumour cells from (e), grouped by SCLC fate assignment. (j) Representative co-immunofluorescent (co-IF) staining for DAPI (nuclei, blue), ASCL1 (green), NEUROD1 (purple), and POU2F3 (red) in RPM basal allograft tumours. High magnification insets of co-expressing cells (yellow arrows) are in the upper right corner of overlays. Scale bars=75 μm. (k) Representative IHC of RPR2 basal-derived allograft tumours for H&E and indicated SCLC subtype markers (left) with corresponding H-score quantification for ASCL1 (A), NEUROD1 (N) or POU2F3 (P) compared to RPM basal allograft tumours (right). Scale bar=50 μm. Mann-Whitney two-tailed t-test. * p<0.02, *** p<0.0005. (l) UMAP of scRNA-seq data from basal-organoid-derived RPM (turquoise, n=5 tumours) and RPR2 (maroon, n=1) allograft tumour cells. (m) UMAP in (l) annotated by Leiden cluster (Supplementary Table 1) (left). Proportion of cells from RPM vs RPR2 allograft tumours in each Leiden cluster, represented as % of all cells per sample (right). (n) UMAP of scRNA-seq data in (l) coloured by NE score (left). Violin plot of NE score per cell in RPM vs RPR2 basal allograft tumour cells (right). Student’s unpaired t-test. ** p<0.01. Box-whisker overlays on all violin plots indicate median and upper and lower quartile. Unless otherwise indicated, statistical tests are one-way ANOVA with Tukey’s correction. **** p<0.0001, * p<0.03, ns=not significant, p>0.05.
Fig. 3:
Fig. 3:. ASCL1 loss promotes POU2F3+ tuft-like SCLC. See also Extended Data Figs. 3 and 5 and Supplementary Tables 1 and 3.
(a) Representative H&E staining of RPM (top) and RPMA (bottom) basal-organoid-derived tumours isolated from scid/beige mouse flanks. Scale bar=50 μm. (b) Representative IHC images from RPM and RPMA basal-organoid-derived tumours for indicated markers (left). H-score IHC quantification for indicated proteins (right). Each dot represents one tumour. For each marker, n=6–9 tumours quantified. Scale bars=50 μm. Student’s unpaired t-tests. **** p<0.0001, ** p<0.01, ns=not significant, p>0.05. Error bars represent mean ± SD. (c) Immunoblot depicting expression of indicated markers in RPM (n=2) vs RPMA (n=3) basal allograft tumours with HSP90 as a loading control. (d) Representative co-IF staining for DAPI (nuclei, blue), NEUROD1 (purple), and POU2F3 (green) in RPMA basal allograft tumours. Scale bars=75 μm. (e) UMAP of scRNA-seq data from basal-organoid-derived RPM (purple, n=5) and RPMA (orange, n=3) allograft tumours. (f) UMAP in (e) annotated by Leiden cluster (left). Proportion of cells from RPM vs RPMA allograft tumours in each Leiden cluster (Supplementary Table 3), represented as a % of all cells per sample (right). (g) Dot plot expression of genes marking indicated cell fates, stem-like, proliferative, and tumour cells for RPM and RPMA basal-derived allograft tumour cells, grouped by Leiden cluster as assigned in (f). Colour indicates level of gene expression and dot size represents frequency of expression per cluster. Genotypes indicate enrichment but not exclusive expression of each cluster. (h) UMAP of scRNA-seq data in (e) coloured by SCLC fate (left). Fates assigned based on enriched fate marker gene expression per Leiden cluster. Proportion of cells from RPM and RPMA allograft tumour samples in each fate, represented as % of all cells per sample (right). (i) UMAP of scRNA-seq data in (e) coloured by NE score according to legend (left). Violin plot of NE score per cell grouped by SCLC fate or genotype as indicated on the x-axis (right). (j) UMAP of scRNA-seq data in (e) coloured by ASCL1, NEUROD1, and POU2F3 ChIP target gene scores,,, (Supplementary Table 2) where red/dark purple is high and orange is low. Upper right insets are violin plots depicting expression of target gene scores, grouped by genotype. Student’s unpaired t-tests. **** p<0.0001. (k) UMAPs (top) and violin plots (bottom) depicting gene set enrichment of normal NE, tuft, and basal cells (Supplementary Table 2) in tumour cells from (h), grouped by fate assignment. (l) Violin plot expression of SCLC subtype archetype signatures (Supplementary Table 2) per tumour cell in RPM vs RPMA basal allograft tumour samples from data in (h), grouped by SCLC fate. A=ASCL1, N=NEUROD1, and P=POU2F3. Box-whisker overlays on all violin plots indicate median and upper and lower quartile. Unless otherwise indicated, statistical tests are one-way ANOVA with Tukey’s correction. **** p<0.0001, ** p<0.001, * p<0.01, ns=not significant, p>0.05.
Fig. 4:
Fig. 4:. Lineage-tracing reveal distinct SCLC evolutionary trajectories. See also Extended Data Fig. 6 and Supplementary Tables 3–5.
(a) Schematic depicting generation of CellTagged, basal RPM and RPMA organoids and allografts. (b) Representative fluorescent images of transformed and CellTagged RPM organoids (GFP coding sequence is included in the 3’ UTR of the CellTag library). Scale bars=650 (top) and 275 (bottom) μm. (c) ForceAtlas2 (FA) map of RPM and RPMA basal allograft tumours annotated by Leiden cluster (as in Fig. 3f and Supplementary Table 3) (left) and split by genotype (middle). FA map of tumour cells coloured by assigned SCLC fate (as in Fig. 3h) (right). (d) Frequency of cells per Leiden cluster in each CellTag clone (one clone = one bar). Unbiased hierarchical clustering on Leiden cluster occupancy of all clones reveals four major patterns (Pattern 1–4) and one minor pattern (Pattern 5), labeled on the x-axis. Genotype and unique number of each clone indicated on x-axis and matching clone numbers in Extended Data Fig. 6b,c. (e) FA maps of major clonal Patterns according to assignment and colour in (d). Patterns dominated by RPM vs RPMA-derived clones are labeled. (f) FA maps as in (c) of RPM and RPMA basal allograft clonal dynamics grouped by clonal dynamic Pattern and annotated by corresponding SCLC fate. (g) FA map as in (c) coloured by diffusion pseudotime, implemented in Scanpy. Assigned pseudotime starting state was basal-enriched Cluster 10. (h) Clonal dynamic Patterns as in (e) but annotated by pseudotime assignment from (g). Arrows drawn on plots follow predicted pseudotime trajectories, with straight arrows indicating movement of cells across Leiden clusters and circular arrows indicating self-renewal/proliferation within that cell state or Leiden cluster. Fate assignments also annotated as in (c). (i) CellRank analysis of fate probabilities per cell in scRNA-seq data of RPM and RPMA basal allograft tumours from (c). Each dot represents a tumour cell, coloured by Leiden cluster. Cells are arranged inside the circle according to fate probability, with fate-biased cells placed next to their corresponding edge and naive cells located in the middle. Edges annotated by SCLC fate as in (c). (j) CellRank trajectory-specific expression trends of putative driver genes (Supplementary Table 5), predicted by fitting gene expression and pseudotime coordinates with Generalized Additive Models (GAMs).
Fig. 5:
Fig. 5:. PTEN loss and MYC cooperate to drive POU2F3+ basal-derived SCLC. See also Extended Data Figs. 7 and 8.
(a) mRNA expression of POU2F3 and ASCL1 as log2(TPM+1) and copy number data for MYC and PTEN as log2(copy number ratio) in n=112 human SCLC tumours grouped by POU2F3 status (n=96 POU2F3-low, n=16 POU2F3-high). Percent of tumours with MYC amplification (>log2(3/2)=0.58) and PTEN heterozygous (<log2(1/2)=−0.58) or deep deletion (< −1) indicated. Median (dashed red line) and upper and lower quartiles (dotted lines) are indicated. Student’s unpaired t-tests on gene expression data and Fisher’s exact tests on copy number data. **** p<0.0001, *** p<0.001, ** p<0.01. (b) Schematic depicting generation of RPM and RPMA basal organoids and allografts with loss of Pten. (c) Representative IHC images from RPM and RPMA basal-organoid-derived parental or LCV2-sgCtrl tumours compared to tumours with LCV2-sgPten for indicated markers (left). H-score IHC quantification for indicated proteins (right). Each dot represents one tumour. For each genotype, n=3–10 parental, n=2–6 sgCtrl, and n=6–9 sgPten tumours were quantified. Parental and sgCtrl tumours are grouped in the same category labeled as Ctrl. (d) Simple linear regression analysis of H-score quantification of phospho-AKT (pAKT S473) versus POU2F3 in RPM and RPMA parental and sgCtrl (Control) and sgPten basal allograft tumours, coloured by genotype (RPM=purple, RPMA=orange). Goodness of fit (R2) and p-value indicated. (e) Schematic depicting method to induce SCLC from basal cells in the Rb1fl/fl;Trp53fl/f;Ptenfl/fl (RPP) GEMM. (f) Representative IHC for SCLC subtype markers on RPP tumours initiated by indicated Ad-Cre viruses. Scale bar=10 μm on high-magnification inset. (g) Violin plot of H-score quantification of POU2F3 IHC in RPM versus RPP GEMM tumours initiated by indicated Ad-Cre viruses. Each dot equals one tumour. N=11–132 tumours quantified per Ad-Cre group per genotype from n=4–19 mice per condition. Median (red bar) and upper and lower quartiles (solid line) are indicated. (h) Representative IHC images on serial sections of RPP K5-Cre tumours for indicated markers on MYC-high, -medium, and -low regions (Y-axis). (i) Simple linear regression analysis of H-score quantification of MYC versus POU2F3 IHC in RPP K5-Cre tumours. N=21 tumours quantified from n=4 mice. Goodness of fit (R2) and p-value indicated. All scale bars=50 μm unless otherwise noted. Unless otherwise noted, statistical tests are two-way ANOVA. **** p<0.0001, ** p<0.009, * p<0.02, ns=not significant p>0.05. Error bars represent mean ± SD.
Fig 6:
Fig 6:. Human SCLC harbours basal-like subset. See also Extended Data Fig. 9 and Supplementary Tables 2 and 6.
(a) Heatmap displays expression by bulk RNA-seq of lineage-related transcription factors, a basal cell signature, and basal markers in n=944 human SCLC biopsies, grouped and annotated by subtype. (b) Heatmap as in Fig. 6a with expression by bulk RNA-seq of lineage-related transcription factors, a basal cell signature, and basal markers, grouped and annotated by subtype including a YAP1 subtype. (c) Spearman correlation matrix depicting individual gene or gene signature correlations by bulk RNA-seq in n=944 human SCLC biopsies (Supplementary Table 2). Data include subtype markers, MYC, and annotated Tuft, tuft-ionocyte-progenitor (“TIP”), and ionocyte markers. Yellow box indicates tuft and ionocyte signatures with the strongest correlations. (d) Expression of human subtype signatures (hSCLC-A, -N, -P, -Y, -Mixed, -TF) derived from the real-world bulk RNA-seq dataset applied to RPM and RPMA basal allograft tumour cells from Fig. 3e in UMAP space (left) or per assigned SCLC fate in the form of a violin plot (right) (Supplementary Table 6). (e) GSEA for established Antigen presentation and T-cell inflamed signatures in human real-world subtypes as indicated. (f) Antigen presentation or “Inflamed” SCLC tumour signatures derived from bulk RNA-seq and/or proteomics data on human SCLC tumours and applied to RPM and RPMA basal allograft tumour cells from Fig. 3e in UMAP space (left) or per assigned SCLC fate in the form of a violin plot (right) (Supplementary Table 6). (g) Graphical abstract depicting SCLC fate trajectories possible from a neuroendocrine (left) vs basal (right) cell of origin. Thickness of arrows indicates frequency that trajectories are likely to occur in the RPM GEMM. MYC, PTEN, and ASCL1 levels vary with fate according to annotations below the Waddington landscapes. Box-whisker overlays on all violin plots indicate median and upper and lower quartile. One-way ANOVA with Tukey’s correction. **** p<0.0001, ** p<0.0004, * p<0.004, ns=not significant, p>0.05.

References

Main references:

    1. Schneider C., O’Leary C. E. & Locksley R. M. Regulation of immune responses by tuft cells. Nature Reviews Immunology 19, 584–593 (2019). 10.1038/s41577-019-0176-x - DOI - PMC - PubMed
    1. Gu X. et al. Chemosensory functions for pulmonary neuroendocrine cells. American journal of respiratory cell and molecular biology 50, 637–646 (2014). 10.1165/rcmb.2013-0199OC - DOI - PMC - PubMed
    1. Koh J. et al. Molecular Classification of Extrapulmonary Neuroendocrine Carcinomas With Emphasis on POU2F3-positive Tuft Cell Carcinoma. Am J Surg Pathol 47, 183–193 (2023). 10.1097/pas.0000000000001977 - DOI - PMC - PubMed
    1. Chen C. C. et al. Temporal evolution reveals bifurcated lineages in aggressive neuroendocrine small cell prostate cancer trans-differentiation. Cancer Cell 41, 2066–2082.e2069 (2023). 10.1016/j.ccell.2023.10.009 - DOI - PMC - PubMed
    1. Cejas P. et al. Subtype heterogeneity and epigenetic convergence in neuroendocrine prostate cancer. Nat Commun 12, 5775 (2021). 10.1038/s41467-021-26042-z - DOI - PMC - PubMed

Methods references:

    1. Caeser R. et al. Genomic and transcriptomic analysis of a library of small cell lung cancer patient-derived xenografts. Nat Commun 13, 2144 (2022). 10.1038/s41467-022-29794-4 - DOI - PMC - PubMed
    1. Hong K. U., Reynolds S. D., Giangreco A., Hurley C. M. & Stripp B. R. Clara cell secretory protein–expressing cells of the airway neuroepithelial body microenvironment include a label-retaining subset and are critical for epithelial renewal after progenitor cell depletion. American journal of respiratory cell and molecular biology 24, 671–681 (2001). 10.1165/ajrcmb.24.6.4498 - DOI - PubMed
    1. Hsu H.-S. et al. Repair of naphthalene-induced acute tracheal injury by basal cells depends on β-catenin. The Journal of Thoracic and Cardiovascular Surgery 148, 322–332 (2014). 10.1016/j.jtcvs.2013.10.039 - DOI - PubMed
    1. DuPage M., Dooley A. L. & Jacks T. Conditional mouse lung cancer models using adenoviral or lentiviral delivery of Cre recombinase. Nat Protoc 4, 1064–1072 (2009). 10.1038/nprot.2009.95 - DOI - PMC - PubMed
    1. Flowers J. L. et al. Use of monoclonal antiestrogen receptor antibody to evaluate estrogen receptor content in fine needle aspiration breast biopsies. Ann Surg 203, 250–254 (1986). 10.1097/00000658-198603000-00005 - DOI - PMC - PubMed

Publication types