[Preprint]. 2024 Nov 15:2024.11.14.623612.
doi: 10.1101/2024.11.14.623612.

Leveraging chromatin packing domains to target chemoevasion in vivo

Affiliations

Leveraging chromatin packing domains to target chemoevasion in vivo

Jane Frederick et al. bioRxiv. .

Update in

  • Leveraging chromatin packing domains to target chemoevasion in vivo.
    Frederick J, Virk RKA, Ye IC, Almassalha LM, Wodarcyk GM, VanDerway D, Gong R, Dunton CL, Kuo T, Medina KI, Loxas M, Ahrendsen JT, Gursel DB, Gonzalez PC, Nap RJ, John S, Agrawal V, Anthony NM, Carinato J, Li WS, Kakkaramadam R, Jain S, Shahabi S, Ameer GA, Szleifer IG, Backman V. Frederick J, et al. Proc Natl Acad Sci U S A. 2025 Jul 29;122(30):e2425319122. doi: 10.1073/pnas.2425319122. Epub 2025 Jul 22. Proc Natl Acad Sci U S A. 2025. PMID: 40694328 Free PMC article.

Abstract

Cancer cells exhibit a remarkable resilience to cytotoxic stress, often adapting through transcriptional changes linked to alterations in chromatin structure. In several types of cancer, these adaptations involve epigenetic modifications and restructuring of topologically associating domains (TADs). However, the underlying principles by which chromatin architecture facilitates such adaptability across different cancers remain poorly understood. To investigate the role of chromatin in this process, we developed a physics-based mechanistic model that connects chromatin organization to cell fate decisions, specifically survival following chemotherapy. Our model builds on the observation that chromatin forms packing domains, which influence transcriptional efficiency through macromolecular crowding. The model accurately predicts chemoevasion in vitro, suggesting that changes in packing domains affect the likelihood of survival. Consistent results across diverse cancer types indicate that the model captures fundamental principles of chromatin-mediated adaptation, independent of the specific cancer or chemotherapy mechanisms involved. Based on these insights, we hypothesized that compounds capable of modulating packing domains, termed Transcriptional Plasticity Regulators (TPRs), could prevent cellular adaptation to chemotherapy. Using live-cell chromatin imaging, we conducted a compound screen that identified several TPRs which synergistically enhanced chemotherapy-induced cell death. The most effective TPR significantly improved therapeutic outcomes in a patient-derived xenograft (PDX) model of ovarian cancer. These findings underscore the central role of chromatin in cellular adaptation to cytotoxic stress and present a novel framework for enhancing cancer therapies, with broad potential across multiple cancer types.

Keywords: Biophysics; Cancer; Chemotherapy; Chromatin; Plasticity.


Figures
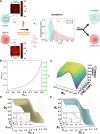
Fig. 1.
Fig. 1.
Linking chromatin to transcriptional plasticity and cell survival under cytotoxic stress using the Chromatin Dependent Adaptability (CDA) model. (A) Schematic illustrating the differential responses of cells with varying nuclear chromatin organization Dn to cytotoxic stress. PWS microscopy images show representative low and high Dn cells. The probability distribution function (PDF) of gene upregulation (x=N2/N1) is shown for both cell types, demonstrating increased mean and standard deviation of upregulated transcripts in high Dn cells, leading to a higher survival probability. (B) Quantitative relationship between Dn, transcriptional malleability (k, purple), and transcriptional heterogeneity (s, green) for cell b with fixed parameters ln(E/E)=0, βa=10, and t=7 hours. (C) 3D plot showing the effect of transcriptional reactant (TR) concentration and local crowding (ϕin) on the relative amount of mRNA produced. (D) Cell death probability (Θb) as a function of Dn for varying upregulation thresholds (xcrit) with fixed parameters ln(E/E)=-2, βa=10, and t=7 hours. Inset shows individual curves for select xcrit values. (E) Cell death probability (Θ) as a function of Dn for different transcriptional amplification levels βa with fixed parameters ln(E/E)=-2, xcrit=5, and t=7 hours. Inset displays individual curves for select βa values.
Fig. 2.
Fig. 2.
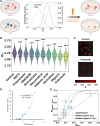
Chemotherapy induces alterations in chromatin across diverse cancer cell lines and treatment modalities. (A) Violin plots showing the distribution of Dn in HCT116 cells over a 48-hour treatment with 15 μM oxaliplatin. The control population remains stable, while treated cells show significantly higher Dn at 24 hours P<10-15 and 48 hours P<10-32). Sample sizes: n=70-150 cells per condition. (B) Scatter plot of changes in Dn in individual HCT116 cell clusters after 48 hours of oxaliplatin treatment. Points represent average Dn change per cluster vs. initial Dn at 0 hours (Dn,0). Initial cluster size ranged from 2 to 5 cells, while final size ranged from 1 to 12 cells. Error bars represent standard error of the mean. (C) Violin plots showing Dn distribution in surviving cells after 48-hour chemotherapy exposure across multiple cancer cell lines. Treatments include A2780, A2780.m248, MDA-MB-231 (vehicle, 5-fluorouracil, paclitaxel, oxaliplatin); HCT116 (vehicle, oxaliplatin); MES-SA, MES-SA/MX2 (vehicle, docetaxel, gemcitabine). Significance levels: *P<0.05, **P<0.01, ***P<0.001 (t-test against control, unpaired, unequal variance). (D) Representative PWS microscopy images of control and treated cells after 48-hour treatments: A2780 (0.5 μM 5-fluorouracil), A2780.m248 (5 nM paclitaxel), HCT116 (15 μM oxaliplatin), MDA-MB-231 (0.5 μM 5-fluorouracil), MES-SA (50 nM gemcitabine), and MES-SA/MX2 (5 nM docetaxel). Pseudocolor indicates that brighter red corresponds to higher Dpixel. Scale bars represent 15 μm.
Fig. 3.
Fig. 3.
Model predictions of population-level chromatin dynamics, cell survival, and chemotherapy efficacy over time closely match experimental results. (A) Probability density functions (PDFs) of Dn in a population of HCT116 cell clusters at 0 (purple), 24 (blue), and 48 (teal) hours after treatment with 15 μM oxaliplatin, showing a progressive shift toward higher Dn values over time. (B) Comparison of experimental data (blue) and model predictions (purple) showing the increase in mean Dn of oxaliplatin-treated HCT116 clusters over 48 hours. Error bars represent standard error of the mean for experimental data and propagated error for model predictions. (C) Cell death probability (Θ) as a function of Dn, with experimental data (blue points) derived from tracking HCT116 cell clusters over 48 hours of oxaliplatin treatment. The CDA model fit (purple line) to experimental data was optimized using three free parameters, resulting in a mean squared error (MSE) of 0.012. (D) Effective inhibition rate (EIR) per day, representing cumulative cell death from oxaliplatin treatment over 48 hours, as a function of mean cluster Dn. Both experimental data (blue points) and model predictions (purple line) are shown, with error bars derived from error propagation.
Fig. 4.
Fig. 4.
Transcriptional Plasticity Regulators (TPRs) modulate chromatin structure to enhance chemotherapeutic efficacy in vitro. (A) Schematic depicting differential survival in cancer cell populations with distinct Dn distributions under chemotherapy. Magenta and green curves represent control and TPR-treated populations, respectively. Dashed grey line indicates survival probability (1-Θ). (B) TPR candidate drug screen in live A2780 cells, showing Dn distributions for control and potential TPR treatments. Dashed red line denotes Dn threshold below which Θ>0.999. **P<0.01, ***P<0.001 (t-test against control, unpaired, unequal variance). (C) Representative PWS microscopy images of control and celecoxib-treated A2780 cells. Pseudocolor indicates Dn, with brighter red corresponding to higher values. Scale bars: 15 μm. (D) Correlation between TPR-induced chromatin change (TPR index) and increased cell death (inhibition index) upon combined chemotherapy and TPR treatment, showing that a reduction in Dn correlates with enhanced efficacy. The relationship follows y=2.0844e2.0107x, with R2=0.984. (E) Comparison of cell death in A2780 cells treated with paclitaxel alone (ΘPac) versus paclitaxel combined with celecoxib normalized by celecoxib alone (ΘCombo-Cele). Blue dots represent experimental data with error bars as standard error of the mean. Solid purple line indicates model prediction using exact equation (Eq. 11) with the parameters ln(E/E)-3, βa6, and mean squared error (MSE) = 0.031. Dashed purple line is the prediction using approximate equation (Eq. 12).
Fig. 5.
Fig. 5.
In vivo validation of TPR-enhanced chemotherapy efficacy using patient-derived xenograft (PDX) models of ovarian cancer. (A) Schematic illustrating the treatment regimen for ovarian PDX studies and predicted outcomes, highlighting expected tumor growth patterns under different treatment conditions over 30 days. (B) Growth curves of ovarian carcinoma PDX tumors under various treatments. Co-treatment with celecoxib (25 mg/kg) and paclitaxel (1.7 mg/kg) resulted in minimal growth over 30 days compared to monotherapy with paclitaxel (1.7 mg/kg), celecoxib (25 mg/kg), or vehicle (DMSO). Animals were treated orally with celecoxib and intraperitoneally with paclitaxel daily for one week. Points represent mean tumor volume normalized by the volume at day 0 ± standard error of the mean, while lines indicate linear regression fits. (C) Effective Inhibition Rate (EIR) for paclitaxel alone and the paclitaxel + celecoxib combination over time, calculated using vehicle as a reference for paclitaxel and celecoxib as a reference for the combination. EIR was calculated using the equation EIR=lnVt,control/V0,control-lnVt,treated/V0,treated/t. Points show mean EIR ± standard error of the mean, with lines representing linear regression fits. (D) Normalized tumor growth rate over time for paclitaxel alone and the paclitaxel + celecoxib combination. Points indicate experimental data (mean ± standard error of the mean). Solid lines show best fits using the adaptive inhibition model (Eq. 13).

References

    1. Aas Turid, Børresen Anne-Lise, Geisler Stephanie, Smith-Sørensen Birgitte, Johnsen Hilde, Varhaug Jan E., Akslen Lars A., and Lønning Per E.. Specific P53 mutations are associated with de novo resistance to doxorubicin in breast cancer patients. Nature Medicine, 2(7): 811–814, July 1996. ISSN 1546–170X. doi: 10.1038/nm0796-811. Number: 7 Publisher: Nature Publishing Group. - DOI - PubMed
    1. Lièvre Astrid, Bachet Jean-Baptiste, Le Corre Delphine, Boige Valérie, Landi Bruno, Emile Jean-François, Côté Jean-François, Tomasic Gorana, Penna Christophe, Ducreux Michel, Rougier Philippe, Penault-Llorca Frédérique, and Laurent-Puig Pierre. KRAS Mutation Status Is Predictive of Response to Cetuximab Therapy in Colorectal Cancer. Cancer Research, 66(8):3992–3995, April 2006. ISSN 0008–5472. doi: 10.1158/0008-5472. CAN-06-0191. - DOI - PubMed
    1. Sobhani Navid, Roviello Giandomenico, Corona Silvia P., Scaltriti Maurizio, Ianza Anna, Bortul Marina, Zanconati Fabrizio, and Generali Daniele. The prognostic value of PI3K mutational status in breast cancer: A meta-analysis. Journal of Cellular Biochemistry, 119(6):4287–4292, 2018. ISSN 1097–4644. doi: . _eprint: . - DOI - DOI - PMC - PubMed
    1. Martínez-Jiménez Francisco, Movasati Ali, Brunner Sascha Remy, Nguyen Luan, Priestley Peter, Cuppen Edwin, and Van Hoeck Arne. Pan-cancer whole-genome comparison of primary and metastatic solid tumours. Nature, pages 1–9, May 2023. ISSN 1476–4687. doi: 10.1038/s41586-023-06054-z. Publisher: Nature Publishing Group. - DOI - PMC - PubMed
    1. Gerstung Moritz, Jolly Clemency, Leshchiner Ignaty, Dentro Stefan C., Gonzalez Santiago, Rosebrock Daniel, Mitchell Thomas J., Rubanova Yulia, Anur Pavana, Yu Kaixian, Tarabichi Maxime, Deshwar Amit, Wintersinger Jeff, Kleinheinz Kortine, Vázquez-García Ignacio, Haase Kerstin, Jerman Lara, Sengupta Subhajit, Macintyre Geoff, Malikic Salem, Donmez Nilgun, Livitz Dimitri G., Cmero Marek, Demeulemeester Jonas, Schumacher Steven, Fan Yu, Yao Xiaotong, Lee Juhee, Schlesner Matthias, Boutros Paul C., Bowtell David D., Zhu Hongtu, Getz Gad, Imielinski Marcin, Beroukhim Rameen, Sahinalp S. Cenk, Ji Yuan, Peifer Martin, Markowetz Florian, Mustonen Ville, Yuan Ke, Wang Wenyi, Morris Quaid D., Spellman Paul T., Wedge David C., and Van Loo Peter. The evolutionary history of 2,658 cancers. Nature, 578(7793):122–128, February 2020. ISSN 1476–4687. doi: 10.1038/s41586-019-1907-7. Number: 7793 Publisher: Nature Publishing Group. - DOI - PMC - PubMed

Publication types

LinkOut - more resources