[Preprint]. 2024 Nov 11:2024.11.11.623014.
doi: 10.1101/2024.11.11.623014.

Single-cell spatial transcriptomics of fixed, paraffin-embedded biopsies reveals colitis-associated cell networks

Affiliations

Single-cell spatial transcriptomics of fixed, paraffin-embedded biopsies reveals colitis-associated cell networks

Elvira Mennillo et al. bioRxiv. .

Abstract

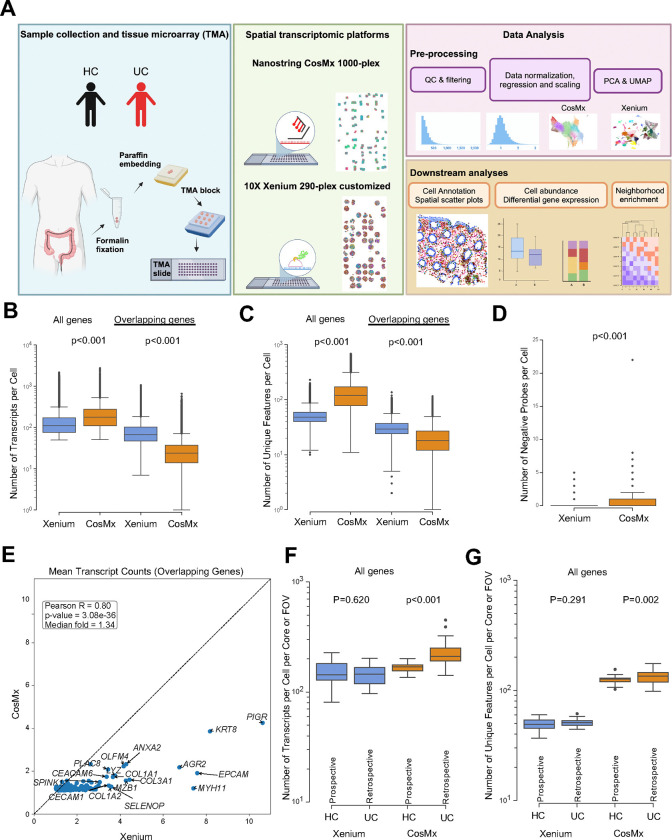
Background & aims: Imaging-based, single-cell spatial transcriptomics (iSCST) using formalin-fixed, paraffin-embedded (FFPE) tissue could transform translational research by retaining all tissue cell subsets and spatial locations while enabling the analysis of archived specimens. We aimed to develop a robust framework for applying iSCST to archived clinical FFPE mucosal biopsies from patients with inflammatory bowel disease (IBD).

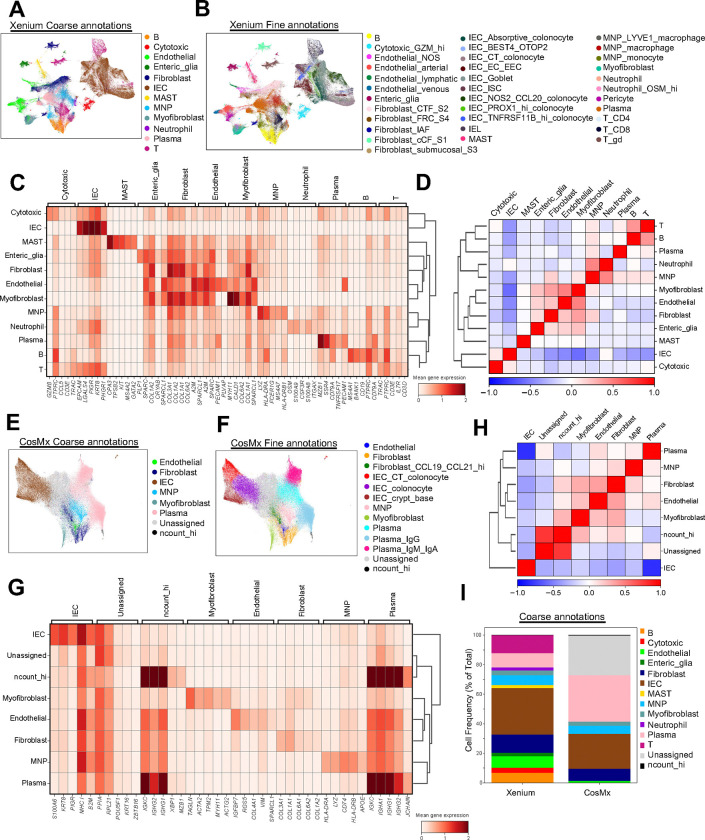
Methods: We performed a comprehensive benchmarking comparison of three iSCST platforms capable of analyzing FFPE specimens. We analyzed FFPE mucosal biopsies (n=57) up to 5 years old from non-IBD controls (HC; n=9) and patients with ulcerative colitis (UC;n=11). After platform-specific cell segmentation, we applied a uniform data processing pipeline to all datasets, including transcript detection, cell annotation, differential gene expression, and neighborhood enrichment. Transcriptomic signatures identified with iSCST were validated using external, publicly available bulk transcriptomic datasets.

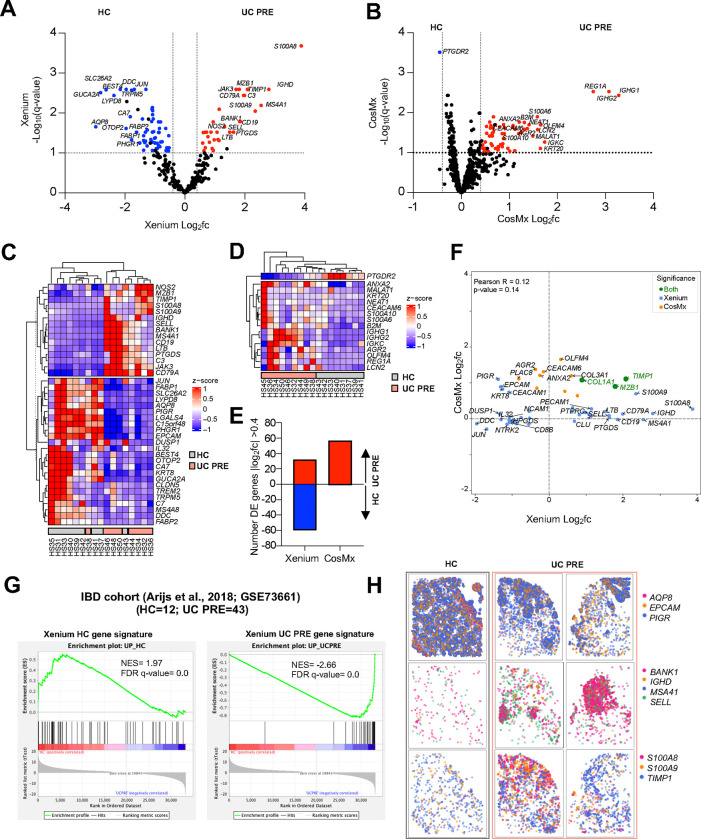
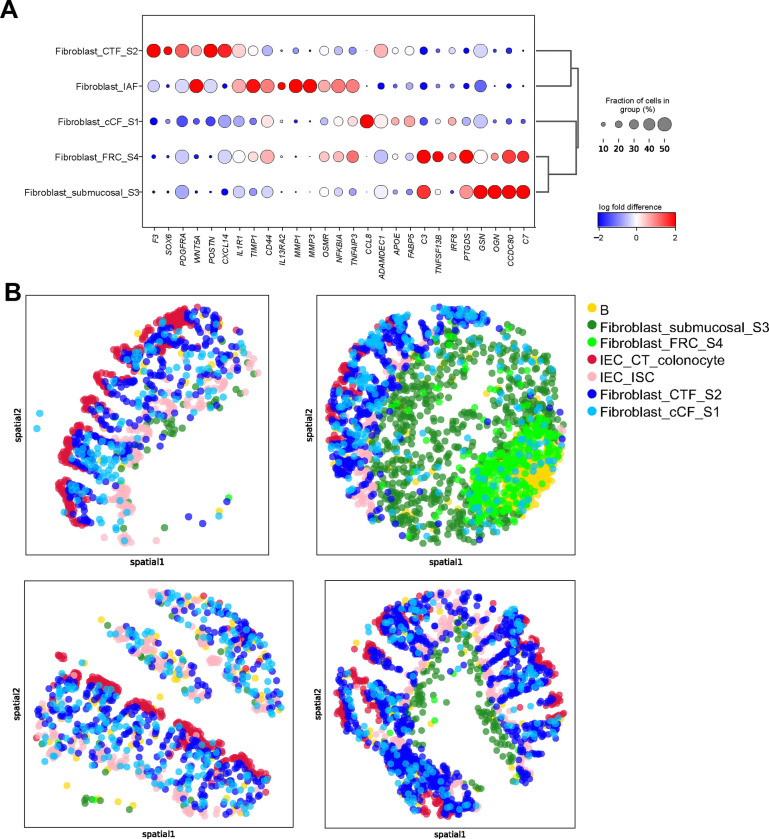
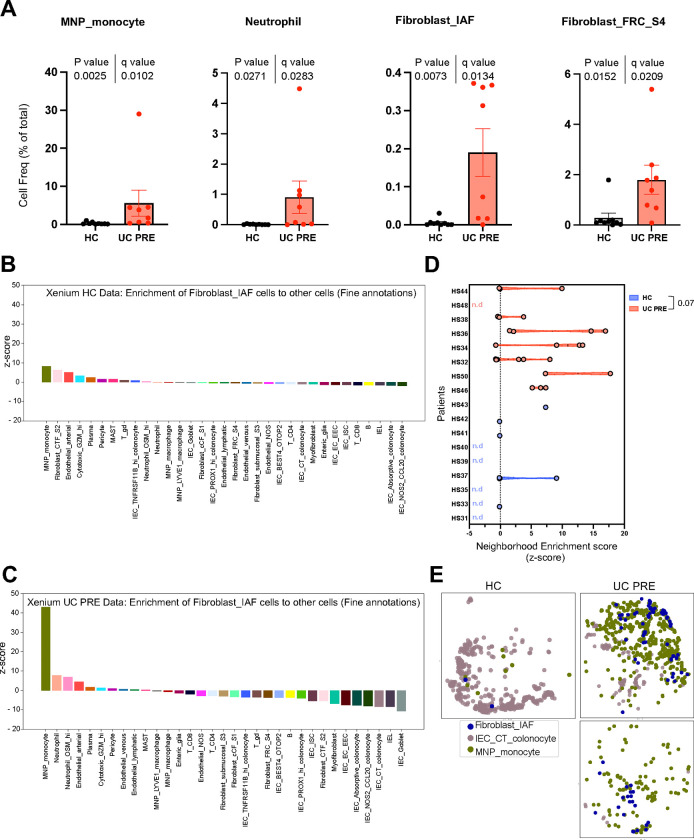
Results: A custom 290-plex Xenium gene panel exhibited the highest sensitivity and specificity for transcript detection, enabling precise identification and quantification of diverse cell subsets and differentially expressed genes across cell types and disease states. We mapped transcriptionally distinct fibroblast subsets to discrete spatial locations and identified inflammation-associated fibroblasts (IAFs) and monocytes as a colitis-associated cellular neighborhood. We also identified signatures associated with Vedolizumab (VDZ) responsiveness. VDZ non-responders were characterized by an IAF-monocyte transcriptional signature, while responders exhibited enrichment of epithelial gene sets.

Conclusions: Our optimized iSCST framework for archived FFPE biopsies provides unique advantages for assessing the role of colitis-associated cellular networks in routinely collected clinical samples. FFPE-based biomarkers could integrate with existing clinical workflows and potentially aid in risk-stratifying patients.

Keywords: Spatial transcriptomics; ulcerative colitis; vedolizumab.


Conflict of interest statement

Competing interests statement The Kattah, Combes and Fragiadakis lab receive research support from Eli Lilly for work unrelated to this manuscript. The Combes lab receive research support from Genentech for work unrelated to this manuscript. MGK is a member of the scientific advisory boards of Santa Ana Bio and Switchback Therapeutics and has received consulting fees from Cellarity, Spyre Therapeutics, Morphic Therapeutic, Sonoma Biotherapeutics, and Surrozen. AJC is a member of the scientific advisory board of Foundery innovations and has received consulting fees from Survey Genomics. UM is a consultant for Abbvie, Janssen, Takeda, Pfizer, BMS, Gilead, Enveda, Lilly, Merck, Rani Therapeutics, Celltrion, Abivax and received grant support from Leona and Harry Helmsley Charitable Trust. DYO has received research support from Merck, PACT Pharma, the Parker Institute for Cancer Immunotherapy, Poseida Therapeutics, TCR2 Therapeutics, Roche/Genentech, and Nutcracker Therapeutics; travel and accommodations from Roche/Genentech and Poseida Therapeutics; and has consulted for Revelation Partners.

Figures

Fig. 1|
Fig. 1|. Schematic of study design and technical performance comparison between Xenium and CosMx platforms.
(A) Schematic of study design. Created with BioRender.com (B,C) Number of (B) transcripts and (C) unique features detected per cell within the Xenium and CosMx datasets, calculated using the complete gene panel for each platform (Xenium, 290 genes; CosMx, 1,000 genes; left) and limited to the 159 overlapping genes across both panels (right). (D) Number of negative probes detected per cell within the Xenium and CosMx (Xenium mean=0.03 and CosMx mean=0.37). (E) Correlation between average transcript counts in Xenium and CosMx for the 159 overlapping genes. (F,G) Number of (F) transcripts and (G) unique features detected per cell per core or FOV within the Xenium and CosMx datasets split by prospectively collected HC and retrospectively collected UC. For panels B, C, D, F and G box and whisker plots, the band indicates the median, the box indicates the first and third quartiles, and the whiskers indicate minimum and maximum value within the upper/lower fence (upper fence=Q3+1.5xIQR and lower fence= Q1–1.5xIQR), only outlier points are shown. Mann-Whitney, two-tailed tests, p-values are indicated.
Fig. 2|
Fig. 2|. Cell type recovery across spatial transcriptomics platforms.
(A,B) UMAP visualization of Xenium dataset (313,940 cells), colored by coarse (A) and fine (B) annotations. (C) Heatmap displaying gene expression of the top 5 landmark genes for each coarse annotation cell type within the Xenium dataset. (D) Correlation matrix displaying the correlation between coarse annotation cell types identified for Xenium. (E,F) UMAP visualization of CosMx dataset (126,368 cells), colored by coarse (E) and fine (F) annotations. (G) Heatmap displaying gene expression of the top 5 landmark genes for each coarse annotation cell type within the CosMx dataset. (H) Correlation matrix displaying the correlation between coarse annotation cell types identified for CosMx. (I) Stacked bar plots for coarse annotation displaying cell frequency (percent of total) for Xenium and CosMx.
Fig. 3|
Fig. 3|. Pseudobulk DE gene analysis comparing UC PRE versus HC in both platforms and gene set enrichment analysis (GSEA) of an external, publicly available, bulk transcriptomic dataset using Xenium transcriptomic signatures.
(A) Volcano plot of pseudobulk DE genes identified by DESeq2 with log2fc >0.4 or <−0.4 and q < 0.1 in UC PRE vs HC for Xenium dataset. (B) Volcano plot of pseudobulk DE genes identified by DESeq2 with log2fc >0.4 or <−0.4 and q < 0.1 in UC PRE vs HC for CosMx dataset. (C) Heatmap of expression z-scores for the indicated genes in UC PRE (Up/Down) relative to HC for Xenium dataset. (D) Heatmap of expression z-scores for the indicated genes in UC PRE (Up/Down) relative to HC for CosMx dataset. (E) Number of pseudobulk DE genes in the indicated platform with log2fc > 0.4 or <−0.4 in UC PRE relative to HC identified by DESeq2 analysis. (F) Volcano plot of significant overlapping genes identified by DESeq2 with log2fc >0.4 or <−0.4 for Xenium and CosMx; genes are color coded (green, significant in both panels; blue, significant in Xenium panel only; orange, significant in CosMx panel only). (G) GSEA of Xenium HC and UC PRE spatial gene signatures in an external cohort of patients and relative Normalized Enrichment Scores (NES). (H) Representative spatial transcript scatter plots highlighting a subset of genes relatively increased in HC and UC PRE in Xenium dataset. For panels B and D, some genes are off-scale for visualization purposes, z-score set from −1 to 1.
Fig. 4|
Fig. 4|. Xenium enabled identification and spatial localization of distinct fibroblast subsets in colon mucosal biopsies and identified increased myeloid and stromal cell subsets in UC.
(A) Dot plot representation of landmark genes for the indicated subsets. (B) Transcriptionally distinct fibroblast subsets identified by relative spatial localization in colon tissue from representative cores for the indicated cell subsets.
Fig. 5|
Fig. 5|. Neighborhood enrichment analysis of Xenium dataset reveals higher proximity of IAFs and monocytes in UC PRE biopsies.
(A,B) Heatmaps displaying neighborhood enrichment z-scores for fine annotation cell pairs within (A) HC and (B) UC PRE biopsies. Spatial enrichment of IAFs cells to all other cell types in (C) HC and (D) UC PRE biopsies. (E) Violin plots comparing the spatial enrichment of IAFs and monocytes by patient, each dot represents a core; nd, not defined. (F) Spatial scatter plot of representative cores highlighting IAF, crypt top (CT) colonocytes, and monocytes in HC and UC PRE biopsies. For panel E, Mann-Whitney test, p-value is indicated. For panels A and B, several values exceed the scale for visualization purposes and are denoted by a white asterisk.

References

    1. Kinchen J. et al. Structural Remodeling of the Human Colonic Mesenchyme in Inflammatory Bowel Disease. Cell 175, 372–386.e17 (2018). - PMC - PubMed
    1. Parikh K. et al. Colonic epithelial cell diversity in health and inflammatory bowel disease. Nature 567, 49–55 (2019). - PubMed
    1. Boland B. S. et al. Heterogeneity and clonal relationships of adaptive immune cells in ulcerative colitis revealed by single-cell analyses. Sci. Immunol. 5, eabb4432 (2020). - PMC - PubMed
    1. Smillie C. S. et al. Intra- and Inter-cellular Rewiring of the Human Colon during Ulcerative Colitis. Cell 178, 714–730.e22 (2019). - PMC - PubMed
    1. Konnikova L. et al. High-dimensional immune phenotyping and transcriptional analyses reveal robust recovery of viable human immune and epithelial cells from frozen gastrointestinal tissue. Mucosal Immunol. 11, 1684–1693 (2018). - PMC - PubMed

Publication types

LinkOut - more resources