[Preprint]. 2024 Nov 15:2024.11.13.623229.
doi: 10.1101/2024.11.13.623229.

Unbiased discovery of antibody therapies that stimulate macrophage-mediated destruction of B-cell lymphoma

Affiliations

Unbiased discovery of antibody therapies that stimulate macrophage-mediated destruction of B-cell lymphoma

Juliano Ribeiro et al. bioRxiv. .

Abstract

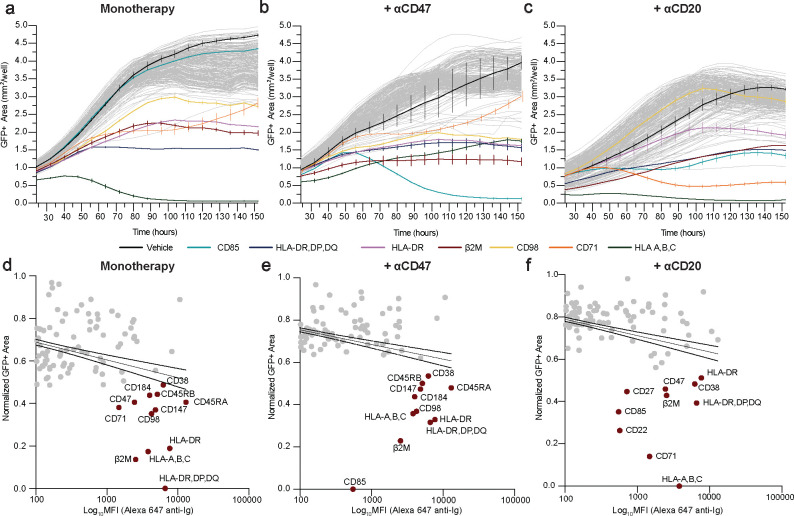
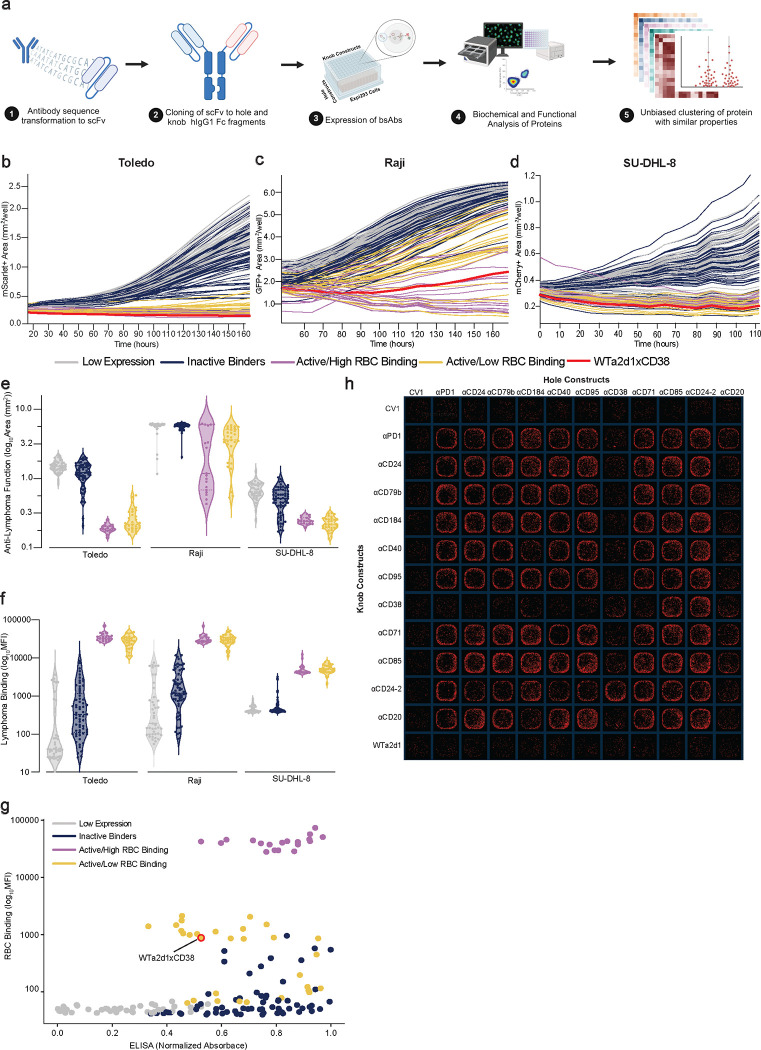
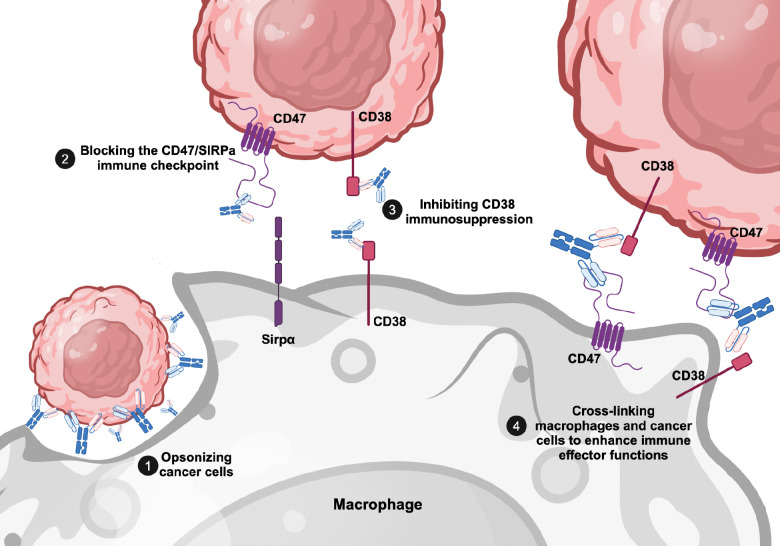
Macrophages are critical effectors of antibody therapies for lymphoma, but the best targets for this purpose remain unknown. Here, we sought to define a comprehensive repertoire of cell surface antigens that can be targeted to stimulate macrophage-mediated destruction of B-cell lymphoma. We developed a high-throughput assay to screen hundreds of antibodies for their ability to provoke macrophages to attack B-cell lymphoma cells. Across both mouse and human systems, we identified multiple unappreciated targets of opsonization as well as putative immune checkpoints. We used this information to engineer a compendium of 156 bispecific antibodies, and we identified dozens of bispecifics that dramatically stimulate macrophage-mediated cytotoxicity of lymphoma cells. Among these, a bispecific comprising a SIRPα decoy domain and a CD38-targeting arm (WTa2d1×CD38) exhibited maximal efficacy while minimizing the risk of hematologic toxicity. This bispecific stimulated robust anti-tumor responses in multiple xenograft models of aggressive B-cell lymphoma. Our approach can be directly applied to other cancers to rapidly discover bispecific antibodies that leverage anti-tumor responses by macrophages or other innate immune cells.


Conflict of interest statement

Competing interests JR, CPG, KV, AM, and KW have filed US patent applications related to this work. KV is a former employee and equity owner of DEM Biopharma. MC has received research funding from Janssen, Genentech and AstraZeneca. KW reports patents/royalties (Stanford University, Whitehead Institute, Forty Seven, Gilead Sciences, ALX Oncology, DEM Biopharma); co-founder, scientific advisory board member, and equity holder (ALX Oncology, DEM Biopharma, Solu Therapeutics), stock ownership (Ginkgo Bioworks). The other authors declare no competing interests.

Figures

Fig. 1 |
Fig. 1 |. An unbiased antibody screen identifies targets for macrophage-directed immunotherapy of murine B-cell lymphoma.
a, Experimental design of an unbiased functional screen to identify monoclonal antibodies that provoke macrophage-mediated cytotoxicity of lymphoma cells. Primary murine macrophages were co-cultured in 384-well plates with StayGold+ MHC-I A20 cancer cells (a murine B-cell lymphoma cell line). The wells were subjected to three treatment conditions: control (“monotherapy”), 10 μg/mL anti-CD47 antibody, or 10 ug/mL anti-CD20 antibody. An arrayed library of purified monoclonal antibodies targeting murine cell surface antigens (n = 173 antibodies) was overlaid at a concentration of 6.55 μg/mL. The cells were incubated for 156 h (~6.5 days) and the StayGold+ area was quantified by automated microscopy and whole-well image analysis every 8 hours. b, Representative whole-well images at the last time point (156 h) showing StayGold+ lymphoma area (purple) from wells treated with the indicated antibodies that were found to stimulate macrophage-dependent cytotoxicity of A20 cells. Scale bar, 800 um. (c-e) Results of co-cultures with the antibody library showing growth of StayGold+ A20 MHC-I KO cells under monotherapy conditions (c), in combination with anti-CD47 (d), or in combination with anti-CD20 (e). Each curve represents the growth of lymphoma cells treated with a different antibody in the presence of macrophages. Black curve indicates control wells, colored curves indicate antibodies against CD24, CD40, CD79b, CD95 and CXCR4. Curves represent mean (± SEM as indicated) of two individual co-culture wells. f-h, Scatter plots depicting results of quantitative surfaceome profiling by flow cytometry for each library antibody binding to A20 lymphoma cells (x-axis) versus anti-lymphoma function at the last imaging time point (t = 156 hours, y-axis). Lower fluorescent area values indicate greater macrophage anti-lymphoma activity. Highlighted in red are the antibodies exceeding the 95th percentile in functional activity and are defined as hits. Black curve indicates the linear relationship with 95% CI boundaries between the functional efficacy and binding in the monotherapy condition (f, r=−0.2334, p=0.0011), in combination with anti-CD47(g, r=−0.2339, p=0.0011), and in combination with anti-CD20 (h, r=−0.009, p=0.8987).
Fig. 2 |
Fig. 2 |. An unbiased antibody screen identifies targets for macrophage-directed immunotherapy for human B-cell lymphoma.
Primary human macrophages were co-cultured in 384-well plates with GFP+ Raji cells (a human Burkitt lymphoma cell line). The wells were subjected to three treatment conditions: control, 10 μg/mL anti-CD47 antibody, or 10 μg/mL anti-CD20 antibody. An arrayed library of purified monoclonal antibodies targeting human cell surface antigens (n = 241 antibodies) was overlaid at a concentration of 6.55 μg/mL. The cells were then incubated for 156 h (~6.5 days) and the GFP+ area was quantified by automated microscopy and whole-well image analysis every 8 hours. a-c, Growth of GFP+ Raji cells in co-culture with macrophages under monotherapy conditions (a), in combination with anti-CD47 (b), or in combination with anti-CD20 (c). Each curve represents the growth of lymphoma cells treated with a different antibody. Black curve indicates control wells, colored curves indicate top antibody hits against MHC-related antigens, CD85, CD98 and CD71. Curves represent mean (± SEM as indicated) of two individual co-culture wells. d-f, Scatter plots depicting results of quantitative surfaceome profiling by flow cytometry for each library antibody binding to GFP+ Raji lymphoma cells (x-axis) versus functional anti-lymphoma effectiveness at the last imaging time point (t = 156 hours, y-axis). Lower fluorescent area values indicate greater macrophage anti-lymphoma activity. Highlighted in red are the antibodies exceeding the 95th percentile in function activity and are defined as hits. Black curve indicates the linear relationship with 95% CI boundaries between the functional efficacy and binding in the monotherapy condition (d, r=−0.3364, p<0.0001), in combination with anti-CD47 (e, r=−0.3646, p<0.0001), and in combination with anti-CD20 (f, r=−0.4105, p<0.0001).
Fig. 3 |
Fig. 3 |. Identification of antibody combinations that elicit maximal macrophage-mediated cytotoxicity of B-cell lymphoma.
a,b, Primary murine macrophages were co-cultured with StayGold+ A20 (WT) or MHC-I KO cells. Seven different antibodies identified from our screen and anti-PD1 were tested alone or in combination as indicated. GFP+ area was measured over time as a representation of growth or elimination of lymphoma cells. Representative images at the last time point (156 h) are shown for each antibody combination for StayGold+ A20 WT (a) and StayGold+ A20 MHC-I KO cells (b). c, Heat map representing StayGold+ area at last time point (152 h) for WT (blue) and MHC-I-negative (red) A20 cells. Merged data is shown in purple. For both cell lines, lighter color indicates greater StayGold+ area while darker color indicates lesser StayGold+ area. Data represents the mean of 2 individual co-cultures per antibody combination. d, Antibody combination studies were performed using primary human macrophages and GFP+ Raji (WT), GFP+ Raji MHC-I KO, and mScarlet+ Toledo cells treated with 8 different antibodies alone or in combination as indicated. Heatmap depicts the mean normalized fluorescent area of the last time point (152 h) from 2 individual co-culture wells. Unbiased hierarchical clustering was used to identify antibodies, combinations and cell lines with similar anti-lymphoma properties when co-cultured with macrophages.
Fig. 4 |
Fig. 4 |. Multiplex generation of bispecific antibodies that stimulate macrophage destruction of human B-cell lymphoma.
a, Experimental setup for the generation and functional characterization of a combinatorial matrix of bsAbs. scFvs were created based on publicly available antibody sequences, fused to modified human IgG1 Fc regions containing knob or hole mutations for bispecific assembly, and a combinatorial library of bsAbs was expressed in Expi293 cells. The resulting bsAbs were tested for functional activity and binding to multiple lymphoma cell lines and red blood cells. ELISA was performed to evaluate antibody expression. Finally, the properties of macrophage-mediated cytotoxicity, binding, and expression by ELISA were used for K-Means unbiased clustering of the antibodies with similar biochemical and functional properties. b-d, Growth of human lymphoma cells (b, mScarlet+ Toledo; c, GFP+ Raji; d, mCherry+ SUD-HL-8) in co-culture with primary human macrophages. Each curve depicts lymphoma growth in the presence of a different bsAb. Curves represent mean of 2 independent co-culture wells. Each color represents a different cluster of proteins based on functional properties. e, Violin plot of fluorescent area at the last time point for each lymphoma cell line for each unbiased cluster of bsAbs. f, Violin plot depicting binding of the antibodies to each lymphoma cell line as indicated based on clustering. g, Relationship between the different bsAb clusters with respect to binding to human red blood cells and their expression by ELISA. h, Representative images of the last time point of the co-culture of macrophages and mScarlet+ Toledo cells and each bsAb from the combinatorial library. Rows indicate hole constructs, columns indicate knob constructs. e-f, Violin plots depict mean and interquartile range.
Fig. 5 |
Fig. 5 |. WTa2d1×CD38 stimulates maximal macrophage-mediated cytotoxicity of B-cell lymphomas.
a, AlphaFold2 predicted structure of WTa2d1×CD38, a bsAb targeting CD47 and CD38. The Fc region of the anti-CD38 arm is highlighted in blue with its respective scFv region in teal, whereas the Fc region of the WTa2d1 arm is highlighted in red with its respective binding domain in orange. The mutations, “knob” (T270Y,T311Y) and “hole” (Y396T, Y437T) are highlighted at the bottom. b, Maldi-TOF analysis of the protein population of the purified bsAb. Based on the theoretical mass of the possible homo and heterodimers, the two main peaks were assigned to WTa2d1×WTa2d1 and WTa2d1×CD38 species. The abundance of WTa2d1×CD38 was calculated as 94.60% based on the peak area. c, Histogram showing binding of the bsAb to wild-type versus CD47 knockout (KO) cell lines highlights the ability of the two antibody arms to bind to their respective antigens. Binding was detected with an Alexa 647-conjugated anti-human IgG secondary antibody. DLD-1 is a colorectal cancer cell line that expresses CD47 but not CD38. d, Binding of WTa2d1×CD38 to the indicated human lymphoma cell lines and macrophages combined from 3 donors indicates the cell-based affinity for the antibody. Data indicate mean ± SD. e, Co-culture assays using primary human macrophages were used to determine the potency of WTa2d1×CD38 across nine different human B-cell lymphoma cell lines, including the indicated wild-type and MHC-I KO variants. Each curve represents an 8-point titration performed in duplicate for each cell line. Fluorescent area was compared at the last imaging time point and normalized based on the maximum value for each cell line. Data depict mean ± SD. f, Comparison of the fluorescent area at the last time point for different B-cell lymphoma cell lines when treated with 10.54 μg/mL of WTa2d1×CD38 or rituximab. Each point represents the mean value for a different cell line performed in duplicate. Student two tailed paired T-test was used to evaluate the difference between the two groups. Lines show median. g, Comparison of the fluorescent area at the last time point from co-culture assays using the indicated lymphoma cell lines treated with either WTa2d1×CD38 or rituximab. Data depict mean ± SD. *p-value<0.0001 for the indicated comparisons by two-way ANOVA with correction for multiple comparisons. h,i, Macrophage phagocytosis of Raji (h) and Toledo (i) cells when co-cultured for 2 hours in the presence of the WTa2d1×CD38, rituximab, or an anti-CD47 antibody (clone B6H12). All of the values were normalized against the bsAb and the experiment was performed two independent times with three individual co-culture wells per condition. The dotted lines indicate the mean of the negative control condition performed in one experiment with three co-culture wells. Data depict mean ± SD with analysis by two way ANOVA with Tukey’s multiple comparison test. j,k, Co-culture with human macrophages pooled from multiple donors with Raji (j) and Toledo (k) lymphoma cells as targets. Co-cultures were treated with 1 μg/ml WTa2d1×CD38 and 10 μg/ml antibodies to different Fc gamma receptors as indicated. Curves indicate mean ± SEM.
Fig. 6 |
Fig. 6 |. WTa2d1×CD38 exhibits anti-tumor efficacy in xenograft models of aggressive B-cell lymphoma.
a, Experimental setup of a xenograft experiment using Raji cells engrafted subcutaneously into the flanks of NSG mice. b, Growth curves of Raji lymphoma tumors in NSG mice treated with the indicated therapies over time (n = 5 mice per treatment cohort). Tumor growth was evaluated by caliper measurements. Mice were treated with control, 100 μg WTa2d1×CD38, or 100 μg rituximab for 14 days. Data depict mean ± SEM. c, Survival analysis of the indicated treatment cohorts. The median survival of Vehicle and Rituximab groups were 38 and 98 days, respectively, whereas the WTa2d1×CD38 was not reached. Log-Rank test was used to evaluate the difference in the probability of survival. Note rituximab curve is minimally nudged for visualization. d, Experimental setup of the xenograft CNS lymphoma model experiment using Raji cells engrafted stereotactically into NSG mice brains. e, Bioluminescence imaging using luciferase reporters of CNS tumors throughout the experiment period (n = 5 mice per treatment cohort). Mice were treated with vehicle control or 200 μg WTa2d1×CD38 three times per week. f, Survival analysis comparing the vehicle control and WTa2d1×CD38 treatment cohorts. Log-Rank test was used to evaluate the difference in the probability of survival between vehicle and treatment conditions.
Fig. 7 |
Fig. 7 |. Putative mechanisms of action for the WTa2d1×CD38 bispecific antibody
Representation of the biological functions performed by the bsAb to enhance macrophage-mediated destruction of B-cell lymphoma cells. The WTa2d1×CD38 bispecific can act as an opsonin and engage Fc receptors on macrophages (1). It can also block immunosuppressive pathways on both the cancer and macrophage cell surface (2 and 3). Additionally, it can enhance the biophysical interactions of macrophages and B-cell lymphoma cells, bringing their cell membranes in close proximity to promote phagocytosis (4). Together, these functions maximally activate macrophage-mediated cytotoxicity of aggressive B-cell lymphoma cells.

References

    1. Campo E. et al. The International Consensus Classification of Mature Lymphoid Neoplasms: a report from the Clinical Advisory Committee. Blood 140, 1229–1253 (2022). - PMC - PubMed
    1. Silkenstedt E., Salles G., Campo E. & Dreyling M. B-cell non-Hodgkin lymphomas. The Lancet 403, 1791–1807 (2024). - PubMed
    1. Tilly H. et al. Polatuzumab Vedotin in Previously Untreated Diffuse Large B-Cell Lymphoma. N Engl J Med 386, 351–363 (2022). - PMC - PubMed
    1. Zhang X., Zhu L., Zhang H., Chen S. & Xiao Y. CAR-T Cell Therapy in Hematological Malignancies: Current Opportunities and Challenges. Front Immunol 13, 927153 (2022). - PMC - PubMed
    1. Cappell K. M. & Kochenderfer J. N. Long-term outcomes following CAR T cell therapy: what we know so far. Nat Rev Clin Oncol 20, 359–371 (2023). - PMC - PubMed

Publication types