[Preprint]. 2025 Sep 20:2024.11.13.623299.
doi: 10.1101/2024.11.13.623299.

SARS-CoV-2 ORF3a blocks lysosomal cholesterol egress by disrupting VPS39-regulated NPC2 trafficking and BMP metabolism

Affiliations

SARS-CoV-2 ORF3a blocks lysosomal cholesterol egress by disrupting VPS39-regulated NPC2 trafficking and BMP metabolism

Baley A Goodson et al. bioRxiv. .

Abstract

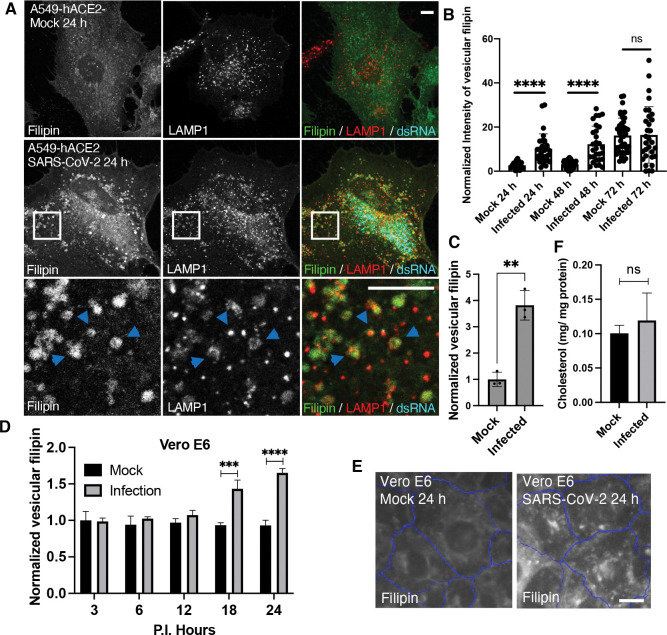
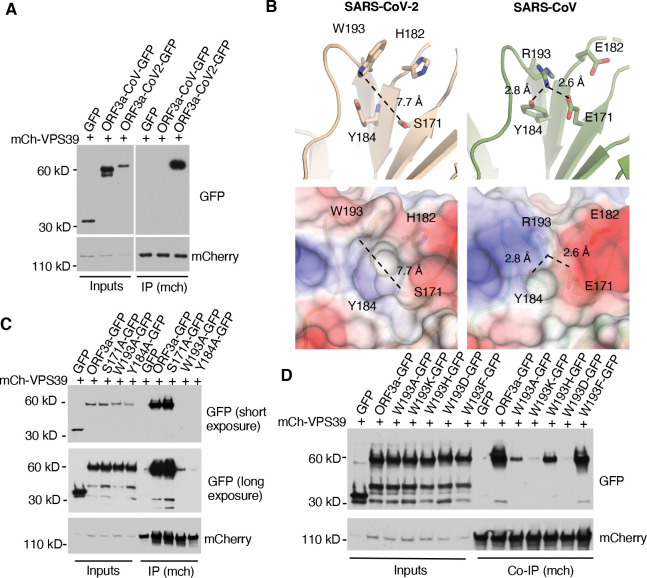
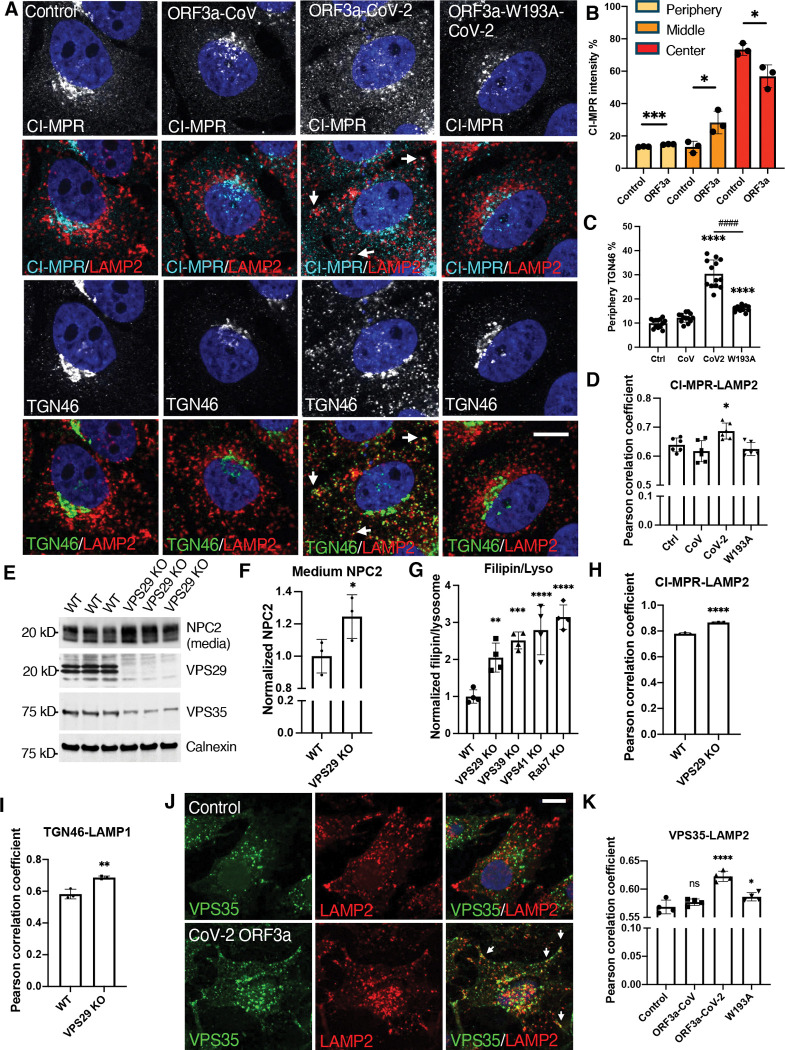
Cholesterol homeostasis relies on lysosomes, which release free cholesterol from degraded lipids. We show that SARS-CoV-2 blocks lysosomal cholesterol export through its protein ORF3a. ORF3a binds the HOPS subunit VPS39, and disrupting this interaction restores cholesterol trafficking. Two mechanisms underlie this defect. First, ORF3a-VPS39 interaction traps the sorting receptor CI-MPR and the retrieval complex retromer in endosomes/lysosomes, impairing trafficking of the cholesterol transporter NPC2. Retromer deletion reproduced these defects. Second, ORF3a reduces bis(monoacylglycerol)phosphates (BMPs), lysosomal lipids required for cholesterol export. Lipidomics and proteomics revealed altered metabolism of BMP precursors, mitochondrial phosphatidylglycerols (PGs), and reduced mitochondrial proteins at lysosomes. ORF3a-VPS39 interaction decreased lysosome-mitochondrion membrane contact sites (MCS), excluding autophagy or mitochondrion-derived vesicles as routes for PG transfer. VPS39 deletion decreased the MCS and BMPs. These findings identify VPS39 as a regulator of NPC2 trafficking and BMP biosynthesis and reveal that ORF3a disrupts both pathways to block cholesterol egress.

Keywords: Cellular cholesterol transport; HOPS; bis(monoacylglycerol)phosphates (BMPs); lysosome-mitochondrion interactions; retromer.


Figures

Figure 1
Figure 1. Characterization of cellular free cholesterol in SARS-CoV-2 infected cells
A-C. A549 cells stably expressing human ACE2 receptor (A549-hACE2) were infected with SARS-CoV-2 and fixed at the indicated time post-infection (P.I.). Filipin was applied to visualize free cholesterol. A dsRNA antibody was used to identify the infected cells. A LAMP1 antibody was used to label lysosomes. Confocal microscopy was performed to collect fluorescence images, and the images at 24 h P.I. were shown in A, with arrows pointing colocalized filipin and LAMP1. The intensity of Filipin puncta was quantified with FIJI, and the mean values of total filipin in each cell from three independent experiments were plotted, shown as in B. Vesicular filipin was quantified at 24 h P.I. from at least 1,000 infected cells per well and three replicate wells in an experiment by CellInsight microscope platform. Three independent experiments were performed, and pooled results were shown in C. D,E. Similar experiments were perform as above in Vero E6 cells, and filipin was quantified at the indicated time points. F. Total lipids were extracted from mock and infected A549-hACE2 cells at 24 h P.I. and subjected to free cholesterol measurement with GC-MS. Total protein levels were measure by BCA assays. Two independent experiments with 3 replications were performed. Bar graphs are presented as min-max (B) or mean ± SD (others). p values were determined using t’ test or One-way ANOVA test. **, p<0.001, ***, p<0.001, ****, p<0.0001, n.s., not significant. Scale bars, 5 μm.
Figure 2
Figure 2. Identification of SARS-CoV-2 proteins responsible for lysosome cholesterol sequestration
A. Plasmids encoding SARS-CoV-2 proteins were transfected into A549-hACE2 cells individually. Cells were fixed at 24 h post-transfection and co-stained with filipin to visualized free cholesterol and antibodies against the epitope tags to identify transfected cells. Spike protein has no tag and was identified with an antibody. Confocal imaging was performed to randomly take images, and filipin intensity was quantified with FIJI in twenty to fifty cells from two independent experiments. B. A549-hACE2 cells were transfected with ORF3a-GFP plasmid as in A and co-stained with filipin and GFP and LAMP2 antibodies. C,D. HeLa cells were transfected with plasmids encode V5 fused ORF3a proteins in SARS-CoV or SARS-CoV-2. V5 alone served as a control. Staining and quantification was performed as described above. Bar graphs are presented as mean ± SD. p values were determined using t’ test or One-way ANOVA test. *, p<0.05, **** (vs. control) or #### (CoV vs CoV-2), p<0.0001, n.s., not significant. Scale bars, 5 μm. Framed images in C were enlarged 9.36 folds.
Figure 3
Figure 3. Structural analysis of ORF3a-VPS39 interaction interface in ORF3a
A. HeLa cells were co-transfected with mCh-VPS39 and different GFP-ORF3a constructs as indicated and lysed in a non-denature detergent-contained buffer for co-immunoprecipitation of mCh-VPS39. Immunoblotting was performed to detect GFP signals. B. The structures of ORF3a proteins from SARS-CoV-2 (beige) and SARS-CoV (green) were shown with the cartoon representation of the indicated residues (upper panel). The side chains are depicted as sticks with color code for carbon (beige or green), nitrogen (blue), and oxygen (red). The presence of W193 in SARS-CoV-2 induces an open conformation of the divergent loop that is 7.7 Å away from S171 (dotted line), while R193 in SARS-CoV forms hydrogen bonds with D171 or Y184 (dotted lines). The lower panels represent overlays between electrostatics surface and the cartoon representations. Positively charged surface is depicted in blue, hydrophobic surface in white, and negatively charged surface in red. All images and measurements were performed using PyMol V 2.4.0. C,D. Transfection and co-immunoprecipitation was performed as described in A to detect the interaction between mCh-VPS39 and GFP-tagged ORF3a and its mutants.
Figure 4
Figure 4. Characterization of NPC proteins in ORF3a-inducible expression cells
A. HeLa-Flp-In cells were established as described in Methods and treated with or without 1 μg/ml doxycycline for 16 hours. Immunoblotting was performed with the indicated antibodies. B. Co-immunoprecipitation was performed with FLAG antibody (M2)-coated magnetic beads. Endogenous VPS39 was detected by immunoblotting (arrow). C,D. HeLa-Flp-In cells were fixed and stained with filipin, CellMask, and DAPI for high-content imaging. Vesicular filipin was quantified in at least 1,000 cells per well, 6 wells per experiments, 5 independent experiments. E,F. Antibodies against NPC1 or LAMP2 were used for immunostaining in fixed cells. Confocal microscopy (E) and high-content imaging (F) was performed to analyze colocalization between NPC1 and LAMP2. G,H. Cells were transfected with NPC2-mCherry plasmid and immunostained with antibodies of mCherry and LAMP1. Confocal microscopy was performed, and FIJI was used to quantify colocalization between NPC2-mCherry and LAMP1 in the cells from two independent experiments. I,J. Cell culture media was collected and subjected to immunoblotting using the antibodies indicated. FIJI was used to quantify the bands from 3 replications in each of three independent experiments. Bar graphs are presented as mean ± SD. p values were determined using t’ test (D,H, CoV-2 vs W193A) or One-way ANOVA test. * or #, p<0.05, ** or ##, p<0.01, ***, p<0.001, **** (vs. control) or #### (CoV-2 vs W193A), p<0.0001, n.s., not significant. Scale bars, 5 μm. Control (Ctrl), linker peptide, CoV, SARS-CoV ORF3a, CoV-2, SARS-CoV-2 ORF3a, W193A, SARS-CoV-2 ORF3a-W193A mutant.
Figure 5
Figure 5. Decreased endosome-to-TGN trafficking
A-D, HeLa Flp-In cells were fixed after 16-h induction of protein expression and immunostained with the indicated antibodies. Confocal microscopy (images) and high-content imaging (bar charts) were performed to analyze protein cellular distribution and colocalization. Periphery was defined as a ring area shrunk from cell boundary with a gap distance 15 pixels (B,C). Center was defined as a dilated circle from nuclear boundary with a distance of 20 pixels (B). Middle was defined as the area between periphery and center (B). E,F. Wildtype and VPS29-KO HeLa cell were cultured in serum-free media for 6 hours, and the media were collected before cells were lysed. The media and cell lysates were subjected to immunoblotting with the indicated antibodies. G. Vesicular filipin was measured by high-content imaging and normalized to lysosomes in the indicated cells. H-K, Cells were fixed and immunostained with the indicated antibodies. Confocal microscopy (images) and high-content imaging (bar charts) was performed to analyze protein colocalization. Bar graphs are presented as mean ± SD. p values were determined using t’ test or One-way ANOVA test *, p<0.05, **, p<0.01, ***, p<0.001, **** (vs. control) or #### (C, CoV-2 vs W193A), p<0.0001, n.s., not significant. Scale bars, 5 μm. Control (Ctrl), linker peptide. CoV, SARS-CoV ORF3a. CoV-2, SARS-CoV-2 ORF3a. W193A, SARS-CoV-2 ORF3a-W193A mutant.
Figure 6
Figure 6. Analysis of BMP levels
A,B. Vero E6 cells were infected with SARS-CoV-2, fixed at the indicated time points post-infection, and immunostained with BMP and LAMP1 antibodies. LAMP1-positive BMP puncta were quantified with the high-content imaging system. Representative images were shown in B. C,D. BMP in the HeLa Flp-In cells were measured as described in A. E. The indicated cells were harvested and lysed for total lipid extraction. Shotgun lipidomics was performed to identify and quantify bio(monoacylglycero)phosphate (BMP) species based on the fatty acid chains, labeled as carbon number : double-bond number. BMP was normalized to protein concentrations. F. Cells were incubated with serum-free media containing 1% BSA and 1 μM BMP for 2 hours, fixed and stained with filipin. filipin levels were measured with high-content imaging. Bar graphs are presented as mean ± SD. p values were determined using t’ test or One-way ANOVA test *, p<0.05. **, ##, p<0.01. ***, p<0.001. ****, ####, p<0.0001, n.s., not significant. Scale bars, 5 μm. Control (Ctrl), linker peptide. CoV, SARS-CoV ORF3a. CoV-2, SARS-CoV-2 ORF3a. W193A, SARS-CoV-2 ORF3a-W193A mutant.
Figure 7.
Figure 7.. Decreased lysosome-mitochondrion interaction
A-D. Lysosomes were isolated from ORF3a and W193A Flp-In cells, and the total protein were extracted for mass spectrometry analysis. The proteins only presenting in ORF3a lysosomes (gain) or increased more than 2-folds compared to W193A lysosomes (increased) are shown in the pie chart based on their cellular localization (A). The proteins only presenting in W193A lysosomes (lost) or decreased more than 50% compared to W193A (reduced) are shown in B. Amount the lost proteins, as defined above, top 20% abundant proteins in W193A lysosomes are shown in C. The reduced proteins, as defined above, were plotted in D. The color codes reflect their cellular localization or functions. E. The control and CoV-2 ORF3a cells were fixed and immunostained with the indicated antibodies. Confocal microscopy was applied for imaging. Arrows indicate the lysosome-mitochondrion physical interactions. Scale bar, 5 μm. F,G. The Flp-In cells were fixed and immunostained with the indicated antibodies accompanied with CellMask and DAPI. High-content imaging system was used for image collection and analysis. Cell boundary and perinuclear area were defined based on CellMask and DAPI, respectively. Lysosome and mitochondrial masks were defined with LAMP2 and TOMM20 signals, respectively. The colocalization between lysosomes and mitochondria were quantified and presented as Pearson correlation coefficient. H. Total lipids were extracted from the indicated cells and subjected to shotgun lipidomics analysis. PG, BMP, and Cardiolipin with the 18:1 fatty acid chains are presented. PG, phosphatidylglycerol. BMP, bis(monoacylglycerol)phosphate. Bar graphs are presented as mean ± SD. p values were determined using One-way ANOVA test **, p<0.01. ***, p<0.001. n.s., not significant.
Figure 8.
Figure 8.. Involvement of impaired lysosome-mitochondrion membrane contact sites in BMP reduction
A.B, Wildtype and STX17-knockout (KO) HeLa cells were lysed for immnoblotting with the indicated antibodies (A) or fixed for immunostaining and hign-content imaging quantification (B). C.D, Wildtype HeLa cells were transfected with siRNA targeting the indicated autophagy genes. Non-targeting siRNA (N.T.) served as a control. Protein levels were examined by immunoblotting (C), and the BMP levels were measured by immunostaining followed by high-content imaging (D) at 2 days post-transfection. E-G, The Flp-In cells were fixed and immunostained with a TOMM20 (marker of mitochondrion-derived vesicles, MDVs), PDH (maker of mitochondria but not MDVs), and LAMP2 (lysosome marker) antibodies. Confocal microscopy was performed to identify MDVs (arrows) and the MDVs fused with lysosomes (circles) (E). The MDV numbers (F) and the number of lysosome-fused MDVs (G) were quantified using FIJI. Scale bar, 5 μm. H.I, HeLa cells were transfected with the siRNAs of N.T., DRP1, or combined MIRO1 and MIRO2 and subjected to immunoblotting (H) or high-content imaging quantification (I). J.K, The Flp-In cells were seeded on glass coverslips, fixed, and subjected to electron microscopy. Randomized cells were imaged at mitochondrion-existing areas. Lysosome-mitochondrion membrane contact sites were identified by their membrane structures and the distance between membranes (J) and quantified from 20 cells of each type (K). Scale bar, 0.5 μm. L.M, Wildtype and VPS39-knockout (KO) HeLa cells were immunostained and subjected to high-content imaging quantification. Bar graphs are presented as mean ± SD. p values were determined using t’ test or One-way ANOVA test. *, p<0.05. **, p<0.01. ***, p<0.001. ****, p<0.0001. n.s., not significant.

References

    1. Li Y., Zhang Y., Lu R., Dai M., Shen M., Zhang J., Cui Y., Liu B., Lin F., Chen L., Han D., Fan Y., Zeng Y., Li W., Li S., Chen X., Li H. & Pan P., Lipid metabolism changes in patients with severe COVID-19. Clin Chim Acta 2021. 517 33639119
    1. Rezaei A., Neshat S. & Heshmat-Ghahdarijani K., Alterations of Lipid Profile in COVID-19: A Narrative Review. Curr Probl Cardiol 2022. 47(3) 34272088
    1. Zickler M., Stanelle-Bertram S., Ehret S., Heinrich F., Lange P., Schaumburg B., Kouassi N. M., Beck S., Jaeckstein M. Y., Mann O., Krasemann S., Schroeder M., Jarczak D., Nierhaus A., Kluge S., Peschka M., Schlüter H., Renné T., Pueschel K., Kloetgen A., Scheja L., Ondruschka B., Heeren J. & Gabriel G., Replication of SARS-CoV-2 in adipose tissue determines organ and systemic lipid metabolism in hamsters and humans. Cell Metab 2022. 34(1) 34895500
    1. Xu E., Xie Y. & Al-Aly Z., Risks and burdens of incident dyslipidaemia in long COVID: a cohort study. Lancet Diabetes Endocrinol 2023. 11(2) 36623520
    1. López-Hernández Y., Oropeza-Valdez J. J., García Lopez D. A., Borrego J. C., Murgu M., Valdez J., López J. A. & Monárrez-Espino J., Untargeted analysis in post-COVID-19 patients reveals dysregulated lipid pathways two years after recovery. Front Mol Biosci 2023. 10 36936993

Publication types

LinkOut - more resources