[Preprint]. 2024 Nov 15:2024.11.12.623270.
doi: 10.1101/2024.11.12.623270.

Single-cell analyses reveal that monocyte gene expression profiles influence HIV-1 reservoir size in acutely treated cohorts

Affiliations

Single-cell analyses reveal that monocyte gene expression profiles influence HIV-1 reservoir size in acutely treated cohorts

Philip K Ehrenberg et al. bioRxiv. .

Update in

  • Single-cell analyses identify monocyte gene expression profiles that influence HIV-1 reservoir size in acutely treated cohorts.
    Ehrenberg PK, Geretz A, Volcic M, Izumi T, Yum LK, Waickman A, Shangguan S, Paquin-Proulx D, Creegan M, Bose M, Machmach K, McGraw A, Narahari A, Currier JR, Sacdalan C, Phanuphak N, Apps R, Corley M, Ndhlovu LC, Slike B, Krebs SJ, Anonworanich J, Tovanabutra S, Robb ML, Eller MA, Laird GM, Cyktor J, Daar ES, Crowell TA, Mellors JW, Vasan S, Michael NL, Kirchhoff F, Thomas R. Ehrenberg PK, et al. Nat Commun. 2025 May 29;16(1):4975. doi: 10.1038/s41467-025-59833-9. Nat Commun. 2025. PMID: 40442100 Free PMC article.

Abstract

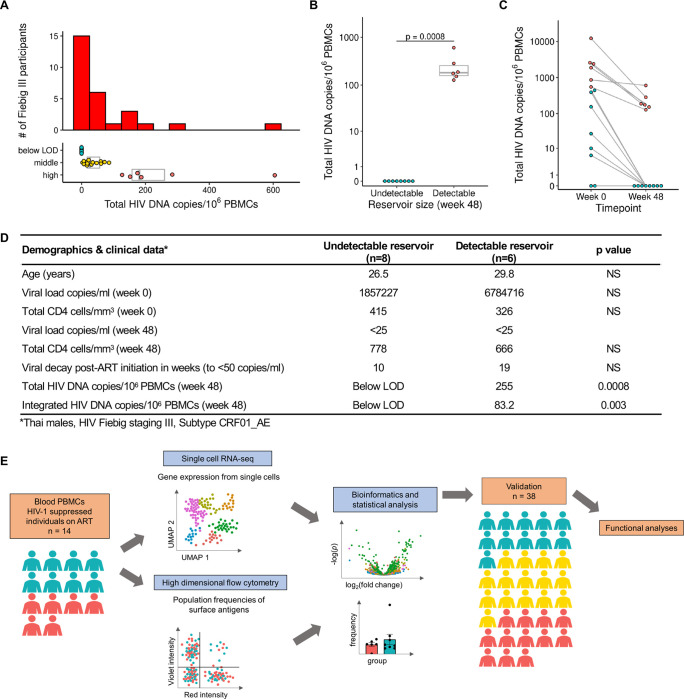
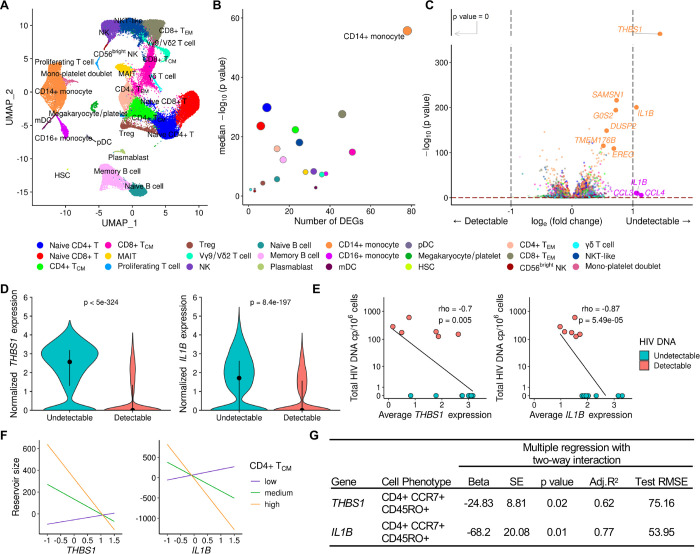
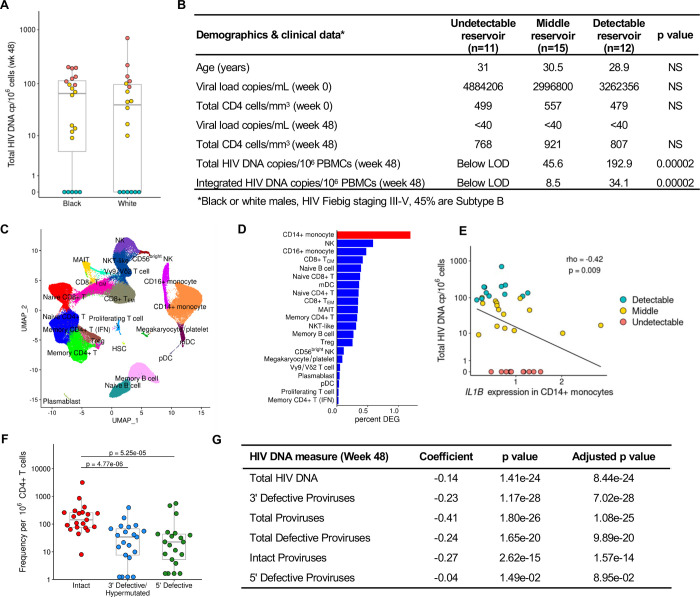
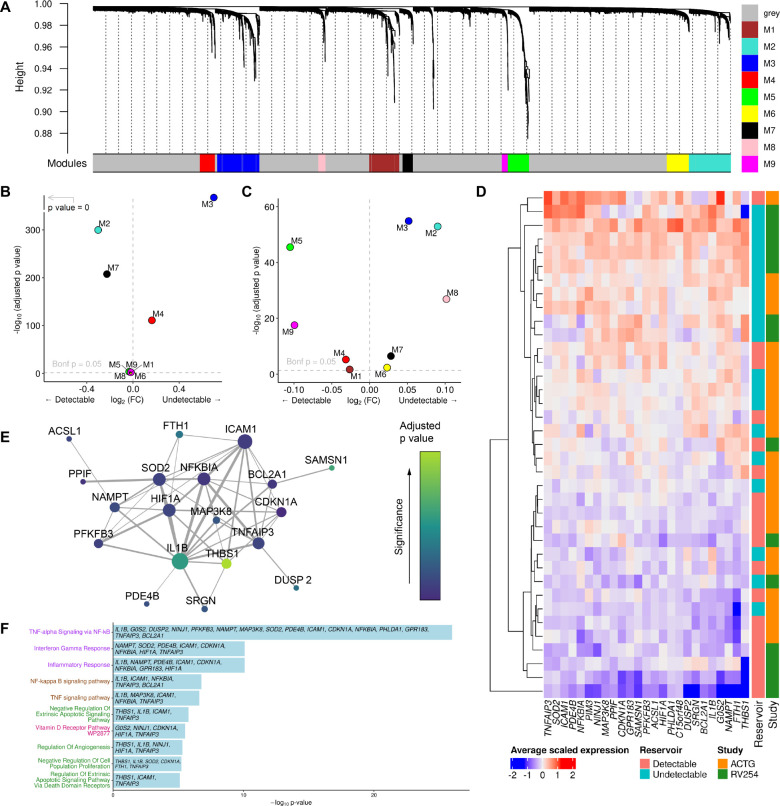
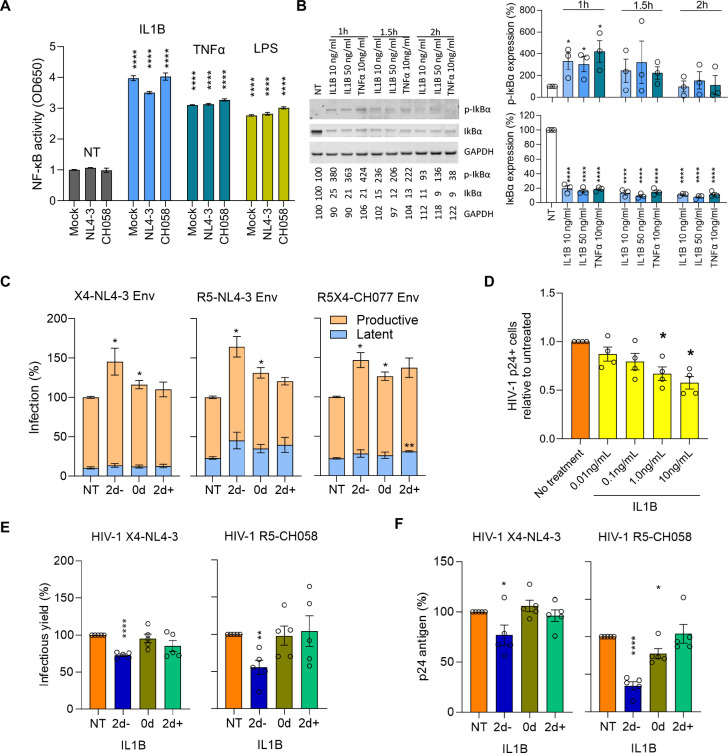
Elimination of latent HIV-1 is a major goal of AIDS research but the host factors determining the size of these reservoirs are poorly understood. Here, we investigated whether differences in host gene expression modulate the size of the HIV-1 reservoir during suppressive ART. Peripheral blood mononuclear cells (PBMC) from fourteen individuals initiating ART during acute infection who demonstrated effective viral suppression but varying magnitude of total HIV-1 DNA were characterized by single-cell RNA sequencing (scRNA-seq). Differentially expressed genes and enriched pathways demonstrated increased monocyte activity in participants with undetectable HIV-1 reservoirs. IL1B expression in CD14+ monocytes showed the greatest fold difference. The inverse association of IL1B with reservoir size was validated in an independent cohort comprised of 38 participants with different genetic backgrounds and HIV-1 subtype infections, and further confirmed with intact proviral DNA assay (IPDA®) measurements of intact HIV-1 proviruses in a subset of the samples. Modeling interactions with cell population frequencies showed that monocyte IL1B expression associated inversely with reservoir size in the context of higher frequencies of central memory CD4+ T cells, implicating an indirect effect of IL1B via the cell type well established to be a reservoir for persistent HIV-1. Signatures consisting of co-expressed genes including IL1B were highly enriched in the "TNFα signaling via NF-κB" geneset. Functional analyses in cell culture revealed that IL1B activates NF-κB, thereby promoting productive HIV-1 infection while simultaneously suppressing viral spread, suggesting a natural latency reversing activity to deplete the reservoir in ART treated individuals. Altogether, unbiased high throughput scRNA-seq analyses revealed that monocyte IL1B variation could decrease HIV-1 proviral reservoirs in individuals initiating ART during acute infection.


Figures

Figure 1.
Figure 1.. Characteristics of study participants and experimental design.
A) Distribution of total HIV DNA in Fiebig stage III participants in RV254 at week 48 after ART initiation and their categorization into three groups based on reservoir size. B) Selected participants from Fiebig stage III with extreme reservoir size phenotypes (undetectable = below LOD and detectable = high) of cell-associated total HIV DNA in the RV254 Thai discovery cohort (n=14). Significance was determined by the Mann-Whitney U test. C) Total HIV DNA decay between weeks 0 (AHI) and 48 (after ART initiation). D) Phenotypes of participants comprising the detectable versus undetectable reservoir size categories. Mean values are shown for each group, NS: not significant. E) Single-cell RNA-seq and multiparameter flow cytometry were performed on all 14 participants. Additional validation by scRNA-seq was performed in an independent AHI cohort from the USA (A5354) (n=38).
Figure 2.
Figure 2.. Differentially expressed genes in monocytes associate with HIV reservoir size during ART.
A) scRNA-seq identified 24 unique clusters of immune cell subsets. B) CD14+ classical monocytes have the highest number of DEG between the detectable and undetectable reservoir groups. Circle color represents cell subset while circle size indicates corresponding cell number. C) Volcano plot shows DEG in all cell types with p values that are significant after correction, as indicated above the horizontal dotted line. Labeled genes have a p<10e-6 and absolute average loge fold change ≥1 (vertical dotted lines) or p<10e-100 and absolute average loge fold change ≥0.5. D) The most significant DEG in CD14+ monocytes comparing reservoir groups. Black dots represent the median normalized gene expression values (loge), and lines represent the interquartile ranges. Teal: undetectable reservoir, red: detectable reservoir. Significance was determined by the Mann-Whitney U test with Bonferroni correction (n=14). E) Participant-specific categorical analyses of the most significant DEGs. Normalized gene expression within CD14+ monocytes was averaged per participant and correlation was determined by the Spearman test (n=14). F-G) Interaction plots of multiple regression between THBS1 or IL1B expression in monocytes and reservoir size with varying frequency of the CD4+ TCM population. Nominal p values are indicated for the interaction analyses.
Figure 3.
Figure 3.. Validation of IL1B association with smaller reservoir size from an independent cohort with a different infecting viral subtype across various Fiebig stages.
A) HIV DNA levels vary within the A5354 subtype B cohort from the USA (n=38). The participant samples used in this study are highlighted based on reservoir size: red=detectable; teal=undetectable and yellow=middle. Black and White indicate differences in ancestry of the participants. B) Characteristics of participants comprising the detectable, middle, and undetectable reservoir size categories (mean values are shown) and p values comparing the extreme phenotype groups. HIV-1 subtype information was only available for a subset of the participants. NS: not significant C) Dimensionality reduction plot of the different immune clusters in this cohort. D) CD14+ monocytes have the highest number of normalized DEG associated with reservoir size using a continuous analysis including all 38 participants. E) IL1B participant-specific average gene expression in CD14+ monocytes categorized by total HIV DNA (n=38). Spearman correlation p value and rho are shown. F) IPDA® measurements from a subset of the participants in this cohort (n=21). G) IL1B association with different reservoir type measurements (rows) from the participants with IPDA measurements (n=21).
Figure 4.
Figure 4.. Pathway analyses identifies a distinct signature associating with reservoir size.
A) Gene co-expression modules in CD14+ monocytes from the RV254 Thai study. B) IL1B is in the M3 WGCNA module which was enriched in cells from RV254 participants with undetectable reservoir based on the top 25 hub genes in the module (detectable=6, undetectable=8). C) Using the same module hub genes found in RV254, the M3 module was also enriched in cells from the undetectable reservoir participants in the A5354 cohort when HIV DNA levels were grouped categorically (detectable=12, undetectable=11). D) Average expression of the 25 top hub genes from the M3 module had generally higher expression in participants with undetectable reservoir in both cohorts. E) Predicted protein interaction network of top 25 hub genes using the STRING protein database. Larger nodes have higher degree of connectivity; node color indicates significance in the categorical DEG comparison between the detectable and undetectable groups in RV254 CD14+ monocytes. F) Gene ontology analyses of genes enriched in module M3 in CD14+ monocytes.
Figure 5.
Figure 5.. In vitro IL1B activates NF-κB, increases HIV proviral transcription, and inhibits spreading infection.
A) Effects of IL1B on NF-κB activity were assessed using A549 NF-κB reporter cells. Cultures were treated with IL1B, LPS, and TNFα and infected with VSV-pseudotyped NL4-3, CH058, or Mock control. After 24h the Alkaline Phosphatase Blue Microwell assay was performed with OD650 values relative to no treatment control (NT) reflecting NF-κB expression which is shown on the Y-axis. B) PBMC from 3 donors were treated with IL1B or TNFα and examined for IκBα phosphorylation as described in the methods section. Graphs present the protein expression from these donors; unpaired t test, *p<0.05, ****p<0.0001. C) Effects of IL1B in vitro when HIV was quantified after a single round of infection. Plots show the relative proportions of pMorpheus-V5 latently (blue) or productively (orange) infected PBMC in cultures treated with IL1B prior to, simultaneously, or after transduction with Env viral particles carrying the indicated Env protein. The data represent the average of 3 individual healthy donors, with error bars representing the average ±SEM, and statistical significance was established using unpaired t tests; *p<0.05, **p<0.002. D) Effects of IL1B on spreading HIV-1 infection in cell culture. Using HIV-1 YU-2, bar plots display the relative p24-positive cell fractions after pre-treatment with increasing concentrations of IL1B (from 0.01–10.0 ng/mL, 10-fold increments) across four different donors. E, F) Bar plots display the average infectious virus yields (E) and p24 antigen levels (F) at 4 days post-infection relative to the no IL1B treatment controls normalized to 100%; unpaired t test, *p<0.05, **p<0.002, ***p<0.0002. Corresponding replication curves are shown in Fig. S8.

References

    1. Richman D. D. et al. The challenge of finding a cure for HIV infection. Science 323, 1304–1307 (2009). 10.1126/science.1165706 - DOI - PubMed
    1. Li J. Z. et al. Time to Viral Rebound After Interruption of Modern Antiretroviral Therapies. Clin Infect Dis 74, 865–870 (2022). 10.1093/cid/ciab541 - DOI - PMC - PubMed
    1. Sengupta S. & Siliciano R. F. Targeting the Latent Reservoir for HIV-1. Immunity 48, 872–895 (2018). 10.1016/j.immuni.2018.04.030 - DOI - PMC - PubMed
    1. Finzi D. et al. Identification of a reservoir for HIV-1 in patients on highly active antiretroviral therapy. Science 278, 1295–1300 (1997). 10.1126/science.278.5341.1295 - DOI - PubMed
    1. Wong J. K. et al. Recovery of replication-competent HIV despite prolonged suppression of plasma viremia. Science 278, 1291–1295 (1997). 10.1126/science.278.5341.1291 - DOI - PubMed

Publication types