[Preprint]. 2024 Dec 3:2024.11.12.623191.
doi: 10.1101/2024.11.12.623191.

Influenza A virus transcription generates capped cRNAs that activate RIG-I

Influenza A virus transcription generates capped cRNAs that activate RIG-I

Elizaveta Elshina et al. bioRxiv. .

Abstract

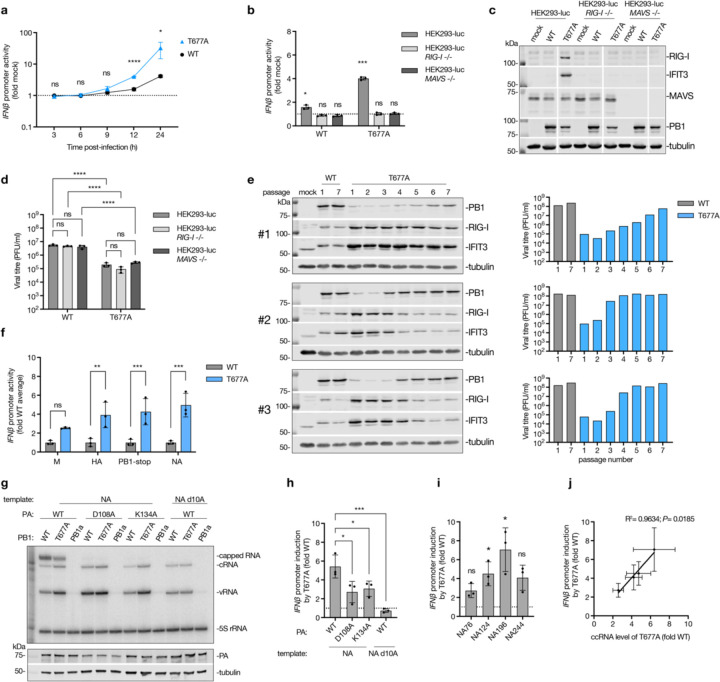
During influenza A virus (IAV) infection, host pathogen receptor retinoic acid-inducible gene I (RIG-I) detects the partially complementary, 5'-triphosphorylated ends of the viral genome segments and non-canonical replication products. However, it has also been suggested that innate immune responses may be triggered by viral transcription. In this study, we investigated whether an immunostimulatory RNA is produced during IAV transcription. We show that the IAV RNA polymerase can read though the polyadenylation signal during transcription termination, generating a capped complementary RNA (ccRNA), which contains the 5' cap of an IAV mRNA and the 3' terminus of a cRNA instead of a poly(A) tail. ccRNAs are detectable in vitro and in both ribonucleoprotein reconstitution assays and IAV infections. Mutations that disrupt polyadenylation enhance ccRNA synthesis and increase RIG-I-dependent innate immune activation. Notably, while ccRNA itself is not immunostimulatory, it forms a RIG-I agonist by hybridizing with a complementary negative-sense viral RNA. These findings thus identify a novel non-canonical IAV RNA species and suggest an alternative mechanism for RIG-I activation during IAV infection.


Conflict of interest statement

Competing interests

The authors declare no competing interests.

Figures

Fig. 1|
Fig. 1|. Characterization of non-canonical transcription termination and ccRNA synthesis.
a, Schematic of the IAV RNA polymerase bound to the viral promoter. b, Structural comparison of the PB1 β-ribbon and PB1 residues 676–678 in the bat IAV polymerase pre-initiation (PDB: 6T0N) and elongation (PDB: 6T0V) complexes. Hydrogen bonds formed by T677 and those involved in triple-stranded β-sheet formation are indicated by blue dotted lines. T677 is colored magenta, and other residues involved in triple-stranded β-sheet formation are colored dark blue. c, In vitro transcription assay with purified wild-type or T677A polymerases on a model NA71 template or NA71 with a disrupted U-stretch (NA71-U), with and without oligo d(T)20-RNase H treatment. d, In vitro transcription assay with purified wild-type or mutant polymerases on a model NA71 template. Inactive polymerase mutant (PB1a) was used as a negative control. e, Quantification of vRNA, cRNA and all capped RNA levels produced by the T677A mutant versus wild-type polymerase in an RNP reconstitution assay with full-length templates. Primer extension gel image is provided in Supplementary Fig. 2b f, RNP reconstitution assay with short segment 6-based templates: schematic of primer extension for cRNA and ccRNA with a terminal cRNA primer (NA 5′) (orange, top; ‘x’ indicates no binding to the mRNA); primer extension gel and western blot analysis of PB1 expression levels (middle); quantification of vRNA, cRNA and ccRNA levels produced by the T677A mutant versus wild-type polymerase (bottom). A representative primer extension gel for vRNA image is provided in Supplementary Fig. 3b. g, Enzymatic digestion of total RNA from RNP reconstitution with the NA196 template: schematic of primer extension with terminal (orange) and internal (green) primers (top left); primer extension gel (top right); quantification of cRNA, all capped RNA, and ccRNA levels post-decapping and XRN-1 treatment (bottom). h, Oligo d(T)25 bead-based depletion of polyadenylated RNAs in total RNA from an RNP reconstitution assay with the NA196 template: primer extension gel with terminal (NA 5′) and internal (NA c/mRNA mini) primers (top); quantification of cRNA, all capped RNA, and ccRNA levels post-treatment (bottom). Data in panels e-h are presented as mean ± SD from three independent experiments. Statistical significance was determined using a one-sample t-test; (ns=non-significant, *P<0.05, **P<0.01, ***P<0.001, ****P<0.0001).
Fig. 2|
Fig. 2|. Detection of ccRNA produced during IAV infection.
a, Schematic of TSO-based RT-PCR for analysis of 5ʹ cRNA termini. RT was done with a universal Tuni-13 or Tuni-13 LNA3 primer, which binds to the conserved 3ʹ cRNA termini of all eight segments, and in the presence of TSO. The TSO was appended by the RT enzyme to the 5ʹ termini of cDNA molecules. Subsequent PCR with a TSO-specific forward and segment-specific reverse primers was used to differentiate between cRNA with and without a 5ʹ extension. Gel electrophoresis of PCR products resolved faster-migrating bands (cRNA without 5ʹ extension) from slower-migrating bands (cRNA with a 5ʹ capped extension). b, Representative image of TSO-based RT-PCR analysis of infected A549 cells. Cells were infected with wild-type or T677A mutant viruses at an MOI of 0.3 or mock-infected for 24 hours. Total RNA was either treated or not with oligo d(T)25 beads. RT was conducted with Tuni-13 LNA3 primer (black, for cRNA and ccRNA) or an oligo d(T)20 primer (red, for mRNA). c, Quantification of ccRNA levels following oligo d(T)25-bead treatment. d, Quantification of ccRNA and mRNA synthesis by T677A versus wild-type viruses. ccRNA levels were quantified from samples post-oligo d(T)25-bead treatment, and mRNA levels were quantified from samples before oligo d(T)25-bead treatment. e, Analysis of 5ʹ cRNA extensions by TSO-based RT-PCR and NGS. A549 cells were infected by wild-type or T677A mutant A/WSN/33 virus at an MOI of 1 for 16 hours. The length of 5ʹ cRNA extension was expressed as a distance from the cRNA 5ʹ terminus to the TSO. The graph shows summed values for the NS segment from three biological replicates. f, Representative image of TSO-based RT-PCR analysis of RNA extracted 1 day post infection from three mouse lungs infected with A/Vietnam/1203/04 (H5N1) or one mock-infected with PBS. Total RNA was either depleted or not with oligo d(T)25 beads. RT was conducted with Tuni-13 LNA3 primer (black, for cRNA and ccRNA) or an oligo d(T)20 primer (red, for mRNA). Data in panels c and d are presented as mean ± SD from three independent experiments. Statistical significance was determined using a one-sample t-test; (ns=non-significant, *P<0.05, **P<0.01, ***P<0.001).
Fig. 3|
Fig. 3|. Impact of T677A mutation, transcription and ccRNA generation on IFN induction.
a, HEK293-luc cells were infected with either wild-type or T677A mutant A/WSN/33 viruses at an MOI of 3, or mock-infected, in a synchronized infection. IFN-β luciferase reporter activity was measured at various time points post-infection. b, Wild-type, RIG-I −/− or MAVS −/− HEK293-luc cells were infected with wild-type or T677A mutant viruses at an MOI of 3, or mock-infected. IFN-β luciferase reporter activity was measured at 12 hours post-infection. c, Wild-type, RIG-I −/− or MAVS −/− HEK293-luc cells were infected with wild-type or T677A mutant viruses at an MOI of 0.01, or mock-infected for 48 hours. Protein expression was analyzed by western blotting. A representative image from three independent experiments is shown. d, Viral titers in cell culture supernatants collected as described in panel c, were quantified by plaque assay. e, Wild-type and T677A mutant A/WSN/33 viruses were serially passaged seven times in A549 cells at an MOI of 0.01. Supernatants and protein samples were collected 48 hours post-infection for each passage. Viral titers were determined by plaque assay, and ISG and PB1 expression levels were assessed by western blotting. Only passages 1 and 7 are shown for the wild-type virus. f, RNP reconstitution assay with wild-type and T677A polymerases were performed in HEK293T cells using IFN-β luciferase reporter and four different viral segments. IFN-β promoter activation was measured 24 hours post-transfection. g, RNP reconstitution assay were conducted with wild-type or T677A PB1, wild-type or transcriptionally inactive mutants of PA (D108A and K134A) and segment 6 (NA) template. The NA template lacking the 10th adenosine from the 5ʹ terminus, which prevents transcription, was also tested. Primer extension was performed with internal +sense (NA 160) and –sense (NA 1280) primers, and a representative gel image from three independent experiments is shown. PA expression was analyzed by western blotting. h, IFN-β promoter activation by T677A versus wild-type polymerases in the RNP reconstitution assay described in panel g. i, IFN-β promoter activation by T677A versus wild-type polymerases in RNP reconstitution assay with short segment 6-based templates described in Fig. 1f. j, Correlation between IFN-β promoter activation and ccRNA synthesis levels from short segment 6-based templates in the RNP reconstitution assay described in Fig. 1f. Data in a, b, d, f, h-j are presented as mean ± SD from three independent experiments. Statistical significance was determined using a one-way ANOVA with Dunnett’s multiple comparisons test (a, h), two-way ANOVA with Šídák's multiple comparisons test (f) or Tukey’s multiple comparisons test (d), one-sample t-test (b, i) and simple linear regression analysis (j); (ns=non-significant, *P<0.05, **P<0.01, ***P<0.001, ****P<0.0001).
Fig. 4|
Fig. 4|. Mechanism of RIG-I activation by ccRNA.
a, Myc-tagged RIG-I was co-expressed with wild-type or T677A mutant RNP and segment 6 (NA) template in HEK293T cells, followed by immunoprecipitation. A phosphate-binding mutant of RIG-I was used as a negative control. RNA levels in total and immunoprecipitated (IP) fractions were measured by primer extension with internal +sense (NA 160) and -sense (NA 1280) primers, and protein levels were assessed by western blotting. Shown are a representative image from three independent experiments (left) and quantification (right). b, Immunoprecipitation of wild-type, phosphate-binding mutant, or ATPase mutant Myc-tagged RIG-I was performed in an RNP assay with a short NA196 template. An empty plasmid served as a negative control. RNA levels were quantified by primer extension assay with terminal cRNA (NA 5′) and vRNA (NA-2) primers and protein levels assessed by western blotting. Representative image from three independent experiments (top) and quantification (bottom) are presented. c, HEK293-luc cells were transfected with a two-fold dilution series of in vitro transcribed NA196-based vRNA, cRNA, ccRNA, ccRNA-3ʹ, or mRNA, starting at 0.2 pmol. IFN-β promoter activity was measured 20 hours post-transfection. d, Increasing concentrations (0.05, 0.1 and 0.2 pmol) of in vitro transcribed NA196-based dephosphorylated cRNA, ccRNA, ccRNA-3ʹ and mRNA were co-transfected with 1 pmol of segment 6 svRNA into HEK293-luc cells. Total 293T RNA (mock) was used as a negative control and MAVS-encoding plasmid was used as a positive control. IFN-β promoter activity was measured 20 hours post-transfection. e, 0.2 pmol of in vitro transcribed NA196-based ccRNA or ccRNA-3ʹ or equivalent amount of total 293T (mock) RNA was co-transfected with pPolI plasmids encoding 47–196 nt long segment 6-based vRNA templates or segment 5-based NP197 template in to HEK293-luc cells. An empty pPolI plasmid was used as a negative control, while MAVS-encoding plasmid was used as a positive control. IFN-β promoter activity was measured 20 hours post-transfection. f, ATPase activity of recombinant RIG-I was assessed in the presence of in vitro transcribed NA196-based vRNA, dephosphorylated vRNA, cRNA, dephosphorylated cRNA, ccRNA or ccRNA-svRNA complex. Data in panels a-f are presented as mean ± SD from three or four independent experiments. Statistical significance was determined using two-way ANOVA with Šídák's multiple comparisons test (a, center; b, bottom left; d; e) or an unpaired two-tailed t-tests (a, right; b, bottom right; f) (ns=non-significant, *P<0.05, **P<0.01, ***P<0.001, ****P<0.0001).

Similar articles

References

    1. Kash J. C. & Taubenberger J. K. The role of viral, host, and secondary bacterial factors in influenza pathogenesis. The American journal of pathology 185, 1528–1536 (2015). 10.1016/j.ajpath.2014.08.030 - DOI - PMC - PubMed
    1. Gounder A. P. & Boon A. C. M. Influenza Pathogenesis: The Effect of Host Factors on Severity of Disease. J Immunol 202, 341–350 (2019). 10.4049/jimmunol.1801010 - DOI - PMC - PubMed
    1. Kato H. et al. Differential roles of MDA5 and RIG-I helicases in the recognition of RNA viruses. Nature 441, 101–105 (2006). 10.1038/nature04734 - DOI - PubMed
    1. Opitz B. et al. IFNbeta induction by influenza A virus is mediated by RIG-I which is regulated by the viral NS1 protein. Cell Microbiol 9, 930–938 (2007). 10.1111/j.1462-5822.2006.00841.x - DOI - PubMed
    1. Loo Y. M. et al. Distinct RIG-I and MDA5 signaling by RNA viruses in innate immunity. J Virol 82, 335–345 (2008). 10.1128/JVI.01080-07 - DOI - PMC - PubMed

Publication types

LinkOut - more resources