[Preprint]. 2024 Nov 23:2024.11.22.624728.
doi: 10.1101/2024.11.22.624728.

Arginyltransferase1 drives a mitochondria-dependent program to induce cell death

Affiliations

Arginyltransferase1 drives a mitochondria-dependent program to induce cell death

Akhilesh Kumar et al. bioRxiv. .

Update in

Abstract

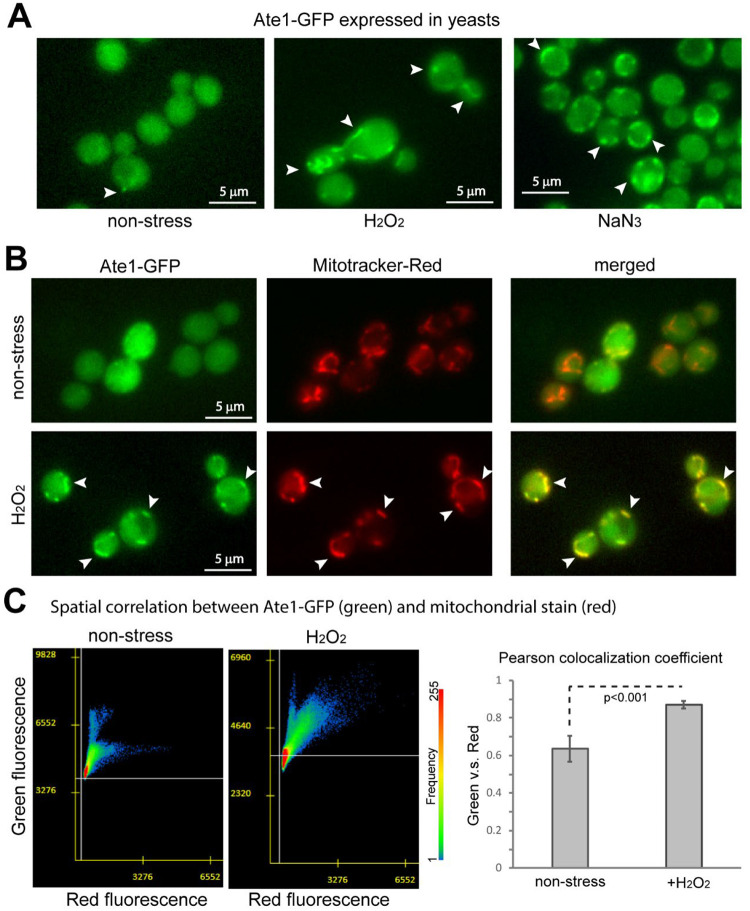
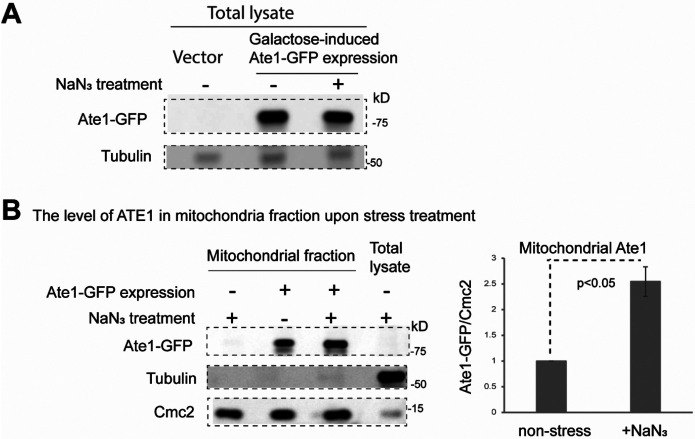
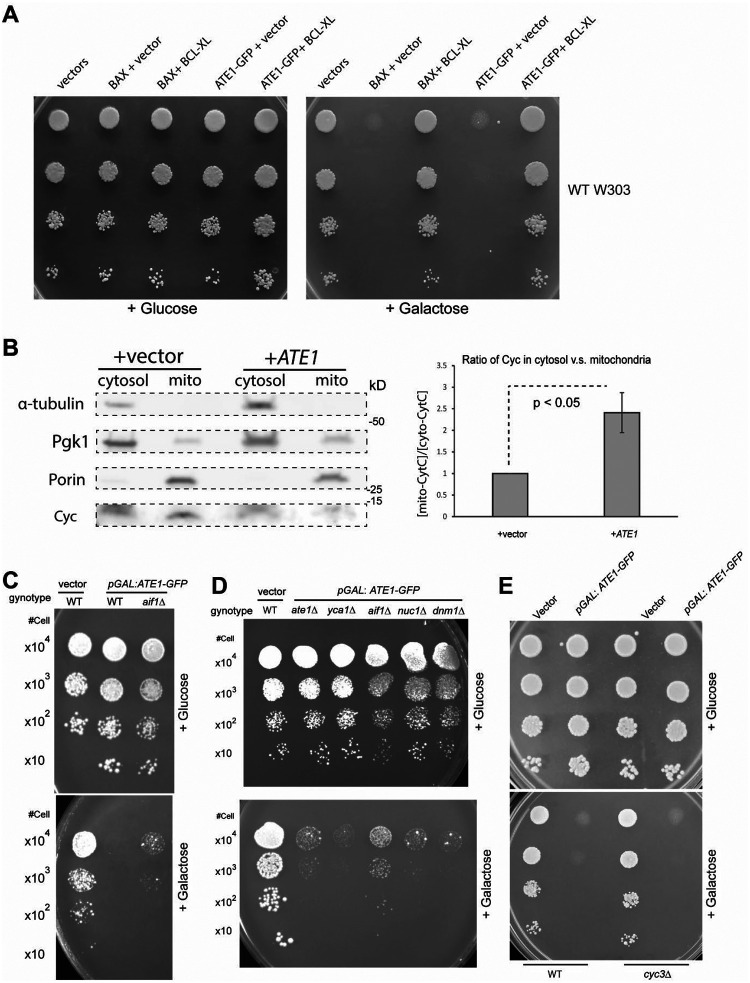
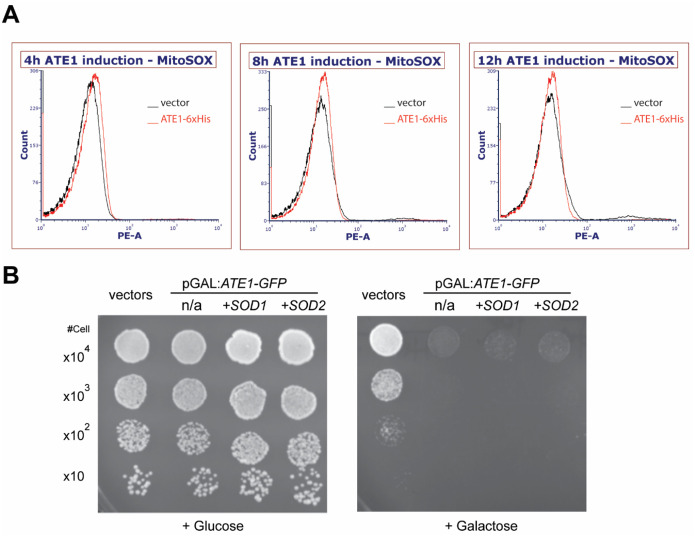
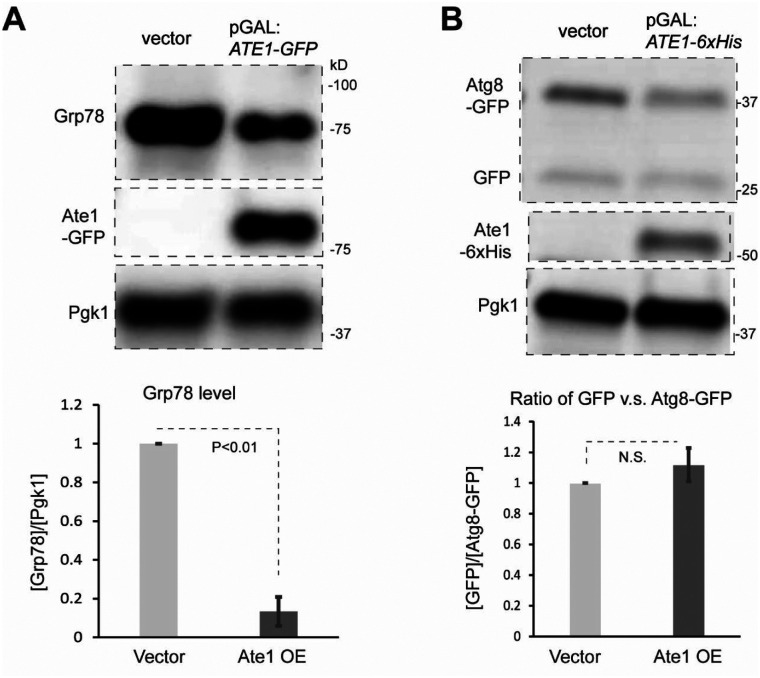
Cell death regulation is essential for stress adaptation and/or signal response. Past studies have shown that eukaryotic cell death is mediated by an evolutionarily conserved enzyme, arginyltransferase1 (Ate1). The downregulation of Ate1, as seen in many types of cancer, prominently increases cellular tolerance to a variety of stressing conditions. Conversely, in yeast and mammalian cells, Ate1 is elevated under acute oxidative stress conditions and this change appears to be essential for triggering cell death. However, studies of Ate1 were conventionally focused on its function in inducing protein degradation via the N-end rule pathway in the cytosol, leading to an incomplete understanding of the role of Ate1 in cell death. Our recent investigation shows that Ate1 dually exists in the cytosol and mitochondria, the latter of which has an established role in cell death initiation. Here, by using budding yeast as a model organism, we found that mitochondrial translocation of Ate1 is promoted by the presence of oxidative stressors and is essential for inducing cell death with characteristics of apoptosis. Also, we found that Ate1-induced cell death is dependent on the formation of the mitochondrial permeability pore and at least partly dependent on the action of mitochondria-contained factors including the apoptosis-inducing factor, but is not directly dependent on mitochondrial electron transport chain activity or its derived reactive oxygen species (ROS). Furthermore, our evidence suggests that, contrary to widespread assumptions, the cytosolic protein degradation pathways including ubiquitin-proteasome, autophagy, or endoplasmic reticulum (ER) stress response has little or negligible impacts on Ate1-induced cell death. We conclude that Ate1 controls the mitochondria-dependent cell death pathway.

Keywords: Arginylation; Ate1; apoptosis; arginyltransferase; mitochondrial; posttranslational modification; programmed cell death; ubiquitination.


Figures

Figure 1.
Figure 1.. Visualization of Ate1 colocalization with mitochondria upon treatments of oxidative stressors.
(A) Representative fluorescence microscopic images showing the signal of Ate1 tagged with GFP, which is driven by the endogenous ATE1 promoter at the native chromosome locus. The yeast cells were either treated with 5mM H2O2 or 5% NaN3, or not treated with anything (nonstress). The observation started promptly within 5 minutes of treatments. The BY4741 strain yeast was used for tests in all figures unless otherwise indicated. (B) The above mentioned Ate1-GFP expressing yeast cells were treated with stressors H2O2 (5mM) and stained with mitochondria-specific dye Mitoracker-Red. Arrow point to several locations where obvious colocalization of the green and red fluorescent signals are observed. (C) To quantify the mitochondrial translocation of Ate1 under stressing conditions, Pearson colocalization coefficient analysis was used to measure the relative colocalization of GFP tagged Ate1 and mitochondria-specific dye (Mitotracker-red) in non-stressing and stressing conditions.
Figure 2.
Figure 2.. Oxidative stress induced by NaN3 increases mitochondrial Ate1 localization.
(A) Representative Western blot showing total levels of Ate1-GFP in W303 wild-type strain treated either with or without 5%NaN3 for 30 minutes. Ate1-GFP expression was induced by the addition of 0.5% galactose and incubation for 3 hours at 30°C. Empty vector serves as a negative control. Alpha tubulin is used for protein loading control. (B) Left panel; representative Western blot showing Ate1-GFP levels in purified mitochondrial fractions, which was treated with proteinase K (5 μg/ml) to remove proteins that are not protected by the mitochondrial membrane. Alpha-tubulin is used as a marker for cytosolic protein contamination, while mitochondrial intermembrane space protein Cmc2 serves as a marker for mitochondrial proteins. Right panel: showing the quantification of mitochondrial Ate1-GFP levels normalized to mitochondrial protein Cmc2. Error bar denotes SD (N=4), p values were calculated by two tailed student t-test.
Figure 3.
Figure 3.. The mitochondrial translocation of Ate1 is essential for the cell death induced by Ate1 over-expression.
(A) Yeast cells containing Ate1-GFP and Ate1-GFP-Ras2 that are driven by galactose-inducible promoters (pGal) were allowed to express for 6 hours and then briefly treated with oxidative stressor H2O2 for 10 minutes before the microscopic images were taken for the green fluorescence channel. The regular Ate1-GFP forms puncta-like structures similar as shown in Fig.1, while Ate1-GFP-Ras2 remains localized to the periphery of the cells. (B) Scheme illustrating the principle of the reporter for the arginylation activity inside yeast cells. The N-terminal ubiquitin domain of the reporter protein DD-β15-mCherryFP will be promptly removed by endogenous de-ubiquitination (de-Ub) enzymes in the cell, exposing the penultimate peptide DD-β15, which is derived from the N-terminus of mouse β-actin and is known to be arginylated in vivo[9, 39]. The arginylated N-terminus can be recognized with a specific antibody anti-RDD[9]. Antibodies for mCherryFP (mChFP) and GFP can be used to probe the levels of the reporter protein and the GFP-fused ATE1, respectively. (C) To test the arginylation activity of different forms of Ate1 (Ate1-GFP or Ate1-GFP-Ras2), they were expressed in ate1Δ yeast (to avoid the interference of endogenous ATE1), which was also simultaneously expressing the reporter protein DD-β15-mCherryFP. The arginylation level of the reporter protein was measured as described in (B). Pgk1 serves as loading controls for the yeast proteins. (D) Growth test of ate1Δ yeast cells carrying either the empty expression vector or pGAL1:Ate1-GFP and pGAL1:Ate1-GFP-Ras2 was conducted by a serial dilution growth assay on either plate containing glucose or galactose, where the expression of Ate1 is not induced or induced, respectively. (E) Representative Western blots showing the expression levels and distributions of different Ate1 constructs (Ate1-GFP and the mitochondrial matrix-targeting Mt-Ate1-GFP) in total cell lysate (left panel) and in purified mitochondrial fractions (right panel). Vector alone served as a negative control. The expression of both the Ate1 construts was achieved by adding 0.5% galactose and incubated for 3hrs at 30°C. The expressions and subcellular distributions Ate1-GFP and Mt-Ate1-GFP were probed by anti-GFP. The level of Pgk11 and Cmc2 were used as loading controls for total proteins or mitochondrial proteins, respectively. (F) Growth test of ate1Δ yeast cells carrying either the empty expression vector, pGAL1:Ate1-GFP, or the mitochondria matrix localized Ate1 (pGAL1: Mt-Ate1-GFP) by a serial dilution growth assay on either plate containing galactose or glucose for the induced expression (or not) of Ate1. Note that the concentration of galactose (0.5%) is lower than elsewhere to allow the display of the difference between the Ate1-GFP and mt-Ate1-GFP. Plates were incubated at 30°C and images were taken after 3 days.
Figure 4.
Figure 4.. Ate1-overexpression triggers apoptosis with a dependency on mitochondrial permeability transition pore (mPTP)
A) Representative microscopic images displaying the presence of DNA fragmentations probed by the TUNEL assay on ate1Δ yeasts that were induced by galactose for the expression of Ate1-6xHIS (or the empty vector). The panels on the left display only the TUNEL signal (green fluorescence), while the panels on the right are an overlay of TUNEL and Differential Interference Contrast (DIC) microscopic images. B) A diagram showing some of the key components in yeasts that affect mPTP and apoptosis. Note that the Bcl-XL is not an endogenous protein of yeast, but it can interact with the mitochondrial outer membrane permeabilization (MOMP) event[50]. C) Growth of yeast cells (WT, aac1Δ, aac2Δ¸ aac3Δ, all on W303 strains) carrying either the empty expression vector (vector) or pGAL1:Ate1-GFP (+Ate1-GFP) was measured by a serial dilution growth assay on either plate containing 2% glucose or 2% galactose, where the expression of Ate1 is not induced or induced, respectively. Plates were incubated at 30°C and images were taken after 2–3 days. D) Similar to (B), except that WT and mir1Δ yeasts were used. E) Serial dilution growth assay to assess changes in growth of WT yeast induced with pGAL: Ate1-GFP in the context of various ATP synthase inhibitors. Yeasts were grown in raffinose-containing liquid media before being washed, serially diluted in H20, and plated to either glucose or galactose-containing plates with the designated concentrations of inhibitors. Plates were allowed to grow three days before images were taken. DMSO (at a final concentration < .004%) was used as vehicle control for Oligomycin A and Quercetin.
Figure 5.
Figure 5.. Ate1-induced cell death involves mitochondrial outer membrane permeabilization.
A) Growth of yeast cells (W303 strain, WT) carrying either the empty expression vectors (pYES2-URA3 and pBF339-TRP1 vectors), or the galactose-inducible mouse BAX (pBM272-pGAL-BAX-URA3) and yeast Ate1 (pYES2-pGAL-ATE1-GFP-Ura3) in the presence of constitutively expressing Bcl-xL (pBF339-ADH-BCLxL-TRP1) or the vector (pBF339-TRP1) was measured by a serial dilution growth assay on either plate containing 2% glucose or 2% galactose, where the expression of Ate1 or Bax is not induced or induced, respectively. Plates were incubated at 30°C and images were taken after 3 days. B) Representative Western blots displaying changes in the distribution of cytochrome c (Cyc) between mitochondria and cytosol in yeast cell where Ate1-6xHis was induced for expression with 2% galactose in Ura-minus liquid media for 6 hours at 30°C. The separated cytosolic fraction and mitochondrial fraction were compensated by buffer to be equal volume before analysis. Alpha-tubulin and Porin (VDAC) were used as markers to display the purity of cytosolic and mitochondrial fractions, respectively. Pgk1 was used as a loading control. The quantification of the blot was based on n = 6; error bars represent S.E.M. C) Growth of yeast cells (WT or aif1Δ) carrying either the empty expression pYES2 vector (vector) or pYES-pGAL1:ATE1-GFP (+Ate1-GFP) was measured by a serial dilution growth assay on either plate containing 2% glucose or 2% galactose, where the expression of Ate1 is not induced or induced, respectively. Plates were incubated at 30°C and images were taken after 3–5 days. D) Similar to (C), except that WT, aif1Δ, ate1Δ¸ yca1Δ, nuc1Δ, and dnm11Δ) yeasts were used. E) Similar to (C), except that WT and cyc3Δ yeasts were used.
Figure 6.
Figure 6.. The mitochondrial respiratory activity is not directly required during Ate1-driven cell death.
A) The membrane potentials in yeast cells, WT or rip1Δ, were probed by staining dyes Mitotrackerred (red) or rhodamine 123 (green). B) Growth of yeast cells (WT, rip1Δ or ndi1Δ) carrying either the empty expression vector pYES2 (vector) or pYES2-pGAL1:ATE1-GFP (+Ate1-GFP) was measured by a serial dilution growth assay on either plate containing 2% glucose or 2% galactose, where the expression of Ate1 is not induced or induced, respectively. Plates were incubated at 30°C and images were taken after 3–5 days.
Figure 7.
Figure 7.. Mitochondrial ROS is not directly required during the Ate1-driven cell death.
A) Representative flow cytometry plots depicting mitochondrial ROS levels at indicated timepoints after galactose induction. The yeast cells contain either the empty vector control pYES2 (black) or the pYES2-ATE1-6xHis for the overexpression of the 6xHis tagged Ate1 (red). MitoSOX Red was used to stain for mitochondrial ROS, and samples were excited with a 488 nm blue laser and emission was measured using a 585 nm filter with a 42 nm bandpass. No obvious differences in mitochondrial ROS were noted between Ate1 and control samples, in any of the time points. B) Growth of yeast cells (ate1Δ) carrying either the empty expression vectors pYES2-URA + pGPD2-Leu2 (vectors), pYES2-pGAL1:ATE1-GFP + pGPD2-Leu2 (n/a), or pYES2-pGAL1:ATE1-GFP in the presence of constitutively expression vectors of pGPD2-SOD1-Leu2 or pGPD2-SOD2-Leu2 (+ SOD1, or +SOD2). The growth rate was measured by a serial dilution growth assay on Ura-minus, Leu-minus SD plates containing 2% glucose or 2% galactose, where the expression of Ate1 is not induced or induced, respectively. Plates were incubated at 30°C and images were taken after 3 days.
Figure 8.
Figure 8.. Ate1-overexpression does not lead to elevation of global ubiquitination and Ate1-induced cell death is not directly dependent on the functions of the ubiquitin-proteasome system
A) Representative Western blots depicting global ubiquitination levels in ate1Δ yeast with either pYES2-pGAL:ATE1-GFP-URA3 (pGAL:ATE1-GFP) or empty vector, which were induced for 6h with 2%galactose in liquid media. Pgk1 was used as a loading control. Images are from same gel. B) Representative Western blot showing the expression levels of cytosolic stress response protein HSP70 in the yeast cells carrying the pYES2-pGAL:ATE1-6xHis-URA3 expression vector or the empty control vector, which were induced with 2% galactose for 6h in liquid media. The level of Ate1 was probed with antibody against 6xHis tag. Right side panel shows the densitometric analysis of the cytosolic Hsp70 levels as expressed in fold difference after normalization to the internal protein loading control Pgk1. Error bar denotes SEM; N=6. C) Growth assay of WT, ump1Δ or ubr1Δ yeast carrying either pYES2-pGAL:ATE1-GFP-URA3 or empty vector. The growth was measured by a serial dilution growth assay on Ura-minus SD plates containing 2% glucose or 2% galactose, where the expression of Ate1 is non-induced or induced, respectively. Plates were incubated at 30°C and images were taken after 3 days.
Figure 9.
Figure 9.. Ate1 overexpression does not significantly increase Endoplasmic Reticulum (ER) stress response or the autophagy degradation pathways.
A) Top panel shows the representative Western blot for the level of Grp78/HDEL, a maker of the endoplasmic reticulum stress response, in yeast cells carrying the pYES2-pGAL:ATE1-6xHis-URA3 expression vector or the empty control vector, which were induced with 2% galactose for 6h in liquid media. Pgk1 is used as loading controls. Ate1 was probed with anti-GFP. Bottom panel is a graph indicating the fold differences in GRP78 levels between the Ate1 overexpression (OE) and vector control. Error bar denotes SEM (N=3). B) Top panel shows representative Western blot for the level of full-length Atg8-GFP and the derivative GFP, which is resulted form proteolysis in autophagy. The yeast cells carrying the pYES2-pGAL:ATE1-6xHis-URA3 expression vector or the empty control vector were induced with 2% galactose for 6h in liquid media. Pgk1 is a loading control. Bottom panel is a graph indicating the fold differences in the ratio between GFP and the full-length Atg8-GFP, which reflects the activity of autophagy, in the presence of Ate1 overexpression (OE) and vector control. Error bar denotes SEM (N=3).

References

    1. Kaji H., Novelli G.D., and Kaji A., A Soluble Amino Acid-Incorporating System from Rat Liver. Biochim Biophys Acta, 1963. 76: p. 474–7. - PubMed
    1. Bachmair A., Finley D., and Varshavsky A., In vivo half-life of a protein is a function of its amino-terminal residue. Science, 1986. 234(4773): p. 179–86. - PubMed
    1. Varshavsky A., The N-end rule pathway and regulation by proteolysis. Protein Sci, 2011. - PMC - PubMed
    1. Chakraborty G., et al. , Posttranslational protein modification by amino acid addition in regenerating optic nerves of goldfish. J Neurochem, 1986. 46(3): p. 726–32. - PubMed
    1. Shyne-Athwal S., et al. , Protein modification by amino acid addition is increased in crushed sciatic but not optic nerves. Science, 1986. 231(4738): p. 603–5. - PubMed

Publication types

LinkOut - more resources