[Preprint]. 2024 Nov 15:2024.11.15.623791.
doi: 10.1101/2024.11.15.623791.

Identification of Novel Modulators of the ALT Pathway Through a Native FISH-Based Optical Screen

Affiliations

Identification of Novel Modulators of the ALT Pathway Through a Native FISH-Based Optical Screen

Benura Azeroglu et al. bioRxiv. .

Update in

Abstract

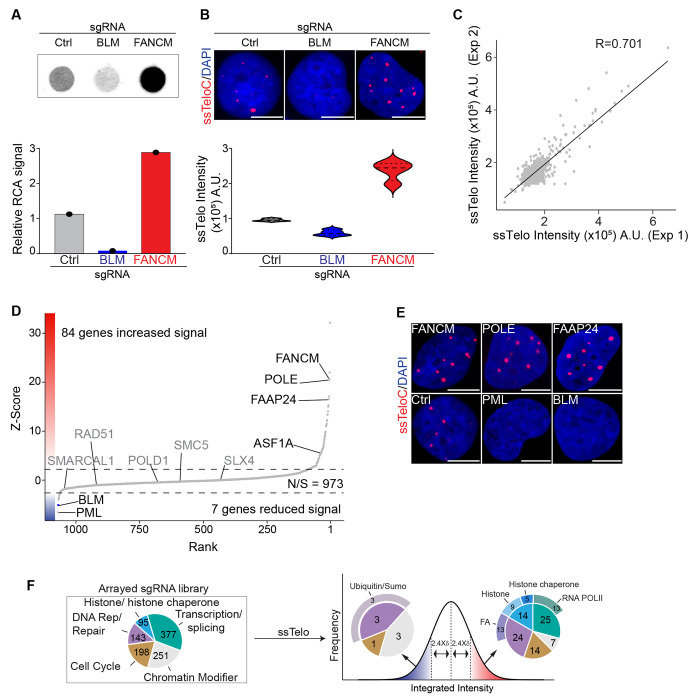
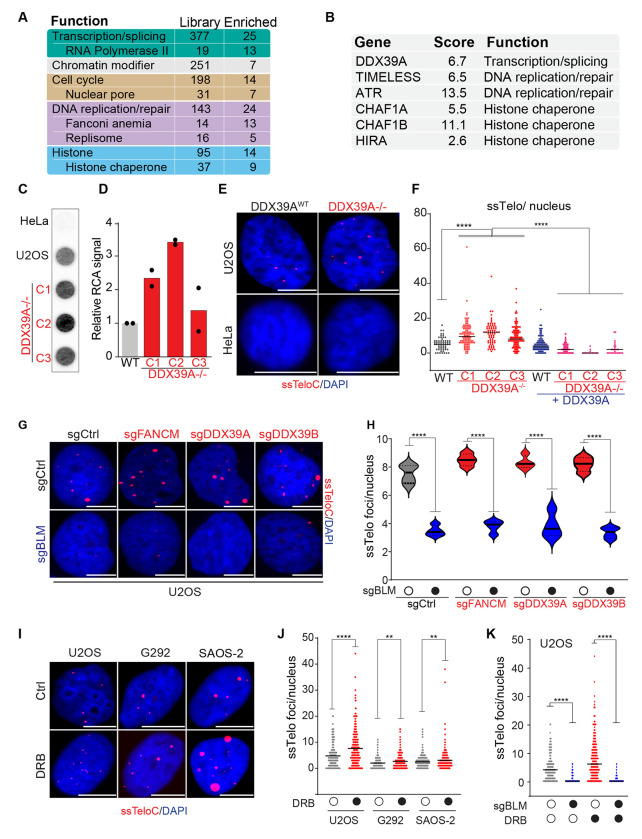
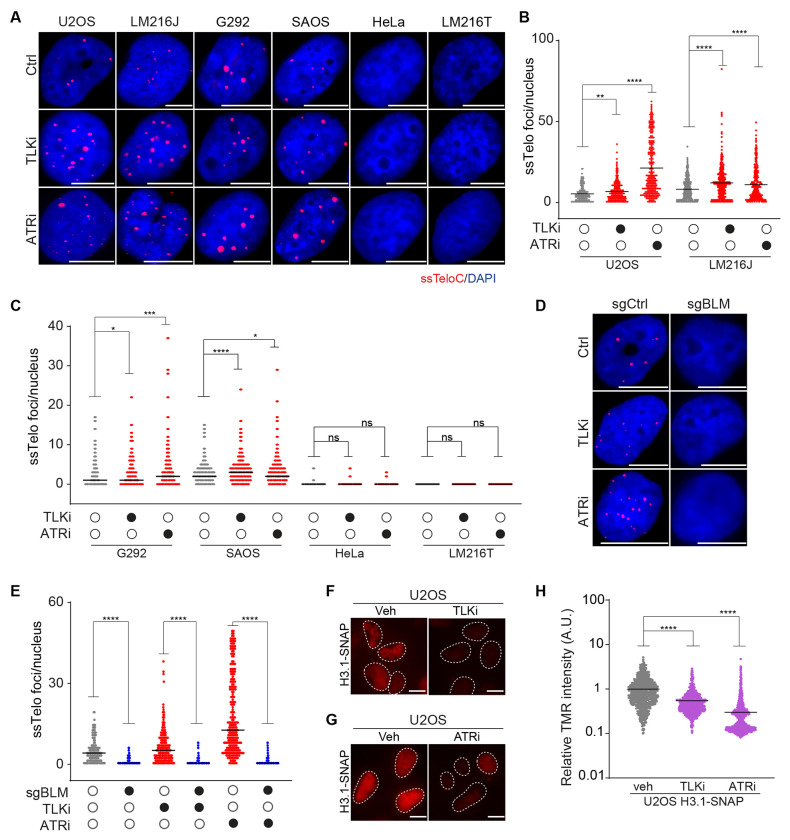
A significant portion of human cancers utilize a recombination-based pathway, Alternative Lengthening of Telomeres (ALT), to extend telomeres. To gain further insights into this pathway, we developed a high-throughput imaging-based screen named TAILS (Telomeric ALT In situ Localization Screen), to identify genes that either promote or inhibit ALT activity. Screening over 1000 genes implicated in DNA transactions, TAILS revealed both well-established and novel ALT modulators. We have identified new factors that promote ALT, such as the nucleosome-remodeling factor CHD4 and the chromatin reader SGF29, as well as factors that suppress ALT, including the RNA helicases DDX39A/B, the replication factor TIMELESS, and components of the chromatin assembly factor CAF1. Our data indicate that defects in histone deposition significantly contribute to ALT-associated phenotypes. Based on these findings, we demonstrate that pharmacological treatments can be employed to either exacerbate or suppress ALT-associated phenotypes.

Keywords: ALT; DDX39A; histone deposition; ssTelo; telomeres.


Conflict of interest statement

Declaration of interests The authors declare no competing interests.

Figures

Fig 1:
Fig 1:. TAILS identifies novel modulators of ALT
A Rolling circle assay (RCA) analysis of genomic DNA isolated from U2OS cells transfected with the sgRNA and relative quantification. B Example of TAILS data and quantification; U2OS cells transfected with indicated sgRNA were processed as described in the TAILS pipeline. The scale bar is 10 μm. C TAILS analysis in ALT-positive U2OS cells. The ssTelo intensity derived from two biological replicates of the arrayed sgRNA library. Linear regression analysis by Pearson correlation coefficient (R) was calculated, and it is 0.701. D Scatter plot displaying mean Z-score for each gene assayed (y-axis) and the relative ranking based on descending Z-score (x-axis). Dotted lines indicate the cut-off value (+/−2.4) chosen to identify putative hits. Genes that have previously been reported to affect ALT activity are indicated. E Images obtained by TAILS of hits selected known modulators of ALT. The scale bar is 10 μm. F Gene function classification of all the genes contained in sgRNA library (left diagram) and of the hits identified by TAILS (right diagrams). For more information, see Supplementary Table 1.
Fig 2:
Fig 2:. SGF29, CHD4 and SUMOylation are required for ALT activity
A Scatter plot shows the Z-score for genes identified by TAILS as putative ALT-activators. B Gene function classification of the genes displayed in panel A. C-D ssTelo staining and relative quantification of U2OS cells infected with shRNA against SGF29 (shSGF29-1, shSGF29-2, and shSGF29-3) or control (WT). E-F ssTelo staining and relative quantification of U2OS cells transfected with siRNA against CHD4 (siCHD4-1 and siCHD4-2) or a non-targeting control (siCtrl). G U2OS cells transfected with siRNA against CHD4 (siCHD4-1) or a non-targeting siRNA (siCtrl) were stained for PML (red) and TRF2 (green). H U2OS cells co-transfected with vectors expressed CHD4-GFP (green) and either WT or catalytically-dead (D480A) TRF1-FokI-mCherry (red). I Quantification of data shown in G with graphs indicating the percentage of cells with at least 3 PML-TRF2 colocalizations (APBs) per nucleus, defined as two foci overlapping by 50% or more. J Quantification of data shown in H with graphs indicating the percentage of cells with at least 3 CHD4-TRF1-FokI colocalizations per nucleus, defined as two foci overlapping by 50% or more. K ssTelo staining of ALT-positive U2OS, SAOS-2 and G292 cells treated with SUMOi compared to untreated sample. L Quantification of ssTelo analysis shown in K and S2H. The scale bar is 10 μm. An unpaired t-test was used for statistical analysis; P ≤ 0.05 indicated as *, P ≤ 0.001 indicated as ***, P ≤ 0.0001 indicated as **** on the graphs.
Fig 3:
Fig 3:. The RNA helicases DDX39A/B are ALT-suppressors
A Gene function composition of the arrayed sgRNA library (Library) and of the number genes that were identified as putative ALT suppressors by TAILS (Enriched). B List of ALT-suppressor genes that were further characterized in this study. The table reports the average Z-score (Score) and gene function category (Function). C-D Rolling circle assay (RCA) analysis of genomic DNA isolated from 3 independent DDX39A−/− clones (C1, C2 and C3) and the parental U2OS cells (WT). E-F Representative images and quantification of DDX39A-deficient and - proficient cells in ALT-positive U2OS and ALT-negative HeLa backgrounds. The scale bar is 10 μm. G ssTelo staining of U2OS cells transfected with sgRNAs against FANCM, DDX39A, DDX39B and a non-targeting control (sgCtrl) in the presence of absence of sgRNA against BLM. The scale bar is 10 μm. H Quantification of the data shown in G. I-J Representative images and quantification of ssTelo analysis ALT-positive U2OS, G292 and SAOS-2 cells treated with transcription inhibitor DRB. The scale bar is 10 μm. K Quantification of ssTelo analysis U2OS cells treated with DRB in the presence of absence of sgRNA against BLM. For representative images, see Figure S4C. An unpaired t-test was used for statistical analysis; P ≤ 0.01 indicated as **, P ≤ 0.0001 indicated as **** on the graphs.
Fig 4:
Fig 4:. Reduced histone deposition elevates ssDNA at ALT-positive telomeres
A-B Representative images and quantification of ssTelo staining U2OS cells treated with siRNAs against either CHAF1B or HIRA histone chaperones encoding genes. C Quantification of de novo histone deposition in U2OS cells treated with siRNAs against either CHAF1B, HIRA or a non-targeting control (siCtrl). TMR intensity levels are quantified and averaged, normalized to samples treated with siCtrl, and plotted on a log scale. D-E Representative images and quantification of ssTelo staining U2OS cells treated with siRNAs against TIMELESS (siTIM) compared to control cells (siCtrl). F Quantification of de novo histone deposition in U2OS cells treated with siRNAs against TIMELESS. The scale bar is 10 μm. An unpaired t-test was used for statistical analysis; P > 0.05 indicated as ns, P ≤ 0.01 indicated as **, P ≤ 0.0001 indicated as **** on the graphs.
Fig 5:
Fig 5:. Inhibition of ATR or TLK elevates telomeric ssDNA and reduces histone deposition
A-C Representative images and quantification of ssTelo staining of a panel of ALT-positive (U2OS, LM216J, G292, and SAOS-2) and ALT-negative (HeLa and LM216T) cells treated with TLKi or ATRi for 6 hrs. D-E Representative images and quantifications of ssTelo staining of U2OS in the presence or absence of sgRNA against BLM treated with TLKi or ATRi. F-G Representative images TMR staining (red) of H3.1-SNAP U2OS cells treated TLKi (F), ATRi (G) or control (veh). H Quantification of de novo H3.1 histone deposition in U2OS cells treated with TLKi or ATRi. The scale bar is 10 μm. An unpaired t-test was used for statistical analysis; P > 0.05 indicated as ns, P ≤ 0.05 indicated as *, P ≤ 0.001 indicated as ***, P ≤ 0.0001 indicated as **** on the graphs.

References

    1. Feldser D.M. and Greider C.W., Short telomeres limit tumor progression in vivo by inducing senescence. Cancer Cell, 2007. 11(5): p. 461–9. - PMC - PubMed
    1. Greenberg R.A., et al. , Expression of mouse telomerase reverse transcriptase during development, differentiation and proliferation. Oncogene, 1998. 16(13): p. 1723–30. - PubMed
    1. Greider C.W., Telomere length regulation. Annu Rev Biochem, 1996. 65: p. 337–65. - PubMed
    1. Perera S.A., et al. , Telomere dysfunction promotes genome instability and metastatic potential in a K-ras p53 mouse model of lung cancer. Carcinogenesis, 2008. 29(4): p. 747–53. - PubMed
    1. Bryan T.M., et al. , Evidence for an alternative mechanism for maintaining telomere length in human tumors and tumor-derived cell lines. Nat Med, 1997. 3(11): p. 1271–4. - PubMed

Publication types

LinkOut - more resources