[Preprint]. 2024 Nov 17:2024.11.17.624012.
doi: 10.1101/2024.11.17.624012.

Adaptations in gut Bacteroidales facilitate stable co-existence with their lytic bacteriophages

Affiliations

Adaptations in gut Bacteroidales facilitate stable co-existence with their lytic bacteriophages

Adrián Cortés-Martín et al. bioRxiv. .

Update in

Abstract

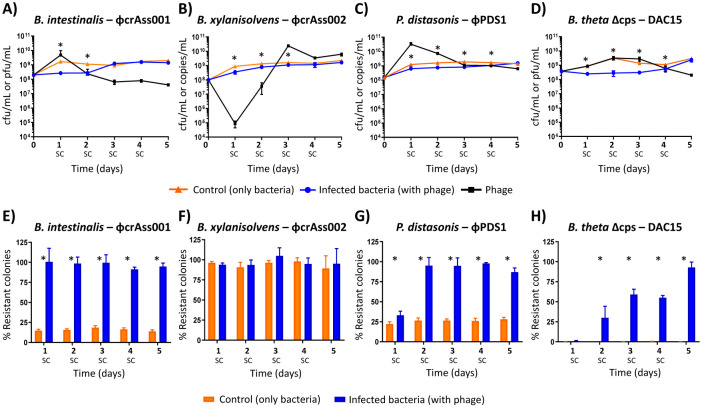
Background: Bacteriophages (phages) and bacteria within the gut microbiome persist in long-term stable coexistence. These interactions are driven by eco-evolutionary dynamics, where bacteria employ a variety of mechanisms to evade phage infection, while phages rely on counterstrategies to overcome these defences. Among the most abundant phages in the gut are the crAss-like phages that infect members of the Bacteroidales, in particular Bacteroides. In this study, we explored some of the mechanisms enabling the co-existence of four phage-Bacteroidales host pairs in vitro using a multi-omics approach (transcriptomics, proteomics and metabolomics). These included three Bacteroides species paired with three crAss-like phages (Bacteroides intestinalis and ϕcrAss001, Bacteroides xylanisolvens and ϕcrAss002, and an acapsular mutant of Bacteroides thetaiotaomicron with DAC15), and Parabacteroides distasonis paired with the siphovirus ϕPDS1.

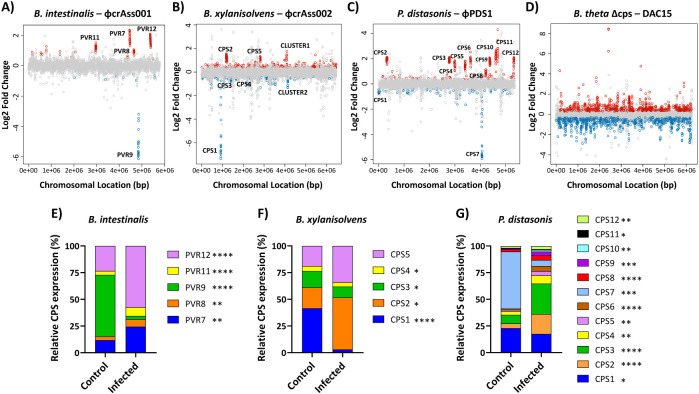
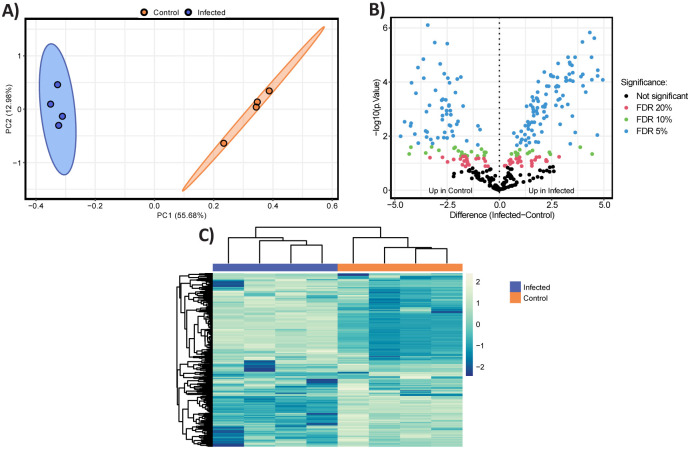
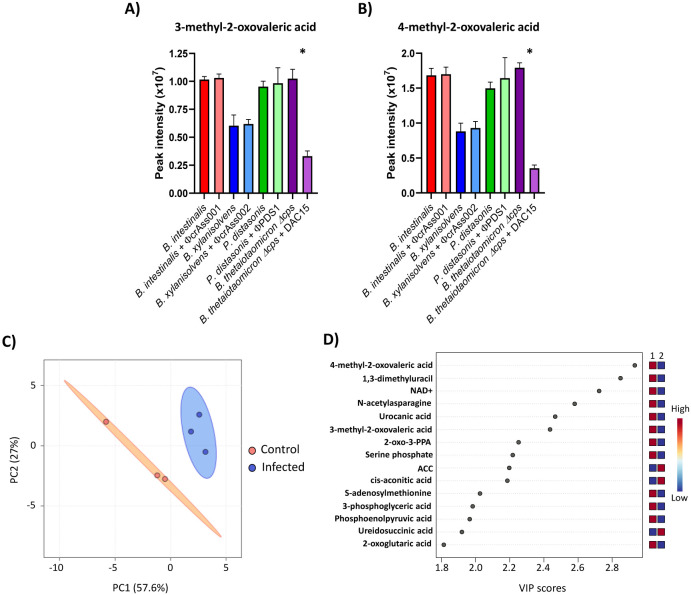
Results: We show that phase variation of individual capsular polysaccharides (CPSs) is the primary mechanism promoting phage co-existence in Bacteroidales, but this is not the only strategy. Alternative resistance mechanisms, while potentially less efficient than CPS phase variation, can be activated to support bacterial survival by regulating gene expression and resulting in metabolic adaptations, particularly in amino acid degradation pathways. These mechanisms, also likely regulated by phase variation, enable bacterial populations to persist in the presence of phages, and vice versa. An acapsular variant of B. thetaiotaomicron demonstrated broader transcriptomic, proteomic, and metabolomic changes, supporting the involvement of additional resistance mechanisms beyond CPS variation.

Conclusions: This study advances our understanding of long-term phage-host interaction, offering insights into the long-term persistence of crAss-like phages and extending these observations to other phages, such as ϕPDS1. Knowledge of the complexities of phage-bacteria interactions is essential for designing effective phage therapies and improving human health through targeted microbiome interventions.

Keywords: Bacteriophages; Bacteroides; Crassvirales; Parabacteroides; co-culture; crAssphages; gut microbiome; intestinal microbiota; phage-bacteria interaction; virome.


Figures

Fig. 1.
Fig. 1.. Bacterial-phage dynamics and variation in bacterial resistant colonies acquired during the 5-day co-culture.
(A-D) Enumeration of bacteria and phage during the 5-day co-culture experiments. After each 24-hour period, a new subculture (SC) was performed in fresh media at a dilution of 1:50. (A) B. intestinalis + ϕcrAss001, (B) B. xylanisolvens + ϕcrAss002, (C) P. distasonis + ϕPDS1, (D) B. thetaiotaomicron Δcps + DAC15. The orange line represents the bacterial counts (CFU/mL) for the control condition (uninfected bacteria), the blue line represents the bacterial counts (CFU/mL) in co-culture with phage, and the black line represents the phage counts (pfu/mL or copies/mL) in co-culture with bacteria. Differences in phage enumeration methods were due to the ability to produce countable plaques (CFU/mL), or qPCR (copies/mL) when plaques were not detected. (E-H) Variation in the percentage of resistant colonies every 24 hours during the 5 days of co-culture experiments. (E) B. intestinalis + ϕcrAss001, (F) B. xylanisolvens + ϕcrAss002, (G) P. distasonis + ϕPDS1, (H) B. thetaiotaomicron Δcps + DAC15. Orange bars represent the mean percentage of resistant colonies in the uninfected culture (control), while blue bars show the mean percentage of resistant colonies when bacteria were exposed to phage. Error bars indicate standard deviation (SD). All experiments were carried out in triplicate. *: Statistically significant differences in bacterial counts or percentage of resistant colonies when comparing the control with the infected conditions were set at p < 0.05.
Fig. 2.
Fig. 2.. Transcriptional changes and CPS expression profiles after bacteria-phage co-culture.
(A-D) Transcriptional changes during mid-log phase growth on the fifth day of each bacteria-phage co-culture: (A) B. intestinalis + ϕcrAss001, (B) B. xylanisolvens + ϕcrAss002, (C) P. distasonis + ϕPDS1, (D) B. thetaiotaomicron Δcps + DAC15. Genes are plotted as dots according to their chromosomal location in each bacterial host. The log2 fold change represents the differential expressions of genes when comparing control (uninfected) with infected bacteria. Red dots represent genes that were significantly upregulated upon phage infection, blue dots are those that were significantly downregulated, and grey dots are those that did not show statistically significant changes in expression. Gene clusters implicated in bacterial capsulation are labelled as CPS (capsular polysaccharide) and PVR (phase-variable region). Statistical significance was determined using an FDR-adjusted p-value (FDR < 0.05). (E-G) Relative expression of the different CPS loci in bacterial capsular strains under infected and uninfected conditions determined by RNA-seq data. (E) B. intestinalis + ϕcrAss001, (F) B. xylanisolvens + ϕcrAss002, (G) P. distasonis + ϕPDS1. The expression values for each CPS cluster were calculated by averaging the expression levels of the genes within each cluster and then normalizing them to the total expression of all CPS clusters. The resulting values are presented as a percentage of the total CPS expression for each condition. Differences in the relative expression of the CPS loci were analysed assuming normal distribution using Welch’s t-test. Significant differences in proportions after phage infection are indicated in the legend as follows: * p < 0.05; ** p < 0.01; *** p < 0.001; **** p < 0.0001.
Fig. 3.
Fig. 3.. Differential proteomics profile in the supernatant obtained during the mid-log phase on the fifth day of the co-culture experiment with B. thetaiotaomicron Δcps and DAC15.
(A) Principal Component Analysis (PCA) of proteomic profiles of B. thetaiotaomicron Δcps supernatant between control (orange) and DAC15-infected samples (blue colour). Ellipses represent 95% confidence intervals, and the explained variances of the two principal components are shown in brackets along the axes. (B) Volcano plot representing the significantly differentially abundant proteins. Non-adjusted p-values are plotted; however, points are coloured for significance based on corrected p-values. Proteins upregulated in control (left panel) and DAC-15 infected (right panel) are plotted based on fold change and statistical significance (Benjamini-Hochberg FDR correction) at different thresholds: 5% (blue), 10% (green), 20% (red), and non-significant (black). (C) Heatmap displaying hierarchical clustering of proteomic data generated from z-scored data. Row and columns are clustered based on Euclidean distance, showing differential protein expression between control and infected conditions. Columns are coloured by sample condition with blue representing infected samples and orange representing control. Yellow indicates higher relative protein abundances, while blue represents lower relative abundance.
Fig. 4.
Fig. 4.. Intracellular metabolomic changes in B. thetaiotaomicron Δcps after DAC15 infection.
(A-B) LC-MS peak intensities of 3-methyl-2-oxovaleric acid (A) and 4-methyl-2-oxovaleric acid (B) for each phage-host pair, obtained from untargeted intracellular metabolomics analysis performed in the samples obtained during mid-log phase growth on the fifth day of the co-culture experiment. Bars represent the mean of triplicate biological samples, with error bars indicating the standard deviation (SD). * Significant differences were set up at p < 0.05. (C) Principal Component Analysis (PCA) of intracellular metabolomic profiles from B. thetaiotaomicron Δcps and DAC15 co-cultures, based on detected compounds with accuracy levels 1 and 2a, extracted from bacterial pellets. Orange indicates the control condition (uninfected), while blue is the infected condition. Ellipses represent 95% confidence intervals, and the explained variances of the two principal components are shown in brackets along the axes. (D) Important features identified by partial least squares-discriminant analysis (PLS-DA) in B. thetaiotaomicron Δcps bacterial pellets collected at the mid-log phase on the fifth day of the co-culture. The coloured boxes on the right indicate the relative peak area of each corresponding metabolite in the groups under study, with red indicating higher peak areas and blue indicating lower. Group 1 corresponds to the control condition, and group 2 corresponds to the DAC-15 infected samples. 2-oxo-3-PPA: 2-oxo-3-phenylpropanoic acid; ACC: 1-Aminocyclopropanecarboxylic acid.

References

    1. Fan Y, Pedersen O. Gut microbiota in human metabolic health and disease. Nat Rev Microbiol. 2021;19(1):55–71. - PubMed
    1. de Vos WM, Tilg H, Van Hul M, Cani PD. Gut microbiome and health: mechanistic insights. Gut. 2022;71(5):1020–1032. - PMC - PubMed
    1. Shareefdeen H, Hill C. The gut virome in health and disease: new insights and associations. Curr Opin Gastroenterol. 2022;38(6):549–554. - PubMed
    1. Tobin CA, Hill C, Shkoporov AN. Factors Affecting Variation of the Human Gut Phageome. Annu Rev Microbiol. 2023;77:363–379. - PubMed
    1. Shkoporov AN, Turkington CJ, Hill C. Mutualistic interplay between bacteriophages and bacteria in the human gut. Nat Rev Microbiol. 2022;20(12):737–749. - PubMed

Publication types

LinkOut - more resources