[Preprint]. 2025 Jan 16:2024.11.14.623618.
doi: 10.1101/2024.11.14.623618.

A whole-animal phenotypic drug screen identifies suppressors of atherogenic lipoproteins

Affiliations

A whole-animal phenotypic drug screen identifies suppressors of atherogenic lipoproteins

Daniel J Kelpsch et al. bioRxiv. .

Abstract

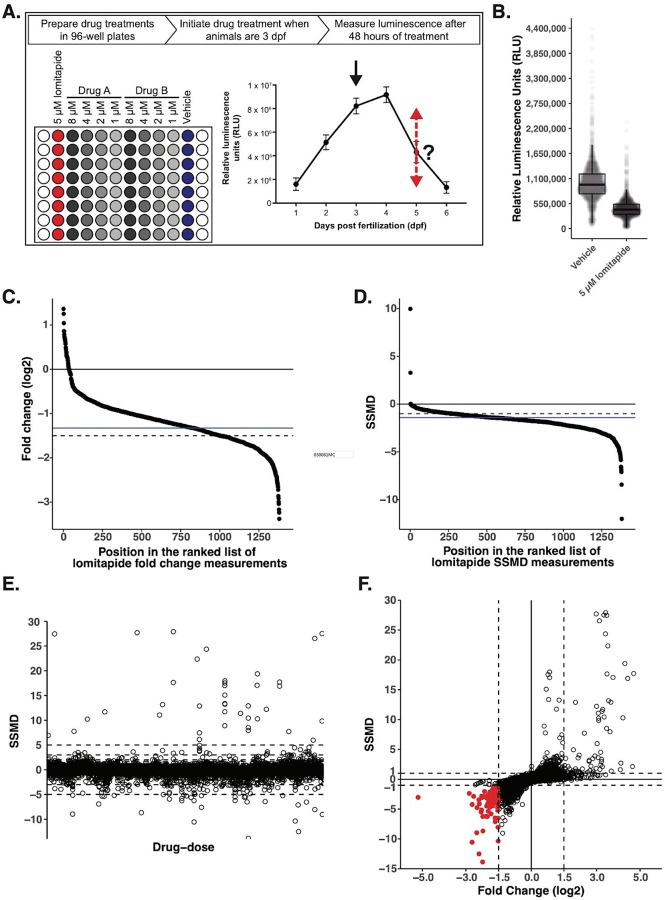
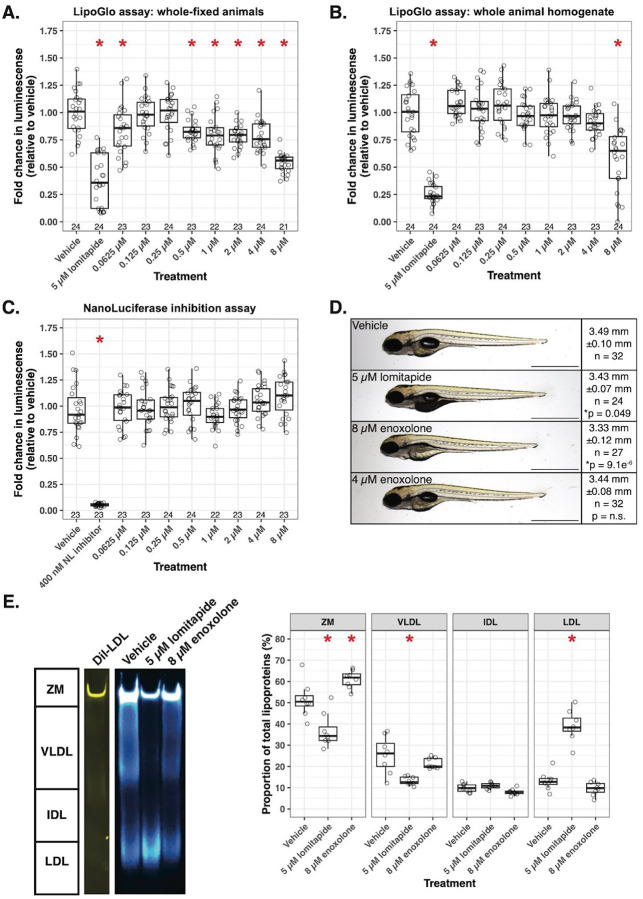
Lipoproteins are essential for lipid transport in all bilaterians. A single Apolipoprotein B (ApoB) molecule is the inseparable structural scaffold of each ApoB-containing lipoprotein (B-lps), which are responsible for transporting lipids to peripheral tissues. The cellular mechanisms that regulate ApoB and B-lp production, secretion, transport, and degradation remain to be fully defined. In humans, elevated levels of vascular B-lps play a causative role in cardiovascular disease. Previously, we have detailed that human B-lp biology is remarkably conserved in the zebrafish using an in vivo chemiluminescent reporter of ApoB (LipoGlo) that does not disrupt ApoB function. Thus, the LipoGlo model is an ideal system for identifying novel mechanisms of ApoB modulation and, due to the ability of zebrafish to generate many progeny, is particularly amenable to large-scale phenotypic drug screening. Here, we report a screen of roughly 3000 compounds that identified 49 unique ApoB-lowering hits. Nineteen hits passed orthogonal screening criteria. A licorice root component, enoxolone, significantly lowered B-lps only in animals that express a functional allele of the nuclear hormone receptor Hepatocyte Nuclear Factor 4α (HNF4α). Consistent with this result, inhibitors of HNF4α also reduce B-lp levels. These data demonstrate that mechanism(s) of action can be rapidly determined from a whole animal zebrafish phenotypic screen. Given the well documented role of HNF4α in human B-lp biology, these data validate the LipoGlo screening platform for identifying small molecule modulators of B-lps that play a critical role in a leading cause of worldwide mortality.


Conflict of interest statement

Declaration of Interests The authors declare no competing interests.

Figures

Figure 1.
Figure 1.. A whole-animal drug screen identifies LipoGlo-reducing compounds.
(A) Schematic summarizing drug screening paradigm. Drug treatments were prepared in 96-well plates, each plate with a negative control (vehicle), positive control (5 μM lomitapide), and serial dilutions (four-fold dilution; 8 μM, 4 μM, 2 μM, and 1 μM) of two different drugs of interest. Each treatment was prepared with 8 replicates. When animals were 3 dpf, when B-lp levels are relatively high (black arrow), they were dispensed into their drug treatment for a 48-hour incubation when luminescence was measured (red dashed arrow). (B) Boxplot of average Relative Luminescence Units (RLU) measured from fixed 5 dpf Fus(ApoBb.1-NanoLuciferase); Tg(ubi:mcherry-2A-FireflyLuciferase) animals treated for 48 hours with either negative (vehicle) or positive (5 μM lomitapide) control. Each data point represents the average of 8 independent samples measured from a single 96-well plate from 1381 independent experiments across the entire screen. We measured a 55.6% reduction in RLU in 5 μM treated animals. (C) An ordered plot of each average fold change of luminescence (log2 scale) measured from 5 μM lomitapide treated animals from each 96-well plate (n = 1381) relative to respective vehicle treatment. The solid black line at y=0 represents the divide in increased and decreased luminescence levels, the solid blue line at y = −1.33 represents the curve’s inflection point, and the dashed black line at y = −1.5 represents the fold change cutoff used to define a hit. (D) An ordered plot of each SSMD score measured from 5 μM lomitapide treated animals from each 96-well plate (n = 1381) relative to respective vehicle treatment. The solid black line at y = 0 represents the divide in increased and decreased SSMD score, the solid blue line at y = −1.41 represents the curve’s inflection point, and the dashed black line at y = −1 represents the SSMD (open circles) cutoff used to define a hit. (E) A plot of SSMD scores measured from each drug at each dose tested. A total of 2762 drugs were tested, each at 4 different doses (8, 4, 2, and 1 μM; n = 11048). Dashed lines at y = ±1, ±1.25, ±1.645, ±2, ±3, ±5 represent common defining cutoffs of SSMD scores. (F) A dual flashlight plot of each dose of each drug (open circles) SSMD score (y-axis) against fold change (log2-scale, x-axis). Dashed lines at y = −1, y = 1, x = −1.5, and x = 1.5 represent the cut-off to define hits that significantly affect luminescence levels; all significant luminescence-reducing compounds are highlighted in red (n = 50).
Figure 2.
Figure 2.. Fifty total compounds significantly reduce LipoGlo levels.
Boxplot of the fold change for each of the 50 hit compounds from the Johns Hopkins Drug Library (JHDL) at the respective dose they met hit criteria (fold change (log2) ≤ −1.5 and SSMD ≤ −1). The luminescence of each drug at each dose was measured (n = 8), and fold change was calculated against the mean of vehicle treatment.
Figure 3.
Figure 3.. Enoxolone reduces B-lps in larval zebrafish.
(A) Boxplot of the average fold change of Relative Luminescence Units (RLU) measured from fixed 5 dpf Fus(ApoBb.1-NanoLuciferase); Tg(ubi:mcherry-2A-FireflyLuciferase) animals treated for 48 hours with either negative (vehicle), positive (5 μM lomitapide) control, or an 8-fold serial dilution of enoxolone. Each data point represents a measurement from an independent animal collected from three independent experiments and normalized to the average vehicle RLU from each individual experiment. Several treatments significantly altered RLU levels (one-way ANOVA, F(9,221) = 32.79, p < 2×10⁻¹⁶). Lomitapide treatment (n = 24) significantly reduced RLU levels compared to vehicle treatment (n = 24, Dunnett’s test p = 0.00000000056). Treatment with 8 μM enoxolone (n = 21, Dunnett’s test p = 0.000000000078), 4 μM enoxolone (n = 24, Dunnett’s test p = 0.0012), 2 μM enoxolone (n = 23, Dunnett’s test p = 0.00032), 1 μM enoxolone (n = 22, Dunnett’s test p = 0.0052), and 0.5 μM enoxolone (n = 23, Dunnett’s test p = 0.0072) also reduced total RLUs. (B) Boxplot of the average fold change of RLUs measured from homogenized 5 dpf Fus(ApoBb.1-NanoLuciferase); Tg(ubi:mcherry-2A-FireflyLuciferase) animals that were treated for 48 hours with either vehicle, 5 μM lomitapide, or an 8-fold serial dilution of enoxolone. Several treatments significantly altered RLU levels (one-way ANOVA, F(9,226) = 54.2, p < 2×10⁻¹⁶). Lomitapide treatment (n = 24) significantly reduced RLU levels compared to vehicle treatment (n = 24, Dunnett’s test p = 0.0000000000000017), as did 8 μM enoxolone treatment (n = 24, Dunnett’s test p = 0.0000061). (C) Boxplot of the average fold change of RLUs measured from untreated homogenates of 5 dpf Fus(ApoBb.1-NanoLuciferase); Tg(ubi:mcherry-2A-FireflyLuciferase) animals that were briefly treated with either vehicle, 400 nM NanoLuciferase inhibitor, or an 8-fold serial dilution of enoxolone to determine if enoxolone is an inhibitor of NanoLuciferase enzymatic activity. Only one treatment altered RLU levels (one-way ANOVA, F(9,221) = 78.31, p < 2 ×10⁻¹⁶), which was the positive control of 400 nM NanoLuciferase inhibitor (n = 22) when compared to vehicle treatment (n = 23, Dunnett’s test p = 0.00000000000003). No enoxolone treatment significantly altered RLU levels when compared to vehicle treatment. (D) Representative whole-mount images of 5 dpf Fus(ApoBb.1-NanoLuciferase); Tg(ubi:mcherry-2A-FireflyLuciferase) larvae following treatment of vehicle, 5 μM lomitapide, or 8 μM enoxolone for 48 hours. Lomitapide treatment induced a dark yolk phenotype, while no notable phenotypes followed enoxolone treatment. Scale bar represents 1 mm. (E) Representative image of a native-PAGE gel of luminescent B-lps from homogenates of 5 dpf animals treated with vehicle, 5 μM lomitapide, or 8 μM enoxolone for 48 hours. The image is a composite of chemiluminescence (B-lps, cyan hot) and fluorescence (DiI-LDL, yellow). For quantifications, B-lps were binned into one of 4 classes (ZM (zero mobility), very-low-density lipoproteins (VLDL), intermediate-density lipoproteins (IDL), or LDL), and these values were visualized via boxplot. The gel image is a representative image of representative samples from one of the three independent experiments performed.
Figure 4.
Figure 4.. Pharmacological inhibition of HNF4α reduces lipoproteins in the larval zebrafish.
(A) Boxplot of the average fold change of Relative Luminescence Units (RLU) measured from fixed 5 dpf Fus(ApoBb.1-NanoLuciferase); Tg(ubi:mcherry-2A-FireflyLuciferase) animals treated for 48 hours with either negative (vehicle), positive (5 μM lomitapide) control, or an 8-fold serial dilution of BIM5078 or BI6015. Each data point represents a measurement from an independent animal collected from three independent experiments and normalized to the average vehicle RLU from each individual experiment. Several treatments significantly altered RLU levels in the BIM5078 experiment (one-way ANOVA, F(9,216) = 29.61, p < 2×10⁻¹⁶) and BI6015 experiment (one-way ANOVA, F(9,219) = 43.6, p < 2×10⁻¹⁶). In the BIM5078 experiment, only lomitapide treatment (n = 21) significantly reduced RLU levels compared to vehicle treatment (n = 23, Dunnett’s test p = 0.0000000000000000011). In the BI6015 experiment, lomitapide treatment (n = 21) significantly reduced RLU levels compared to vehicle treatment (n = 24, Dunnett’s test p = 0.00000000000000083). Treatment with 8 μM BI6015 (n = 21, Dunnett’s test p = 0.0000000000069) also reduced total RLUs. (B) Boxplot of the average fold change of RLUs measured from homogenized 5 dpf Fus(ApoBb.1-NanoLuciferase); Tg(ubi:mcherry-2A-FireflyLuciferase) animals that were treated for 48 hours with either vehicle, 5 μM lomitapide, or an 8-fold serial dilution of of BIM5078 or BI6015. Several treatments significantly altered RLU levels in the BIM5078 experiment (one-way ANOVA, F(9,221) = 39.61, p < 2×10⁻¹⁶) and BI6015 experiment (one-way ANOVA, F(9,223) = 42.7, p < 2×10⁻¹⁶). In the BIM5078 experiment, lomitapide treatment (n = 22) significantly reduced RLU levels compared to vehicle treatment (n = 24, Dunnett’s test p = 0.0000000000000002). Treatment with 8 μM BIM5078 (n = 24, Dunnett’s test p = 0.000000091), 4 μM BIM5078 (n = 24, Dunnett’s test p = 0.0012), and 0.125 μM BIM5078 (n = 23, Dunnett’s test p = 0.0083) also reduce total RLUs. In the BI6015 experiment, lomitapide treatment (n = 22) significantly reduced RLU levels compared to vehicle treatment (n = 24, Dunnett’s test p = 0.0000000000000000023). Treatment with 8 μM BI6015 (n = 24, Dunnett’s test p = 0.0000000880), 4 μM BI6015 (n = 23, Dunnett’s test p = 0.000012), and 1 μM BI6015 (n = 24, Dunnett’s test p = 0.021) also reduce total RLUs. (C) Boxplot of the average fold change of RLUs measured from untreated homogenates of 5 dpf Fus(ApoBb.1-NanoLuciferase); Tg(ubi:mcherry-2A-FireflyLuciferase) animals that were briefly treated with either vehicle, 400 nM NanoLuciferase inhibitor, or an 8-fold serial dilution of BIM5078 or BI6015 to determine if HNF4α inhibitors interfere with NanoLuciferase enzymatic activity. Several treatments significantly altered RLU levels in the BIM5078 experiment (one-way ANOVA, F(9,218) = 90.21, p < 2×10⁻¹⁶) and BI6015 experiment (one-way ANOVA, F(9,224) = 108.7, p < 2×10⁻¹⁶). In the BIM5078 experiment, only the NanoLuciferase inhibitor treatment (n = 22) significantly reduced RLU levels compared to vehicle treatment (n = 23, Dunnett’s test p = 0.00000000000000014) and BIM5078 treatment did not alter RLU levels. In the BI6015 experiment, only the NanoLuciferase inhibitor treatment (n = 24) significantly reduced RLU levels compared to vehicle treatment (n = 23, Dunnett’s test p = 0.000000000000000073) and BI6015 treatment did not alter RLU levels. (D) Representative image of a native-PAGE gel of luminescent B-lps from homogenates of 5 dpf animals treated with vehicle, 5 μM lomitapide, or 8 μM BIM5078 or 8 μM BI6015 for 48 hours. The image is a composite of chemiluminescence (B-lps, cyan hot) and fluorescence (DiI-LDL, yellow). For quantifications, B-lps were binned into one of 4 classes (ZM (zero mobility), very-low-density lipoproteins (VLDL), intermediate-density lipoproteins (IDL), or LDL), and these values were visualized via boxplot. The gel image is a representative image of representative samples from one of the two independent experiments performed.
Figure 5.
Figure 5.. HNF4α is required for lipoproteins throughout larval development and for the lipoprotein-reducing effect of enoxolone.
(A) Boxplot of normalized Relative Luminescence Units (RLU) measured from homogenized Fus(ApoBb.1-NanoLuciferase)/+ whole animals that were either HNF4α+/+, HNF4αrdu14/+, or HNF4αrdu14/rdu14, collected at 1, 2, 3, 4, and 5 dpf. Data were collected from at least three independent experiments and normalized to the mean of 3 dpf HNF4α+/+ animals. Lipoprotein levels change throughout development (two-way ANOVA, F(1) = 261.206, p < 2×10⁻¹⁶) and due to the loss of HNF4α (F(2) = 12.13, p = 0.00000641). Compared to their wild-type siblings, HNF4α homozygotes have reduced lipoproteins at 1 dpf (Dunnett’s test, HNF4αrdu14/rdu14 n = 29 versus HNF4α+/+ n = 30, p = 0.0000016), 2 dpf (Dunnett’s test, HNF4αrdu14/rdu14 n = 33 versus HNF4α+/+ n = 34, p = 0.006), 3 dpf (Dunnett’s test, HNF4αrdu14/rdu14 n = 69 versus HNF4α+/+ n = 78, p = 0.00000000000000000018), 4 dpf (Dunnett’s test, HNF4αrdu14/rdu14 n = 38 versus HNF4α+/+ n = 41, p = 0.000017). HNF4α mutants have unchanged lipoproteins at 5 dpf. (B) Boxplot of normalized RLUs measured from homogenized Fus(ApoBb.1-NanoLuciferase)/+ whole animals that were either wild-type, heterozygous, or homozygous (HNF4α+/+, HNF4αrdu14/+, or HNF4αrdu14/rdu14 respectively) and treated with either vehicle or 8 μM enoxolone for 48 hours. The data were collected from two independent experiments and normalized to the mean of vehicle-treated HNF4α+/+ animals. Lipoprotein levels were significantly altered by the HNF4α genotype (Two-way ANOVA, F(2) = 3.385, p = 0.0361), drug treatment (F(1) = 22.736, p = 0.00000391), and the interaction of the HNF4α genotype and drug treatment (F(2) = 3.136, p = 0.0459). Enoxolone treatment reduced lipoproteins in HNF4α+/+ (Dunnett’s test, 8 μM enoxolone n = 28 versus vehicle n = 22, p = 0.00017) and HNF4αrdu14/+ (Dunnett’s test, 8 μM enoxolone n = 48 versus vehicle n = 35, p = 0.042). However, enoxolone treatment did not significantly alter lipoprotein levels in HNF4αrdu14/rdu14 animals (Dunnett’s test, 8 μM enoxolone n = 23 versus vehicle n = 24, p = 0.8).
Figure 6.
Figure 6.. Differential expression analysis throughout enoxolone treatment affects lipid regulatory genes and is similar to the genetic loss of HNF4α.
(A) Heat map of differentially expressed (DE) genes following 4, 8-, 12-, 16-, and 24-hours post-enoxolone treatment (hpt), respectively, 39, 34, 57, 118, and 402 genes were differentially expressed with red colors depicting increased and blue colors depicting decreased relative expression levels. Each column of each heatmap represents a single replicate. (B) Venn diagram of overlapping differentially expressed genes from each treatment duration. Of the total 471 differentially expressed genes, 115 are shared between at least two treatment durations, and only one gene, insig1, is shared by all durations. (C) The early response to enoxolone treatment features 14 differentially expressed genes. Gene ontology analysis of these 14 genes reveals enrichment of lipid regulating pathways. (D) The late response to enoxolone treatment features 34 differentially expressed genes. Gene ontology analysis of these 34 genes reveals carbohydrate-regulating and cell signaling pathway enrichment. (E) Table comparing differentially expressed genes following 4, 8-, 12-, 16-, and 24-hours post-enoxolone treatment to HNF4α knockout, HNF4Ɣ knockout, and HNF4α/HNF4Ɣ double knockout. There is considerable overlap between differentially expressed genes following enoxlone treatment and HNF4α knockout, but little overlap with HNF4Ɣ knockout.

References

    1. Shapiro MD, Fazio S. Apolipoprotein B-containing lipoproteins and atherosclerotic cardiovascular disease. F1000Res 2017;6. 10.12688/f1000research.9845.1. - DOI - PMC - PubMed
    1. Tabas I, Williams KJ, Borén J. Subendothelial Lipoprotein Retention as the Initiating Process in Atherosclerosis: Update and Therapeutic Implications. Circulation 2007;116:1832–44. 10.1161/CIRCULATIONAHA.106.676890. - DOI - PubMed
    1. Haas ME, Attie AD, Biddinger SB. The Regulation of ApoB Metabolism by Insulin. Trends Endocrinol Metab 2013;24. 10.1016/j.tem.2013.04.001. - DOI - PMC - PubMed
    1. Han S, Liang C-P, Westerterp M, Senokuchi T, Welch CL, Wang Q, et al. Hepatic insulin signaling regulates VLDL secretion and atherogenesis in mice 2009. 10.1172/JCI36523. - DOI - PMC - PubMed
    1. Jiang ZG, Robson SC, Yao Z. Lipoprotein metabolism in nonalcoholic fatty liver disease. J Biomed Res 2013;27:1–13. 10.7555/JBR.27.20120077. - DOI - PMC - PubMed

Publication types

LinkOut - more resources