[Preprint]. 2024 Nov 12:2024.11.11.623033.
doi: 10.1101/2024.11.11.623033.

Genotype-immunophenotype relationships in NPM1-mutant AML clonal evolution uncovered by single cell multiomic analysis

Affiliations

Genotype-immunophenotype relationships in NPM1-mutant AML clonal evolution uncovered by single cell multiomic analysis

Morgan Drucker et al. bioRxiv. .

Abstract

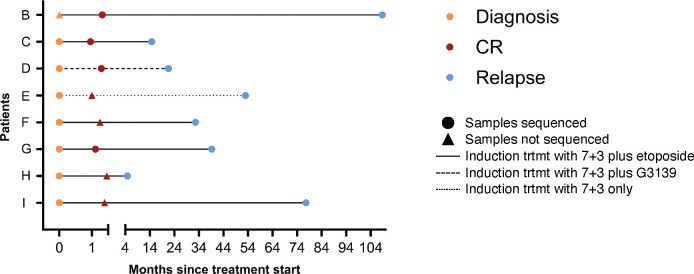
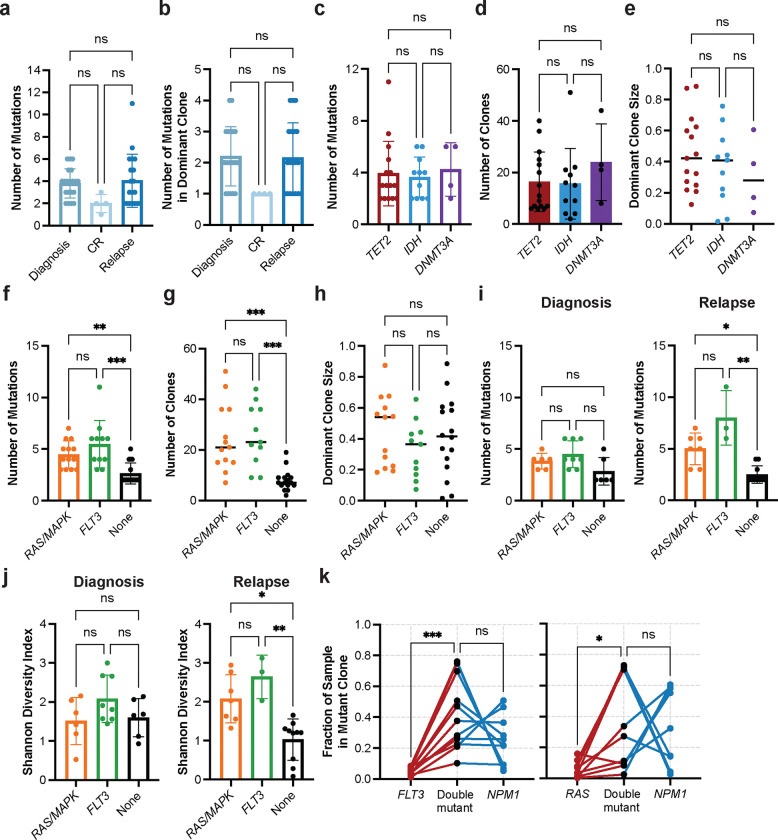
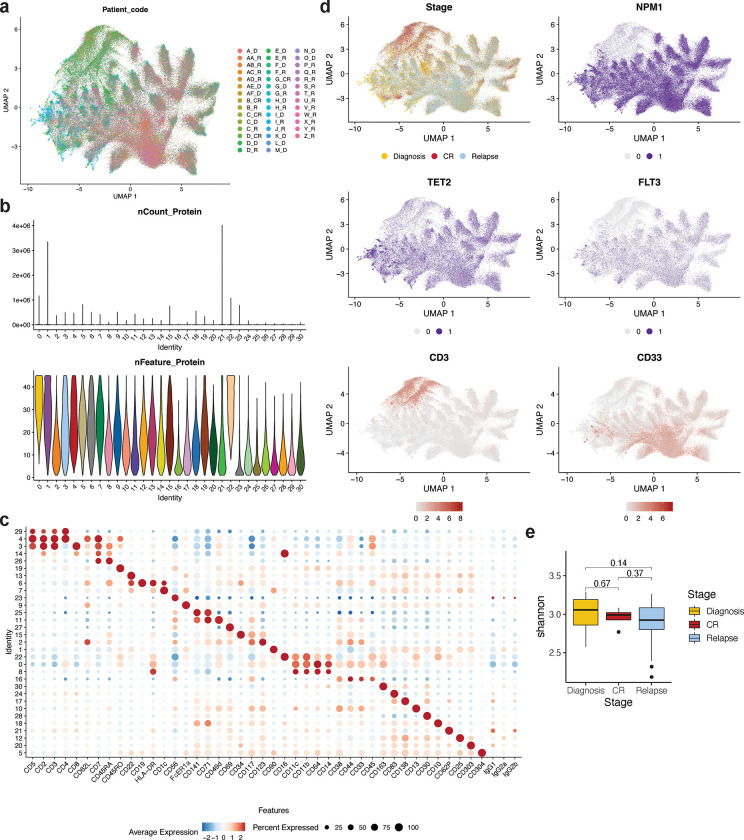
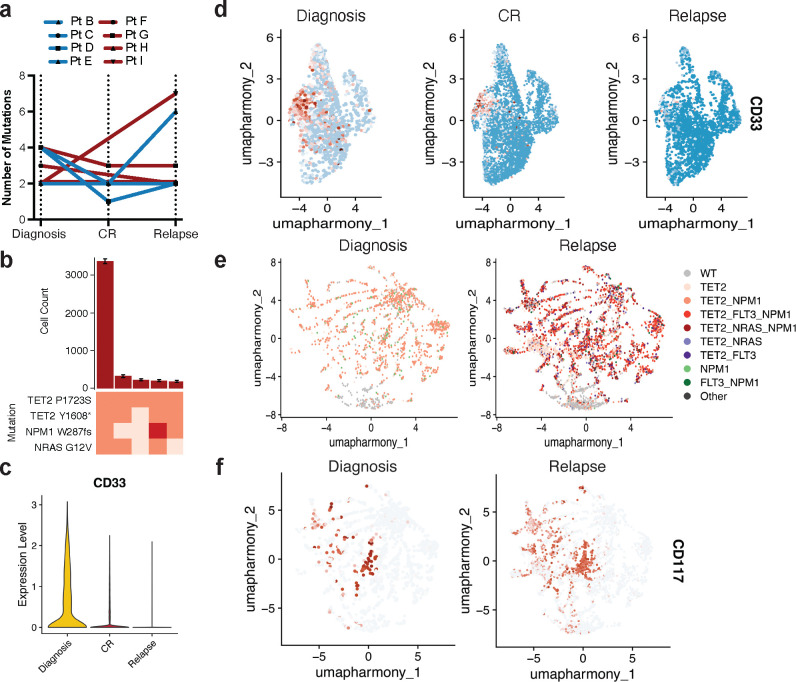
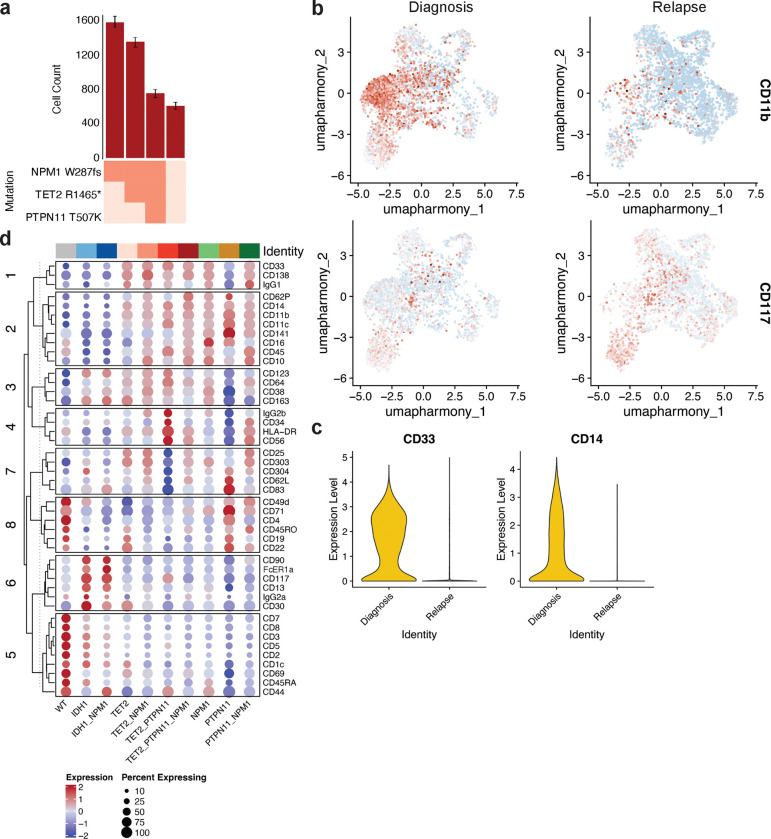
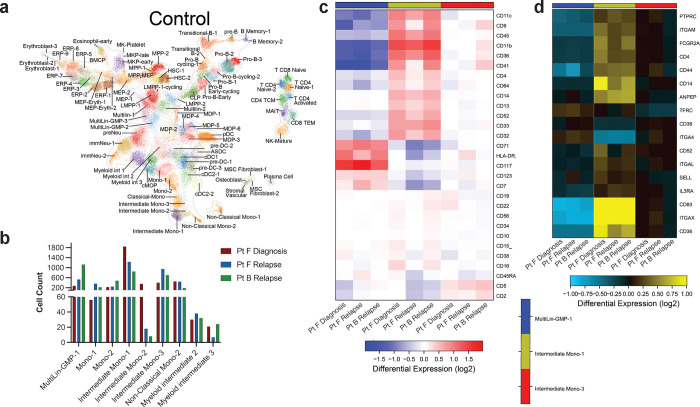
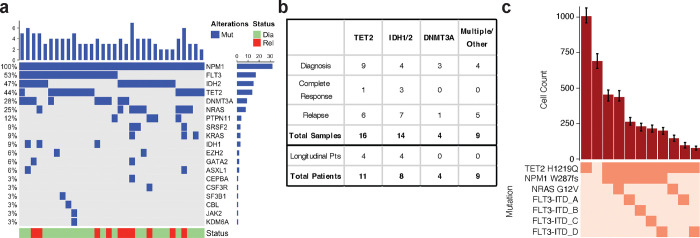
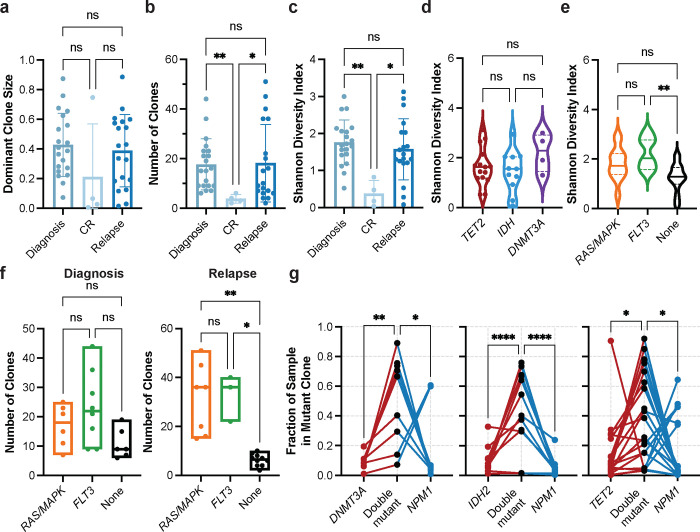
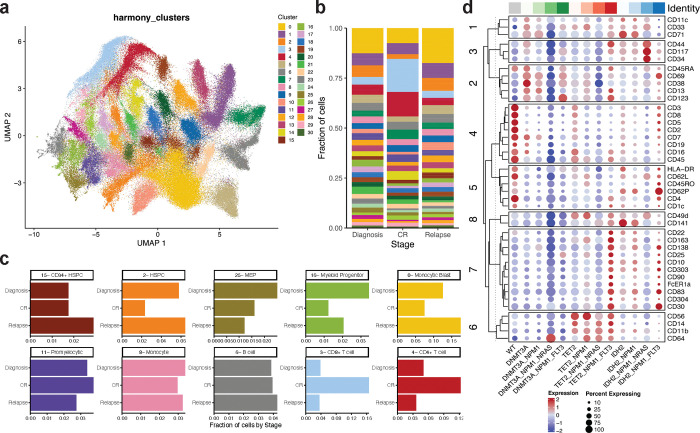
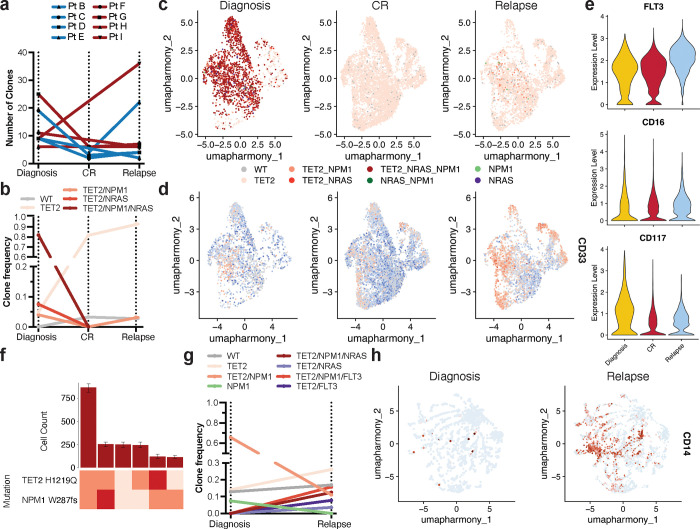
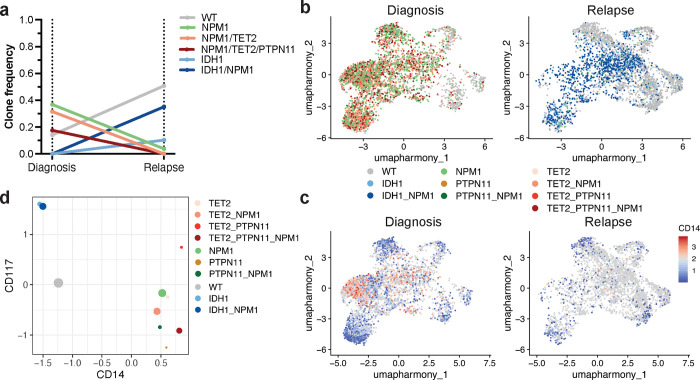
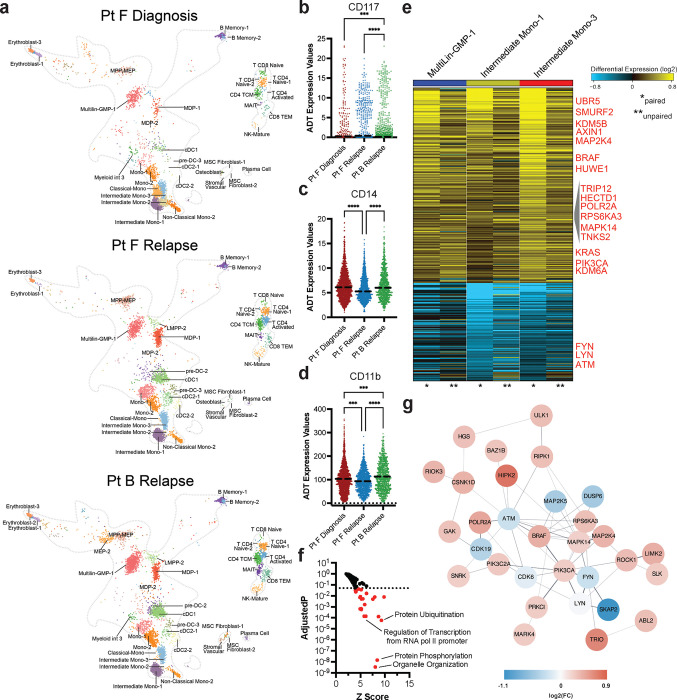
Acute myeloid leukemia (AML) is a multi-clonal disease, existing as a milieu of clones with unique but related genotypes as initiating clones acquire subsequent mutations. However, bulk sequencing cannot fully capture AML clonal architecture or the clonal evolution that occurs as patients undergo therapy. To interrogate clonal evolution, we performed simultaneous single cell molecular profiling and immunophenotyping on 43 samples from 32 NPM1-mutant AML patients at different stages of disease. Here we show that diagnosis and relapsed AML samples display similar clonal architecture patterns, but signaling mutations can drive increased clonal diversity specifically at relapse. We uncovered unique genotype-immunophenotype relationships regardless of disease state, suggesting leukemic lineage trajectories can be hard-wired by the mutations present. Analysis of longitudinal samples from patients on therapy identified dynamic clonal, transcriptomic, and immunophenotypic changes. Our studies provide resolved understanding of leukemic clonal evolution and the relationships between genotype and cell state in leukemia biology.


Conflict of interest statement

Competing Interests L.A.M. and R.L.B. had previously received honoraria for speaking arrangements and had previously served on a Speakers Bureau for Mission Bio, Inc. R.L.L. is on the supervisory board of QIAGEN and serves as a scientific advisor to Auron, Imago, Prelude, Zentalis Pharmaceuticals Mission Bio, Syndax, Ajax, Bakx, C4 Therapeutics and Isoplexis, for which he receives equity support. R.L.L. receives research support from Abbvie and Ajax, has served as a consultant for MorphoSys, Janssen, Incyte, and Novartis. J.C.B. has ownership interest in Vincera, an advisory and consultancy role with Novartis, Syndax, and Vincera, research funding from Genentech, Janssen, Acerta, and Pharmacyclics, an AbbVie company. R.L.L. has received honoraria from AstraZeneca and Incyte for invited lectures. A.-K.E. has received an honorarium from AstraZeneca for serving on their Diversity, Equity, and Inclusion Advisory Board and has received a research grant from Novartis. Spouse of A.-K.E. has ownership interest in Karyopharm Therapeutics. The other authors declare no competing interests.

Figures

Extended Data Fig. 1.
Extended Data Fig. 1.. Treatment response courses for patients (n=8) while on 7+3 therapy.
Each patient is labeled on Y axis with months since treatment start denoted on X axis. Diagnosis (yellow), complete response (red), and relapse (blue) samples that were available for sequencing denoted by colored circles with timepoints with unavailable samples depicted by triangles at time point based on location of dot. Therapy is denoted by line style (complete = 7+3 plus etoposide; large dash = 7+3 plus G3139; small dash = 7+3 alone). Patient outcomes are not provided or denoted on graph.
Extended Data Fig. 2.
Extended Data Fig. 2.. Analysis of clonal architecture by disease state and by gene mutation.
a-b) Clonal architecture metrics for entire cohort (n=43 samples) by disease state, including (a) number of mutations per sample, and (b) number of mutations in the dominant clone. c-e) Bar graphs depicting clonal architecture metrics of samples (n=30) with different epigenetic gene mutations in TET2 (red), IDH1/2 (blue), or DNMT3A (purple) at diagnosis and relapse states, including (c) number of mutations per sample, (d) number of clones per sample, and (e) dominant clone size. f-h) Number of mutations per sample (f), number of clones per sample (g) and dominant clone size (h) for samples with RAS/MAPK (n=13; orange) or FLT3 (n=11; green) mutations vs. no signaling gene mutations (n=16; None, black), at diagnosis and relapse states combined. i) Number of mutations per sample (as in Extended Data Fig 2f) stratified by diagnosis (left panel) or relapse (right panel). j) Clonal diversity, as calculated by Shannon diversity index, for samples with RAS/MAPK (n=13) or FLT3 (n=11) mutations vs. no signaling gene mutations (n=16) at diagnosis and at relapse. j) Fraction of sample in single- and double-mutant clones in FLT3-NPM1 (n = 11; left panel) and RAS-NPM1 (n = 10; right panel) mutant samples. Individual samples denoted by connecting lines. a-d, f, i-j) Mean value for each cohort shown by height of bar with standard deviation depicted with error bars. e, g-h) Center line - median value for each cohort. Kruskal-Wallis test was used to determine statistical significance amongst groups for all panels except k where a two-way ANOVA was used. *P<0.05, **P<0.01, ***P<0.001 denoted for all panels.
Extended Data Fig. 3.
Extended Data Fig. 3.. Immunophenotype analysis of all single-cell DNA+Protein samples.
a) Uniform manifold approximation and projection (UMAP) plot of all patient samples (n=43) clustered by immunophenotype. Cells from the same patient sample are shown in the same color. b) Single cell immunophenotype metrics for each community denoted by total number of sequencing reads for each community (nCount Protein; top panel) and violin plot denoting number of unique proteins expressed in each community (nFeature Protein; bottom panel. Colors of each community in bottom panel match colors from Extended Data Fig. 3b. c) Dot plot depicting relative expression of each immunophenotypic marker within each community. Normalized expression of each marker depicted by color (blue = low, red = high) with size of dot denoting the fraction of cells within each community that expresses the marker. d) Uniform manifold approximation and projection (UMAP) plots of entire patient cohort (n=43) with cells clustered by immunophenotype. Top left, disease stage overlaid onto the UMAP (Diagnosis, yellow; Complete response, CR, Red; Relapse, blue). Top right panel (NPM1) and middle panels (TET2, right; FLT3, left), select mutant genes overlaid onto the UMAP (wildtype, grey; mutant, purple). Bottom panel, select immunophenotypic markers (CD3, left panel; CD33, right panel) overlaid onto the UMAP with expression from low (grey) to high (red) expression depicted. e) Box and whisker plot of community diversity within each disease stage (diagnosis, yellow; CR, red; relapse, blue) calculated by Shannon diversity index.
Extended Data Fig. 4.
Extended Data Fig. 4.. Alterations in clonality and immunophenotype during 7+3 therapy.
a) Changes in number of mutations for NPM1-mutant patients (n=8) where samples were analyzed longitudinally while undergoing therapy. Individual patients indicated by connecting line with point at each disease state for which sample available. Blue = IDH2 co-mutation at diagnosis by bulk sequencing (n=4 patients); Red = TET2 co-mutation at diagnosis by bulk sequencing (n=4 patients). b) Clonograph of diagnosis sample from Pt G. Height of each bar represents the cell count of the corresponding identified clone noted below. Clone genotype is depicted by color with WT (light beige), heterozygous (orange), and homozygous (red) mutations denoted. c) Violin plot of CD33 in Pt G samples. Color denotes disease state (diagnosis, yellow; CR, red; relapse, blue). Bold dotted line denotes the mean with quartiles shown by thin dotted lines. d) UMAPs of Pt G samples denoting relative expression of CD33 as patient underwent therapy. Color depicts relative expression (blow = low, red = high). e-f) UMAP plots of Pt G samples at diagnosis (left), CR (center), and relapse (right) clustered by immunophenotype with genotype (e) or relative expression of CD117 (f) overlaid. Colors in e denote genotype colors in Fig. 4g. Colors in f denote relative expression of CD117 (blue = low, red = high).
Extended Data Fig. 5.
Extended Data Fig. 5.. Clonal sweep during 7+3 therapy.
a) Clonograph of diagnosis sample from patient F. Height of each bar represents the cell count of the corresponding identified clone noted below. Clone genotype is depicted by color with WT (light beige), heterozygous (orange), and homozygous (red) mutations denoted. b) UMAPs from Fig. 5b with relative expression of CD11b (top) and CD117 (bottom) overlaid. Color depicts relative expression (blue = low, red = high). c) Violin plot of CD33 (right panel) and CD14 in Pt F samples. Color denotes disease state (diagnosis, yellow; relapse, blue). Bold dotted line denotes the mean with quartiles shown by thin dotted lines. d) Dot plot depicting expression of immunophenotypic markers by genotype-specific clones identified in Pt F samples. Normalized expression of each marker depicted by color (blue = low, red = high) with size of dot denoting the fraction of cells within each genotyped clone that expresses the marker. Immunophenotype markers grouped by corresponding lineage associations. Full genotype for each row denoted at left of the dotplot.
Extended Data Fig. 6.
Extended Data Fig. 6.. CITE-seq analysis of clonal evolution.
a) UMAP cell cluster atlas of human hematopoiesis derived from CITE-seq analysis and used as reference map for Pt F and Pt B samples in Fig. 6. Cell cluster identities denoted. b) Bar plot of cell counts for selected cell clusters identified from CITE-seq analysis for samples analyzed (n=3). Color of bar denotes the sample identity with legend. c) Heatmap of cell surface marker ADT read counts for antibodies used in the CITE-seq panel across Multilin-GMP-1 (left, blue column), Intermediate Mono-1 (center, yellow column), and Intermediate Mono-3 (right, red column) cell clusters. Heatmap scale denotes log fold differences in read counts from high (red to low (blue). d) Heatmap of cell surface marker gene expression for antibodies used in either CITE-seq and/or scDNA+Protein panel across Multilin-GMP-1 (left, blue column), Intermediate Mono-1 (center, yellow column), and Intermediate Mono-3 (right, red column) cell clusters. Only differentially expressed genes are included. Heatmap scale denotes log fold gene expression from high (yellow) to low (blue).
Fig. 1.
Fig. 1.. NPM1-mutated AML patient cohort.
a) Oncoprint of samples in patient cohort (n=32) depicting mutations identified by targeted bulk sequencing. For patients with more than one sample, only the diagnosis sample is displayed. b) Table of patient cohort (n=43 samples) describing breakdown of samples by epigenetic co-mutation and disease state. c) Clonograph of a representative patient sample (Pt I diagnosis) depicting clones present in sample. The height of each bar represents the cell count of the clone identified below. Clone genotype is depicted by color with wildtype (WT) in light beige and heterozygous mutations in orange denoted.
Fig. 2.
Fig. 2.. Clonal architecture patterns and mutational cooperativity by single-cell DNA sequencing.
a-c) Bar graphs of clonal architecture metrics for entire cohort by disease state, including (a) dominant clone size, (b) number of clones, and (c) clonal diversity, calculated by the Shannon diversity index (mean ± SD, n = 43). d) Violin plot of Shannon diversity index for diagnosis and relapse samples harboring epigenetic mutations (n = 30) in TET2 (red), IDH1/2 (blue) or DNMT3A (purple). Samples with more than one epigenetic mutation were excluded from analysis. e) Violin plot of Shannon diversity index for diagnosis and relapse samples with RAS/MAPK (n=13; orange), FLT3 (n=11; green), or no signaling gene mutations (n=16; None; black). Samples with both a RAS/MAPK and FLT3 mutation were excluded. f) Number of clones identified in samples with RAS/MAPK (n=13; orange), FLT3 (n=11; green), or no signaling gene mutations (n=16; None; black) stratified by disease state (Diagnosis, left panel; Relapse, right panel). Kruskal-Wallis test was used to determine statistical significance amongst groups (a-f). g) Fraction of sample in single- and double-mutant clones in samples with DNMT3A-NPM1 (n = 9; left panel), IDH2-NPM1 (n = 12; center panel), and TET2-NPM1 (n = 20; right panel) mutations. Individual samples denoted by connecting lines. Two-way ANOVA used to determine statistical significance (g) *P<0.05, **P<0.01, ***P<0.001 denoted for all panels.
Fig. 3.
Fig. 3.. Identification of genotype-immunophenotype relationships using simultaneous single-cell DNA+Protein sequencing.
a) Uniform manifold approximation and projection (UMAP) plot of 31 communities identified based on aggregate protein data from entire patient cohort (n=43) with cells clustered by immunophenotype. b) Fraction of cells within a given disease stage (diagnosis, CR, relapse) clustered into the 31 communities previously identified across cohort with colors matching community identity in Fig. 3a. c) Bar graphs depicting fraction of cells from a given disease state (diagnosis, CR, relapse) identified within a community. Community number with corresponding immunophenotype signature based on immunophenotype markers enriched within that community denoted. Colors of community denoted in UMAP in Extended Data Fig. 3b. d) Dot plot depicting expression of immunophenotypic markers by genotype-specific clones. Normalized expression of each marker depicted by color (blue = low, red = high) with size of dot denoting the fraction of cells within each genotyped clone that expresses the marker. Immunophenotype markers grouped by corresponding lineage associations. Top bar, gray = WT, green spectrum = DNMT3A clones, red spectrum = TET2 clones, blue spectrum = IDH2 clones. Full genotype for each column denoted at bottom of the dotplot.
Fig. 4.
Fig. 4.. Clonal and immunophenotypic single cell analysis of longitudinal patient samples while undergoing 7+3 chemotherapy.
a) Changes in number of clones for NPM1-mutant patients (n=8) where samples were analyzed longitudinally while undergoing therapy. Individual patients are indicated by connecting line with point at each disease state for which sample was available. Blue = IDH2 co-mutation at diagnosis by bulk sequencing (n=4 patients); Red = TET2 co-mutation at diagnosis by bulk sequencing (n=4 patients). b-e) Analysis of paired samples of representative patient G (Pt G) that underwent clonal change during treatment. b) Changes in clone frequencies at each disease state. Only genotypes identified in 1% or higher of total cells from at least one sample are depicted for clarity. Color of line denotes specific genotype also used in Fig. 4c. c) Uniform manifold approximation and projection (UMAP) plot of Pt G samples at diagnosis (left), CR (center), and relapse (right) clustered by immunophenotype with genotype overlaid. d) UMAPs of Pt G samples denoting relative expression of CD135 (FLT3) as patient underwent therapy. Color depicts relative expression (blue = low, red = high). e) Violin plots of selected immunophenotype markers (CD135/FLT3, top; CD16, center; CD117, bottom) that change significantly from diagnosis to relapse in Pt G samples. Color denotes disease state (diagnosis, yellow; CR, red; relapse, blue). f-h) Analysis of paired samples of representative patient I (Pt I) that underwent clonal change during treatment. f) Clonograph of diagnosis sample from patient I. Height of each bar represents the cell count of the clone identified below. Clone genotype is depicted by color with WT in light beige, heterozygous mutations in orange, and homozygous mutations in red. g) Changes in clone frequencies at each disease state as in Fig. 4b. h) Uniform manifold approximation and projection (UMAP) plots of Pt I samples at diagnosis (left) and relapse (right) clustered by immunophenotype with relative expression of CD14 overlaid. Color denotes relative expression (blue = low, red = high).
Fig. 5.
Fig. 5.. scDNA+Protein analysis of clonal sweep in Patient F.
a) Changes in clone frequencies at each disease state. Only genotypes identified in 1% or higher of total cells from at least one sample are depicted for clarity. The color of line denotes specific genotype also used in Extended Data Fig. 5a. b) Uniform manifold approximation and projection (UMAP) plot of Pt F samples at diagnosis (left) and relapse (right) clustered by immunophenotype with genotype overlaid. c) UMAP from b with relative expression of CD14 overlaid. Color depicts relative expression (blue = low, red = high). d) Plot depicting expression of immunophenotypic markers CD117 (Y axis) and CD14 (X axis) by each identified clone found in Pt F samples. Normalized expression of each marker is depicted by dot location with size of dot denoting the fraction of the clone that expresses the marker. Genotype is denoted by same color as in Fig. 5a and 5b.
Fig. 6.
Fig. 6.. Matched CITE-seq analysis correlates scDNA+Protein results and identifies differentially expressed pathways upon relapse.
a) UMAPs derived from CITE-seq analysis and clustered based on similarities to reference cell clusters (Extended Data Fig. 6a) for Pt F diagnosis (top), Pt F relapse (center), and Pt B relapse (bottom). Cell cluster identities are denoted based on cell identity in reference atlas (Extended Data Fig. 6a). bcd) Scatter dot plots of single cell CD117 (b), CD14 (c) and CD11b (d) antibody tag reads from cells clustered as Multilin-GMP-1 (b) or Intermediate Mono-1 (cd) cells from each sample (n=3). Bold dotted line denotes the mean. Kruskal-Wallis test was used to determine statistical significance amongst groups. ***P<0.001, ****P<0.0001 denoted. e) Heatmap of genes found to be differentially expressed in Multilin-GMP-1 (left, blue bar), Intermediate Mono-1 (center, yellow bar), and Intermediate Mono-3 (right, red bar) cell clusters between Pt F Diagnosis and both relapse samples (Pt F Relapse, Pt B Relapse). Heatmap scale denotes log fold gene expression from high (yellow) to low (blue). Select genes are denoted in red. Asterisks indicate whether column is a comparison between the paired samples (* denotes Pt F Diagnosis-Pt F Relapse) or unpaired samples (** denotes Pt F Diagnosis-Pt B Relapse). f) Waterfall plot of Z-scores (X) and adjusted P values (Y) for GO:Biological Processes found to be differentially expressed in Pt F diagnosis sample compared to Pt F and Pt B relapse samples by AltAnalyze. Color of dot denotes significance based on adjusted P values < 0.05 (dashed line) in red. g) Network connectivity map denoting the interactions of differentially expressed genes from Fig. 6e.

References

    1. Marando L. & Huntly B. J. P. Molecular Landscape of Acute Myeloid Leukemia: Prognostic and Therapeutic Implications. Curr Oncol Rep 22, 61 (2020). 10.1007/s11912-020-00918-7 - DOI - PMC - PubMed
    1. Cancer Genome Atlas Research N. et al. Genomic and epigenomic landscapes of adult de novo acute myeloid leukemia. N Engl J Med 368, 2059–2074 (2013). 10.1056/NEJMoa1301689 - DOI - PMC - PubMed
    1. Miller C. A., Wilson R. K. & Ley T. J. Genomic landscapes and clonality of de novo AML. N Engl J Med 369, 1473 (2013). 10.1056/NEJMc1308782 - DOI - PMC - PubMed
    1. Khoury J. D. et al. The 5th edition of the World Health Organization Classification of Haematolymphoid Tumours: Myeloid and Histiocytic/Dendritic Neoplasms. Leukemia 36, 1703–1719 (2022). 10.1038/s41375-022-01613-1 - DOI - PMC - PubMed
    1. Arber D. A. et al. International Consensus Classification of Myeloid Neoplasms and Acute Leukemias: integrating morphologic, clinical, and genomic data. Blood 140, 1200–1228 (2022). 10.1182/blood.2022015850 - DOI - PMC - PubMed

Publication types

LinkOut - more resources