[Preprint]. 2024 Nov 15:2024.11.12.623298.
doi: 10.1101/2024.11.12.623298.

International multi-cohort analysis identifies novel framework for quantifying immune dysregulation in critical illness: results of the SUBSPACE consortium

Affiliations

International multi-cohort analysis identifies novel framework for quantifying immune dysregulation in critical illness: results of the SUBSPACE consortium

Andrew R Moore et al. bioRxiv. .

Abstract

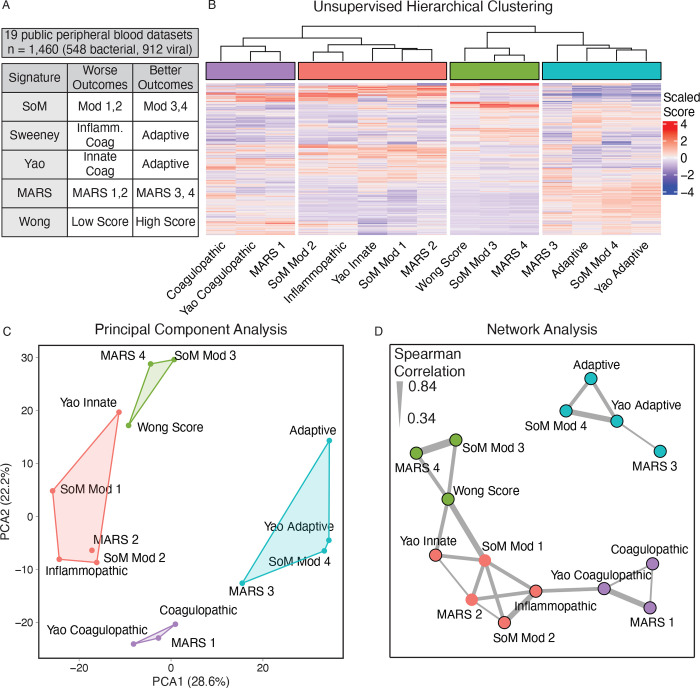
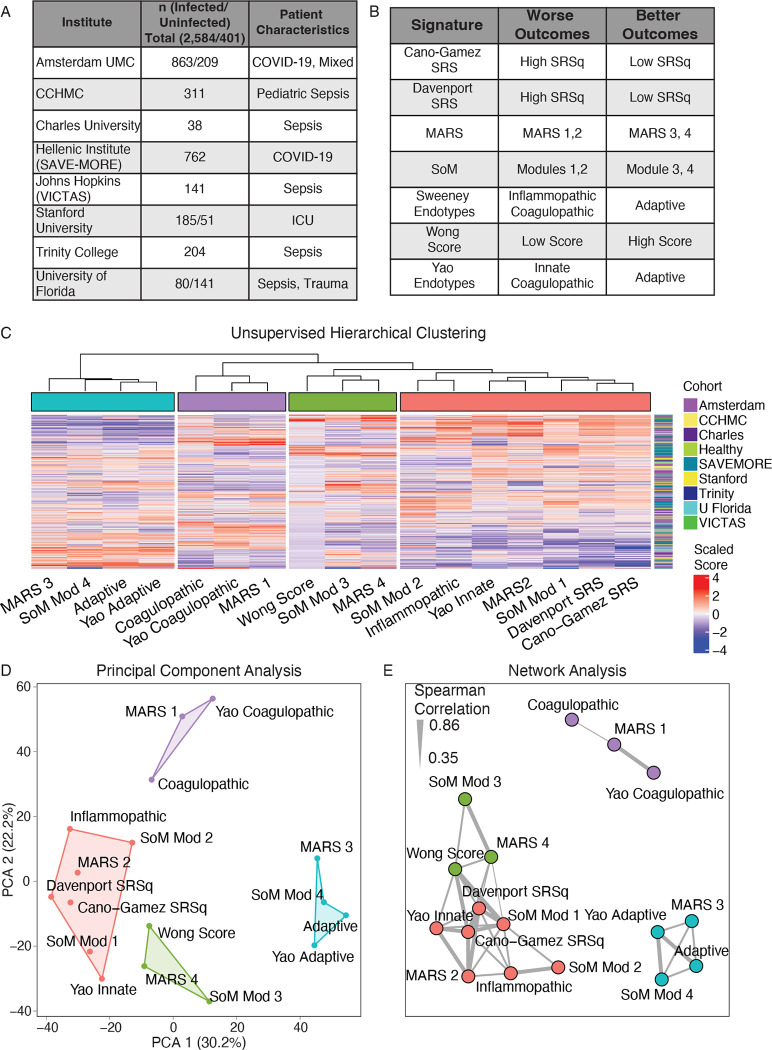
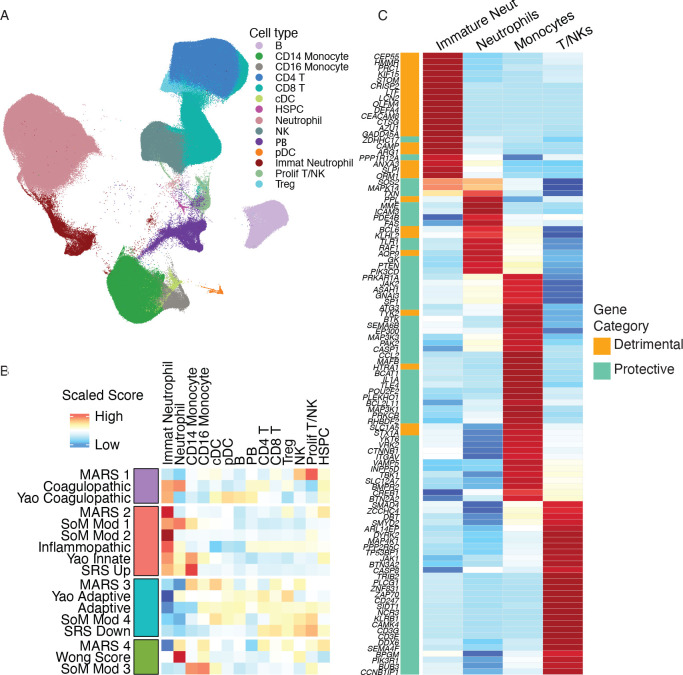
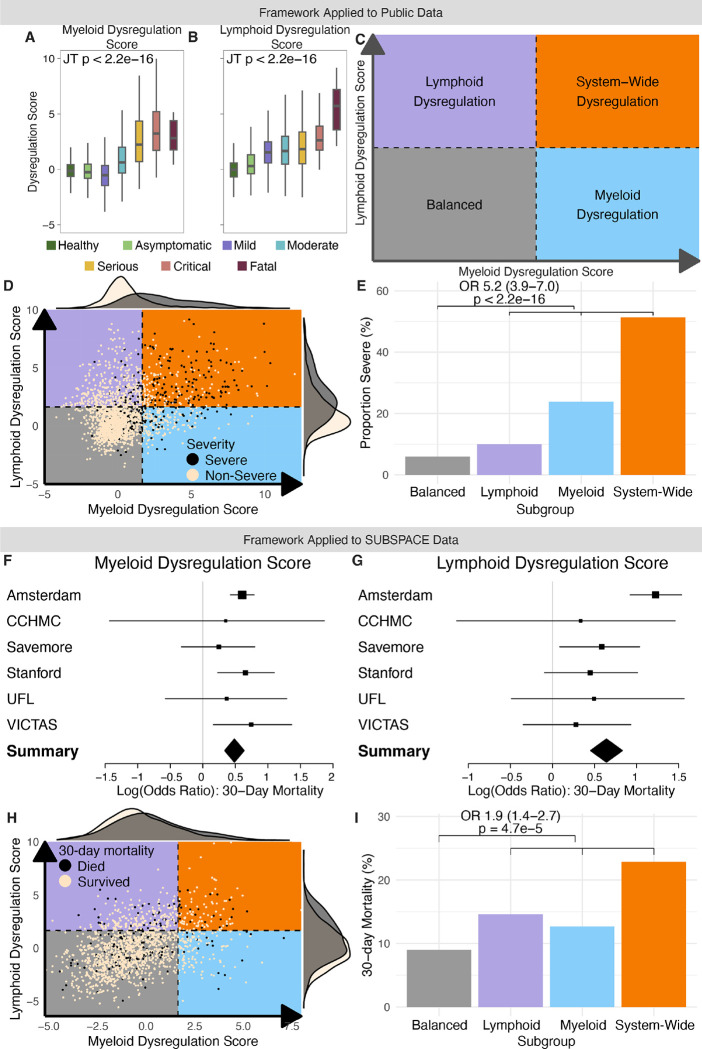
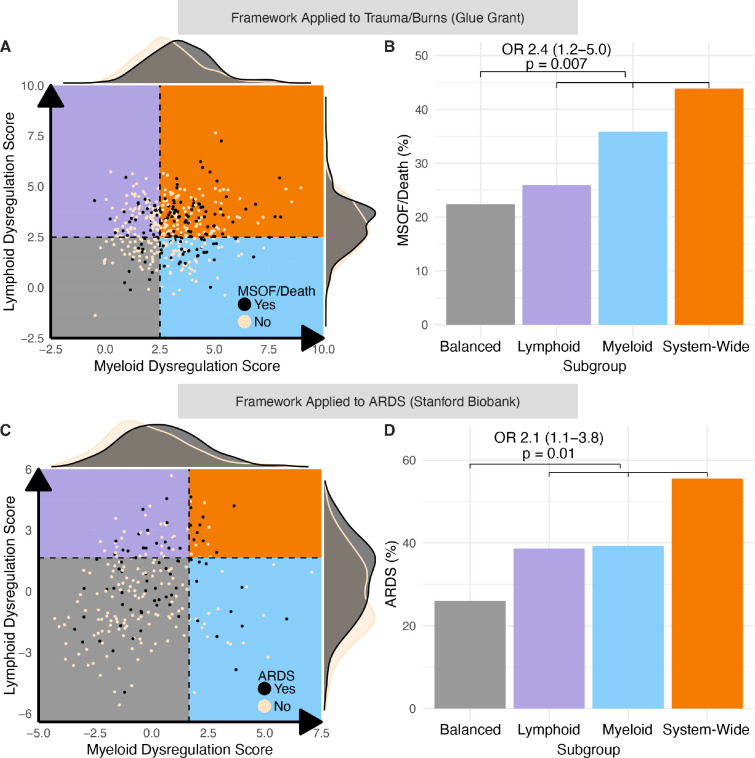
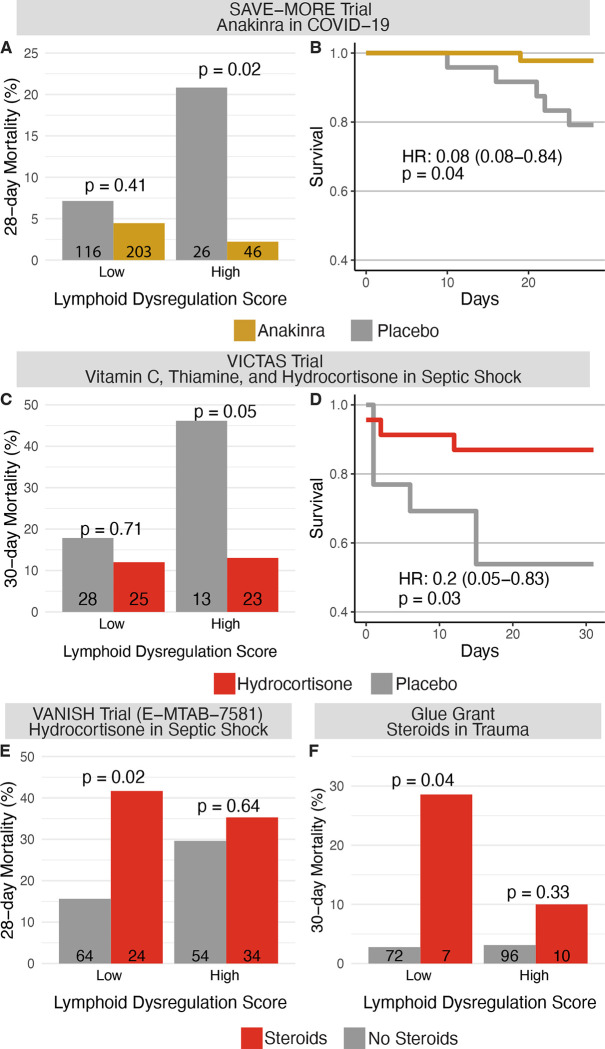
Progress in the management of critical care syndromes such as sepsis, Acute Respiratory Distress Syndrome (ARDS), and trauma has slowed over the last two decades, limited by the inherent heterogeneity within syndromic illnesses. Numerous immune endotypes have been proposed in sepsis and critical care, however the overlap of the endotypes is unclear, limiting clinical translation. The SUBSPACE consortium is an international consortium that aims to advance precision medicine through the sharing of transcriptomic data. By evaluating the overlap of existing immune endotypes in sepsis across over 6,000 samples, we developed cell-type specific signatures to quantify dysregulation in these immune compartments. Myeloid and lymphoid dysregulation were associated with disease severity and mortality across all cohorts. This dysregulation was not only observed in sepsis but also in ARDS, trauma, and burn patients, indicating a conserved mechanism across various critical illness syndromes. Moreover, analysis of randomized controlled trial data revealed that myeloid and lymphoid dysregulation is linked to differential mortality in patients treated with anakinra or corticosteroids, underscoring its prognostic and therapeutic significance. In conclusion, this novel immunology-based framework for quantifying cellular compartment dysregulation offers a valuable tool for prognosis and therapeutic decision-making in critical illness.


Conflict of interest statement

Conflicts of Interest NJM reports consulting fees from Novartis, Inc, AstraZeneca, Inc, and Endpoint Health, Inc (>2 years ago) YH is employed by Inflammatix, Inc. PK is co-founder, consultant to, and a scientific advisor to Inflammatix, Inc. TES is co-founder and CEO of Inflammatix, Inc. All other authors report no disclosures or conflicts of interest

Figures

Figure 1:
Figure 1:. Identification of consensus molecular clusters in public data
(A) We applied 5 sepsis signatures to 19 datasets inclusive of 1,460 samples from viral and bacterially infected patients (B) Unsupervised hierarchical clustering performed by scaled gene expression score (x-axis) across all samples (y-axis) identified 4 consensus molecular clusters (C) The four identified consensus molecular clusters separated well in principal component analysis (D) Network analysis was performed on scaled scores using spearman correlation >0.33 to identify edges. Clusters were identified using a greedy forward algorithm, which identified four clusters mirroring those identified by unsupervised hierarchical clustering
Figure 2:
Figure 2:. Identification of consensus molecular clusters in SUBSPACE data
(A) We applied 7 sepsis signatures to 10 novel datasets (B) Unsupervised hierarchical clustering performed by scaled gene expression score (x-axis) across all samples (y-axis) identified 4 consensus molecular clusters. Samples did not cluster together by cohort (C) The four identified consensus molecular clusters separated well in principal component analysis (D) Network analysis was performed on scaled scores using spearman correlation >0.35 to identify edges. Clusters were identified using a greedy forward algorithm, which identified four clusters mirroring those identified by unsupervised hierarchical clustering
Figure 3:
Figure 3:. Single cell analysis of consensus molecular clusters
(A) We integrated 4 whole blood single-cell RNA sequencing datasets from sepsis patients inclusive of the neutrophil compartment and identified 15 unique cell types using the Seurat and Scanpy pathways. Uniform Manifold Approximation Projection of cell types is shown. (B) We evaluated scaled gene expression signatures across these cell types, showing that the scores included in each consensus molecular cluster were expressed in similar cell types. The red cluster (MARS 2, SoM Module 1/2, Sweeney Inflammopathic, Yao Innate, and SRS signatures) were predominantly expressed with immature neutrophils. The blue cluster (MARS 3, Yao Adaptive, Sweeney Adaptive, and SoM Module 4) were predominantly expressed in T/NK cells. The purple cluster (MARS 1, Sweeney Coagulopathic, and Yao Coagulopathic) were composed of intermediate expression of neutrophils and T/NK cells. The Green Cluster (MARS 4, Wong score, and SoM Module 3) were predominantly expressed in mature neutrophils and monocytes (C) We then developed a cell-type specific score by evaluating scaled expression of each gene across all end-type signatures and selecting 104 genes that were selectively expressed (defined by >1 standard deviation greater than other cell-types) in myeloid or T/NK cell types. We then divided these genes into detrimental or protective genes based on whether the signature they were derived from was associated with worse or better outcomes in prior studies.
Figure 4:
Figure 4:. Evaluation of Consensus Immune Dysregulation Framework in Public and SUBSPACE data
(A) Association of myeloid dysregulation score on the y-axis with severity on the X-axis. P-value represents Jonkheere-Terpstra t-test (B) Association of lymphoid dysregulation score on the y-axis with severity on the X-axis. P-value represents Jonkheere-Terpstra t-test (C) Theoretical Consensus Immune Dysregulation Framework for defining immune dysregulation with myeloid dysregulation on one axis and lymphoid dysregulation on the other axis. Provides a means of subgrouping patients into four subgroups depending on the level of dysregulation present: (1) balanced - both myeloid and lymphoid dysregulation scores low; (2) lymphoid dysregulation - lymphoid dysregulation score is elevated while myeloid dysregulation score is low; (3) myeloid dysregulation - myeloid dysregulation score is elevated while lymphoid dysregulation score is low; and (4) system-wide dysregulation - both myeloid and lymphoid dysregulation scores are elevated (D) Consensus Immune Dysregulation Framework applied to public co-normalized data. Cut-offs are defined by a Z-score of 1.65 relative to healthy patients. Black dots represent patients with severe infectious (defined by ICU admission) while tan dots represent non-severe infections (E) Barplot representing proportion of severe infections (y-axis) by immune dysregulation framework subgroup (x-axis). Odds ratio represents odds if patient is dysregulated on any axis relative to “Balanced” subgroup (F) Association of continuous myeloid dysregulation score with 30-day mortality by cohort (G) Association of Lymphoid dysregulation score with 30-day mortality by cohort (H) Consensus Immune Dysregulation Framework applied to SUBSPACE co-normalized data. Cut-offs are defined by a Z-score of 1.65 relative to healthy patients. Black dots represent patients who died within 30-days while tan dots represent survivors. (I) Barplot representing proportion of 30-day mortality (y-axis) by immune dysregulation framework subgroup (x-axis). Odds ratio represents odds if patient is dysregulated on any axis relative to “Balanced” subgroup
Figure 5:
Figure 5:. Application of Consensus Immune Dysregulation Framework to other critical illness syndromes
(A) Consensus Immune Dysregulation Framework applied to non-infected trauma and burn patients from the Glue grant. Cut-offs are defined by a Z-score of 2.5 relative to healthy patients. Black dots represent patients with multi-system organ failure or death while tan dots represent survivors without multi-system organ failure. (B) Barplot representing proportion of multi-system organ failure or death (y-axis) by immune dysregulation framework subgroup (x-axis). Odds ratio represents odds if patient is dysregulated on any axis relative to “Balanced” subgroup (C) Consensus Immune Dysregulation Framework applied to Stanford data. Cut-offs are defined by a Z-score of 1.65 relative to healthy patients. Black dots represent patients with Acute Respiratory Distress Syndrome (ARDS) while tan dots represent those without ARDS (D) Barplot representing proportion of severe ARDS (y-axis) by immune dysregulation framework subgroup (x-axis). Odds ratio represents odds if patient is dysregulated on any axis relative to “Balanced” subgroup
Figure 6:
Figure 6:. Association of Lymphoid Immune Dysregulation with treatment
(A) Barplot represents 28-day mortality on the y-axis stratified by high and low lymphoid dysregulation scores (defined by Z-score ≥1.65) and anakinra (gold) vs placebo (grey) treatment in the SAVE-MORE clinical trial in COVID-19 patients showing that lymphoid dysregulation is associated with disproportionate benefit from anakinra therapy relative to patients with low (balanced) lymphoid responses. P values represent Fisher’s Exact test. (B) Kaplan-Meier survival curve for 28-day survival in patients with lymphoid dysregulation stratified by anakinra (gold) and placebo (grey). Cox proportional hazard ratio adjusted for age, sex, and SOFA score. (C) Barplot representing 30-day mortality (y-axis) in the VICTAS trial (a randomized controlled trial of vitamin C, thiamine, and hydrocortisone in sepsis patients in the intensive care unit) stratified by high and low lymphoid dysregulation score (defined by median score across the entire cohort given lack of healthy patients) and treatment (red) versus placebo (grey). Patients who received open-label steroids are excluded. Results indicate that lymphoid dysregulation was associated with disproportionate benefit from steroids, vitamin C, and thiamine therapy (D) Kaplan-Meier survival curve for 30-day survival in patients with lymphoid dysregulation stratified by treatment (red) versus placebo (grey). Cox proportional hazard ratio is adjusted for age and sex. (E) Barplot representing 28-day mortality (y-axis) in the VANISH trial stratified by high and low lymphoid dysregulation score (defined by median score) and randomized steroid treatment (red). Indicates that patients with a low (balanced) lymphoid dysregulation score were disproportionately harmed by steroid therapy (F) Barplot representing 30-day mortality (y-axis) in trauma patients in the glue grant stratified by high and low lymphoid dysregulation score (defined by Z-score ≥2.5 relative to healthy patients) and open-label steroid therapy (red). Indicates that patients with a low (balanced) lymphoid dysregulation score were disproportionately harmed by steroid therapy.

Similar articles

References

    1. Berthelsen P. G. & Cronqvist M. The first intensive care unit in the world: Copenhagen 1953. Acta Anaesthesiol. Scand. 47, 1190–1195 (2003). - PubMed
    1. Zimmerman J. E., Kramer A. A. & Knaus W. A. Changes in hospital mortality for United States intensive care unit admissions from 1988 to 2012. Crit. Care 17, R81 (2013). - PMC - PubMed
    1. Maslove D. M. et al. Redefining critical illness. Nat. Med. 28, 1141–1148 (2022). - PubMed
    1. Marshall J. C. Why have clinical trials in sepsis failed? Trends Mol. Med. 20, 195–203 (2014). - PubMed
    1. Antcliffe D. B. et al. Transcriptomic Signatures in Sepsis and a Differential Response to Steroids. From the VANISH Randomized Trial. Am. J. Respir. Crit. Care Med. 199, 980–986 (2019). - PMC - PubMed

Publication types

LinkOut - more resources