[Preprint]. 2024 Nov 15:2024.11.14.623592.
doi: 10.1101/2024.11.14.623592.

INTERSPECIES ORGANOIDS REVEAL HUMAN-SPECIFIC MOLECULAR FEATURES OF DOPAMINERGIC NEURON DEVELOPMENT AND VULNERABILITY

Affiliations

INTERSPECIES ORGANOIDS REVEAL HUMAN-SPECIFIC MOLECULAR FEATURES OF DOPAMINERGIC NEURON DEVELOPMENT AND VULNERABILITY

Sara Nolbrant et al. bioRxiv. .

Abstract

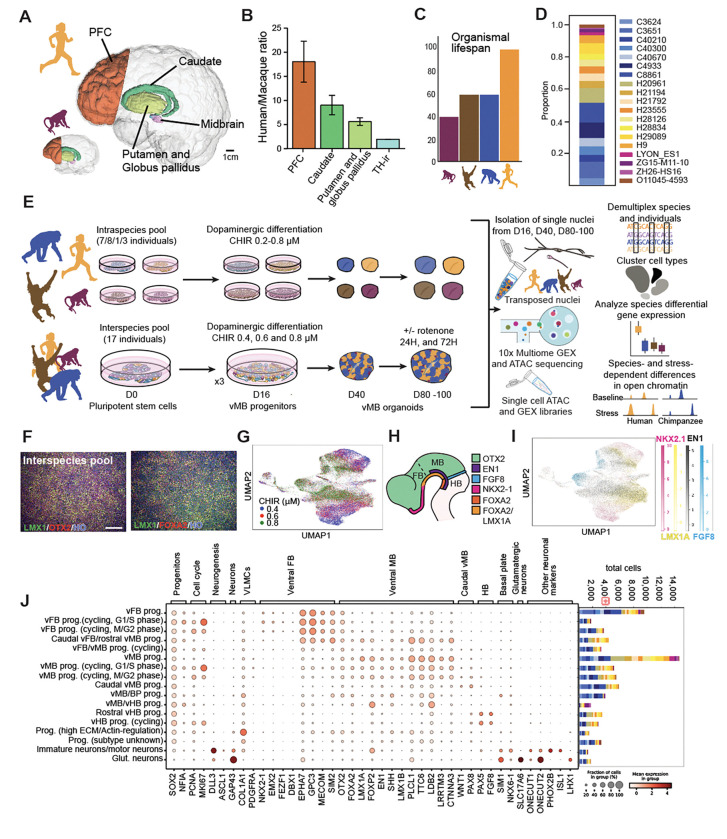
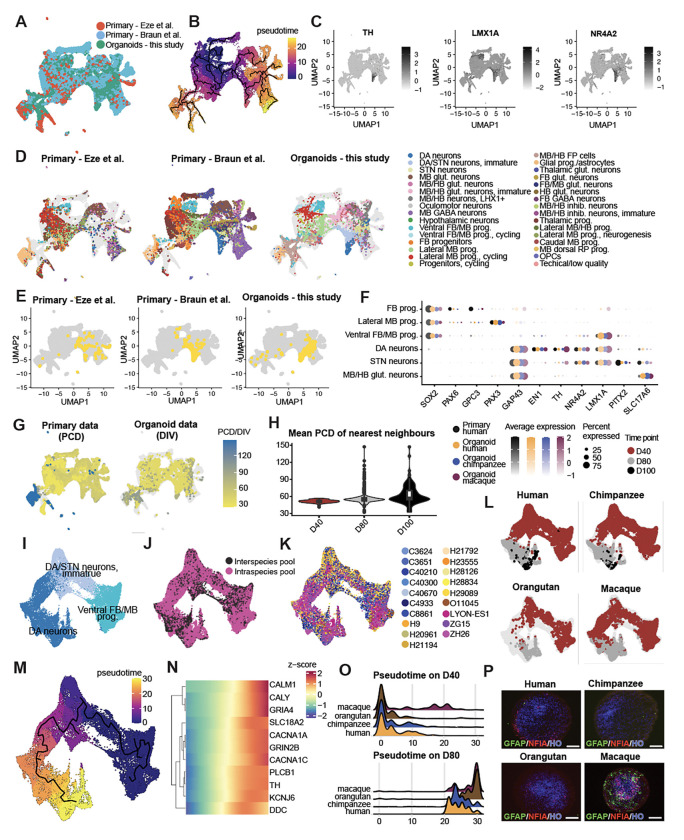
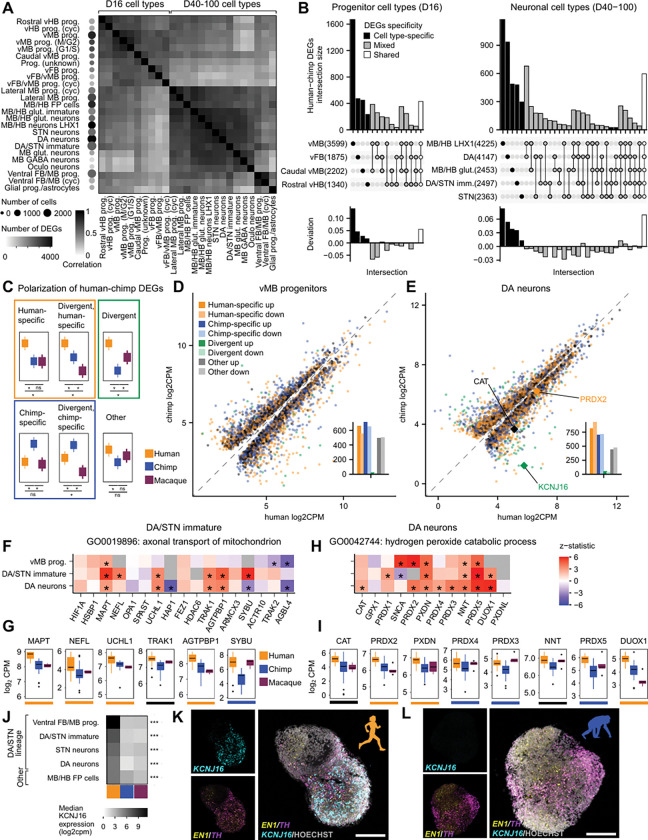
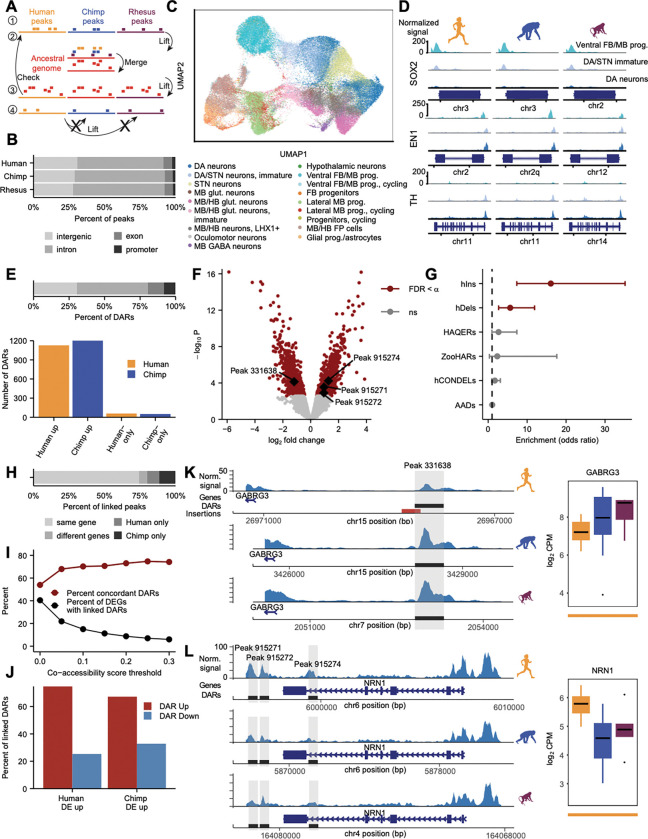
The disproportionate expansion of telencephalic structures during human evolution involved tradeoffs that imposed greater connectivity and metabolic demands on midbrain dopaminergic neurons. Despite the central role of dopaminergic neurons in human-enriched disorders, molecular specializations associated with human-specific features and vulnerabilities of the dopaminergic system remain unexplored. Here, we establish a phylogeny-in-a-dish approach to examine gene regulatory evolution by differentiating pools of human, chimpanzee, orangutan, and macaque pluripotent stem cells into ventral midbrain organoids capable of forming long-range projections, spontaneous activity, and dopamine release. We identify human-specific gene expression changes related to axonal transport of mitochondria and reactive oxygen species buffering and candidate cis- and trans-regulatory mechanisms underlying gene expression divergence. Our findings are consistent with a model of evolved neuroprotection in response to tradeoffs related to brain expansion and could contribute to the discovery of therapeutic targets and strategies for treating disorders involving the dopaminergic system.

Keywords: Brain evolution; Parkinson’s disease; dopaminergic; iPSCs; midbrain; organoids; oxidative stress; single cell genomics.


Conflict of interest statement

Declaration of interests The authors declare no competing interests.

Figures

Figure 1:
Figure 1:. Pluripotent stem cell-derived interspecies cultures model primate ventral midbrain specification and development
A. Unequal scaling of dopamine target regions in human compared to macaque with regions quantified by MRI highlighted. B. Human/macaque volume ratios from MRI quantification of dopamine target regions PFC, caudate, and putamen/globus pallidus. The ratio of DA neuron numbers was calculated through comparison of TH-ir cells stereotactically quantified by,. C. An increased organismal lifespan,, is an additional factor that contributes to the enhanced stress human DA neurons face. D. Proportions of all individuals at D16, post quality control and doublet removal. Human lines: H9, H20961, H21194, H21792, H23555, H28126, H28334, H29089; Chimpanzee lines: C3624, C3651, C4933, C8861, C40210, C40300, C40670; Orangutan line: O11045–4593; Macaque lines: LYON-ES1, ZG15-M11–10, ZH26-HS16. E. Experimental design for generating inter- and intra-species midbrain organoids for paired snRNA- and ATAC-sequencing. F. Interspecies ventral midbrain culture at D14, with immunocytochemical labeling of FOXA2, OTX2 and LMX1A/B. G. Anticipated rostro-caudal patterning effects of the different CHIR99021 concentrations that were applied to the inter- and intraspecies pools. H. UMAP of cells collected at D16, colored by MULTI-seq barcode identity which corresponds to the applied CHIR99021 concentration. I. Rostral-caudal expression domains of key genes to determine cell identity within ventral diencephalon, midbrain and hindbrain. J. UMAP of cells collected at D16, colored by key genes to determine rostral-caudal identity. K. Dotplot of the expression of cell type markers for the assigned cluster identities at D16 (left), with a bar chart of the contribution of individuals to the different cell types (right), with colors as labeled in D. Scale bars: 200 μm. See also Figure S1 and S2. PFC, prefrontal cortex; TH, Tyrosine hydroxylase; prog, progenitors; vMB, ventral midbrain; vFB, ventral forebrain, vHB, ventral hindbrain; BP, basal plate; ECM, extracellular matrix; glut, glutamatergic; DA, dopaminergic; VLMCs, vascular leptomeningeal cells.
Figure 2:
Figure 2:. Transcriptional landscape and cell type diversity of developing primate ventral midbrain organoids
A. Ventral midbrain organoids from the human pool (n=8 individuals), chimpanzee pool (n=7 individuals), orangutan (O11045–4593), and macaque (LYON-ES1), labeled for TH, FOXA2 and Hoechst at D40 and D80. B. Interspecies ventral midbrain organoids, labeled for TH/FOXA2 or TH/MAP2 and Hoechst at D40, 80 and 100. C. Proportions of all individuals at D40, 80 and 100, post quality control and doublet removal. D-F. UMAPs of cells collected at D40–100, colored by species (D), time point (E) and assigned cell type identity (F). G. Dotplot of the expression of cell type markers for the assigned cluster identities at D40–100 (left), with a bar chart of the contribution of individuals to the different cell types (right), with colors as labeled in C. H. Expression of cell type and neuronal subtype genes in human (left) and chimpanzee (right) cells of the assigned clusters. I. Percentage overlap of manually annotated organoid derived cell types and labeled transferred cell types found in the developing human brain in the first trimester. Scale bars: 200 μm. See also Figure S1, S2 and S3. prog, progenitors; vMB, ventral midbrain; vFB, ventral forebrain, vHB, ventral hindbrain; BP, basal plate; ECM, extracellular matrix; glut, glutamatergic; GABA, GABAergic; DA, dopaminergic; STN, subthalamic nucleus; glycin, glycinergic; FP, floor plate; RP, roof plate.
Figure 3:
Figure 3:. Midbrain neuron maturation timing in human and non-human primates
A-B. Principal component analysis (PCA) plots of the DA lineage cells, labeled by species (A), and time point (B). C-D. GO terms for the top (C) and bottom (D) loadings of principal component (PC) 1. E. Violin plots of PC1 values between species and time points. F-G. PCA plots colored by scaled and normalized expressions of genes that contribute to the separation along PC1. FGFR2 and WNT5A (F) are expressed in the less mature progenitor cells and CACNA1D, TH, SNCA, SLC18A2 and KCNJ6 (G) are expressed in the more mature neuronal cells within the DA lineage. H-K. Immunohistochemistry of macaque (ZH26, H), orangutan (O11045, I), chimpanzee pool (J) and human pool (K) D80 organoids, to visualize GFAP+ and NFIA+ glial progenitors/astrocytes, counterstained with hoechst (HO). Boxed regions in (H) and (K) are shown in higher magnification in (H’) and (K’). Scale bars: 200 μm.
Figure 4:
Figure 4:. Cell type specificity and evolutionary divergence of gene expression across ventral midbrain development
A. Clustered heatmap showing Pearson correlation between human-chimpanzee DEG scores (logFC * −log10pval) for all genes that were DE in at least one cell type across all D16 and D40–100 cell types with at least 200 cells for both human and chimpanzee. Dotplot on the left shows the number of human and chimpanzee cells (least common denominator) for that cell type, shaded by the number of human-chimpanzee DEGs with FDR < 0.05. B. UpSet plots showing the intersection of human-chimpanzee DEG lists for selected D16 (left) and D40–100 (right) cell types, ordered from cell type specific to shared intersections. Numbers in parentheses represent the total number of human-chimpanzee DEGs for that cell type. C. Scheme for classifying human-chimpanzee DEGs showing which comparisons are significant for each category (*, FDR < 0.05). D. Scatterplot showing average normalized expression across pseudobulk samples for each human-chimpanzee DEG in human versus chimpanzee D16 vMB progenitors, with points colored by categories from C and dotted y = x line. Barplots (insets) show the number of up- and down-regulated genes in each category. E. Same as D for D40–100 DA neurons. F. Heatmap showing z statistics for expressed genes in the top human-upregulated GO term in immature DA/STN neurons. G. Boxplots for human-chimpanzee DEGs belonging to the top human-upregulated GO term in immature DA/STN neurons showing normalized median gene expression values across pseudobulk samples (combination of species, experiment, individual) across species with colored lines below indicating polarization category. H-I. Same as F-G for the top human-upregulated GO term in DA neurons. J. Heatmap showing normalized median expression of KCNJ16 across human, chimpanzee, and macaque pseudobulk samples. KCNJ16 expression did not meet the expression threshold in the remaining D40–100 cell types. K-L. RNAscope of TH, EN1 and KCNJ16 in D40 intraspecies pooled organoids from human (K) and chimpanzee (L). Scale bars: 200 μm DEGs, differentially expressed genes; prog, progenitors; vMB, ventral midbrain; vFB, ventral forebrain, vHB, ventral hindbrain; glut, glutamatergic; GABA, GABAergic; DA, dopaminergic; STN, subthalamic nucleus; Oculo, oculomotor * p < 0.05, ** p < 0.01, *** p < 0.001
Figure 5:
Figure 5:. Evolution of the cis-regulatory landscape in ventral midbrain neurons
A. Schematic of computational pipeline for identifying consensus and species-specific ATAC-seq peaks across species. Step 1: Use iterative overlap merging to obtain a peak set for each species across all cell types. Step 2: Lift each species peak set to an ancestral genome and merge overlapping peaks according to user-defined rules. Step 3: Lift the consensus peak set back to individual species genomes and check the new position against the original location. Step 4: For any peaks that failed to lift over in steps 2 or 3, attempt to lift them over directly to the other species’ genomes and classify them as species-specific peaks if direct liftover fails. B. Stacked barplot showing the percent of step 1 peaks called within each species located in each genomic category. C. The consensus peak set (step 3 peaks) allows integration of human, chimpanzee, and macaque multiome snATAC-seq data. Cells are colored based on their snRNA-seq cell type annotation. D. Accessibility at marker genes within DA lineage cell types across species. E. Top, stacked barplot showing the percent of human-chimpanzee DARs and species-only peaks in DA neurons located in each genomic category. Bottom, barplot showing the numbers of human-up and chimpanzee-up consensus DARs and the numbers of human-only and chimpazee-only peaks. F. Volcano plot for human-chimpanzee consensus DARs in DA neurons with alpha = 0.1. G. Forest plot showing odds ratios and confidence intervals for the enrichment of evolutionary signatures within human-chimpanzee DA neuron DARs and species-only peaks with alpha = 0.05. H. Stacked barplot showing the percent of peaks that were linked via Cicero (within DA lineage cell types ventral FB/MB progenitors, DA/STN immature neurons, and DA neurons) to the same gene or different genes within human and chimpanzee data, or were linked only in human or only in chimpanzee. I. Plot showing the relationship between co-accessibility score threshold applied to Cicero links and the percent of DA neuron DEGs with linked DA neuron DARs as well as the percent concordant DARs (defined as the percent of DARs with increased accessibility linked to upregulated DEGs, considering links found in the species where the gene was upregulated). J. Barplot plot showing concordance as the percent of DA neuron DARs linked to upregulated DA neuron DEGs in each species at co-accessibility threshold 0.15. (n = 181 human-up DEGs with 229 linked DARs, 173 of chimpanzee-up DEGswith 231 linked DARs). K. Example of human-downregulated DA neuron DAR linked to human-specific downregulated DA neuron DEG GABRG3. Left, pseudobulk DA neuron snATAC-seq signal across human, chimpanzee, and macaque. The DAR overlaps a human-specific insertion from . Right, boxplot showing normalized GABRG3 gene expression values for pseudobulk samples across species. Line at bottom indicates polarization as in Fig. 4. L. Example of four human-upregulated DA neuron DARs linked to human-specific upregulated DA neuron DEG NRN1. DARs, differentially accessible regions; FDR, false discovery rate; ns, not significant; hIns, human-specific insertions; hDels, human-specific deletions; HAQERs, human ancestor quickly evolved regions; ZooHARs, Zoonomia-defined human accelerated regions; hCONDELs, human-specific deletions in conserved regions; AADs, archaic ancestry deserts; DEGs, differential expressed genes
Figure 6:
Figure 6:. Conserved and divergent gene regulatory networks in ventral midbrain specification and maturation
A. Activator eGRNs in the developing human midbrain organoids (D40–100) projected in a weighted UMAP based on co-expression and co-regulatory patterns. Nodes label hub TFs of eGRNs with number of target genes (color) and target regions (size) plotted, and edges label co-regulatory networks between eGRNs. B. Scatterplots of number of genes (right) and number of regions (left) in activator eGRNs identified in humans versus chimpanzees. C. Scatterplots of eGRN specificity score in D16 progenitors and D40–100 DA neurons in human versus chimpanzee, calculated based on target gene expression (left) and target region accessibility (right). D. eGRNs that have targets enriched for species-specific upregulated DEGs against other DEGs in DA lineage in humans or chimpanzees identified by Fisher’s exact test (p< 0.05, where other DEGs are defined as DEGs that are either not human/chimpanzee specific, or human/chimpanzee specific but down regulated in human/chimpanzee). Unions of DEGs from 3 D40–100 cell types (Ventral FB/MB progenitors, immature DA/STN neurons, and DA neurons) in the DA lineage were used for testing. TFs are colored if corresponding eGRN targets are significantly enriched for human (yellow), chimpanzee (blue) or both (red) species-specific up-regulated DEGs. E. Heatmaps for differential expression of hub TFs showing log2FC in human versus chimpanzee (left), and for percentage overlap of species-specific upregulated DEGs in eGRNs in human (middle) and chimpanzee (right) DA lineage cell types. P values were calculated using Fisher’s exact test against overlap with other DEGs. F. Boxplot of ZFHX3 expression across species in immature DA/STN neurons (line at the bottom represents human-specific polarization category) and human ZFHX3 eGRNs (formulated as TF-peaks-genes) intersecting with upregulated DEGs or DARs in human immature DA/STN neurons. G. Human eGRNs enriched for upregulated DEGs or DARs in human DA neurons from Fig 6E. Nodes were pruned to include only the top 1500 highly variable genes and peaks and nodes connected to DEGs and/or DARs are shown. Genes or peaks that are human-specific upregulated in DA neurons are highlighted with a black border and genes that are connected with the most edges are labeled. eGRN, enhancer-driven gene regulatory network; TF, transcription factor; CPM, counts per million; DEGs, differential expressed genes; DARs, differentially accessible regions. * p < 0.05, ** p < 0.01, *** p < 0.001
Figure 7:
Figure 7:. Oxidative stress induces conserved and species-specific responses in DA neurons
A. Experimental design for rotenone induced oxidative stress in organoids. D80 organoids were treated with 500 nM rotenone for 24- and 72 hours and were then immediately collected for multiomic snRNA- and ATAC-sequencing. B-C. Representative images of TH/FOXA2 and MAP2/FOXA2 immunohistochemistry in control organoids (B) and in organoids treated with rotenone for 72 hours (C), showing stress induced loss of TH+cells and fibers. D. PCA plot after subsetting DA neurons, colored by condition with the bottom trajectory corresponding to human cells and the top trajectory corresponding to chimpanzee cells. E. Volcano plot of condition DEGs (average response in human and chimpanzee, FDR < 0.05) between control and 24 hours of rotenone treatment. F. Top GO terms for 24 hours of rotenone treatment versus control ranked by the proportion of genes with FDR < 0.05. G. Bar plots showing log2(fold change) for selected genes in each individual (dots) across the timecourse of rotenone treatment (normalized to control median expression across individuals within each species). H. Heatmap showing log2(fold change) for 24 hours and 72 hours of rotenone treatment (average response in human and chimpanzee) versus control. I. Heatmap for percentage overlap of eGRNs targets and upregulated or downregulated DEGs in human (top) and chimpanzee (bottom) under rotenone treatment in 24 and 72 hours in comparison to control. P values were calculated using Fisher’s exact test against overlap with other DEGs. J. Scatterplot showing log2(fold change) between 24 hours of rotenone treatment and control in human versus chimpanzee for genes that were significant for the interaction of species and condition (FDR < 0.1) at 24 hours of rotenone treatment. K-L. Bar plots showing log2(fold change) across the timecourse of rotenone treatment (normalized to control within each species) for examples of genes that were significant for the interaction of species and condition at 24 hours of rotenone treatment: MCU (K) and BDNF (L). M-P. Knockdown simulation of PBX1 (L), POU3F2 (M), CREB5 (N), BACH2 (O) on human eGRN target gene based PCA embedding. Arrows indicate the shift of the cells from the original embedding calculated using the simulated gene expression matrix. Scale bars: 200 μm. GEX, gene expression; ATAC, assay for transposase-accessible chromatin; FDR, false discovery rate; CNTRL, no rotenone; 24H, 24 hours of rotenone treatment; 72H, 72 hours of rotenone treatment, Rot., rotenone * p < 0.05, ** p < 0.01, *** p < 0.001

References

    1. Björklund A., and Dunnett S.B. (2007). Dopamine neuron systems in the brain: an update. Trends Neurosci. 30, 194–202. 10.1016/j.tins.2007.03.006. - DOI - PubMed
    1. Brisch R., Saniotis A., Wolf R., Bielau H., Bernstein H.-G., Steiner J., Bogerts B., Braun K., Jankowski Z., Kumaratilake J., et al. (2014). The role of dopamine in schizophrenia from a neurobiological and evolutionary perspective: old fashioned, but still in vogue. Front. Psychiatry 5, 47. 10.3389/fpsyt.2014.00047. - DOI - PMC - PubMed
    1. Klein M.O., Battagello D.S., Cardoso A.R., Hauser D.N., Bittencourt J.C., and Correa R.G. (2019). Dopamine: Functions, Signaling, and Association with Neurological Diseases. Cell. Mol. Neurobiol. 39, 31–59. 10.1007/s10571-018-0632-3. - DOI - PMC - PubMed
    1. Diederich N.J., James Surmeier D., Uchihara T., Grillner S., and Goetz C.G. (2019). Parkinson’s disease: Is it a consequence of human brain evolution? Mov. Disord. 34, 453–459. 10.1002/mds.27628. - DOI - PMC - PubMed
    1. Varki A., and Altheide T.K. (2005). Comparing the human and chimpanzee genomes: searching for needles in a haystack. Genome Res. 15, 1746–1758. 10.1101/gr.3737405. - DOI - PubMed

Publication types

LinkOut - more resources