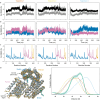
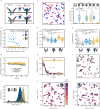
Extended Data Fig. 4:. Modeling strain energy in the ternary complex.
a, Differences in ternary complex geometry for a fast AS1 variant (AS117, left) and a slower variant which yet deforms more in the ternary complex (AS114, right). Design models of host-effector complex in state Y (blue and orange) aligned to the partner (pink) showing the allosteric clash, and (gray) AF2 predictions of the ternary complex aligned to the switch showing how the clash resolves through global strain. To model the strain energy from these structures using Hooke’s law, we measured the global deformation by the angle () the partner pivots around some axis (the “pivot axis”) to move from its clashing position to its AF2-predicted strained position. The binder helix in the interface with the partner tends to be positioned near the centerpoint of the deformation (the point around which the centroid of the partner pivots), and the structure of this helix is the same for all variants, so we used the axis of this helix (the “helix axis”) to approximate the orientation of the deforming secondary structure elements. For each variant shown, the left view places the pivot of the partner within the plane of the page (so the pivot axis is normal to the page), and the right view places the helix axis and the pivot axis both within the plane of the page. In the left view, lines are drawn from the pivot axis through the centroids of the clashing and strained partners; the angle between these lines is the angle of global deformation (). The right view shows the angle between the helix axis and the pivot axis (); this is large for the fast variant and small for the slow but highly deforming variant. b, Lack of correlation between predicted magnitude of deformation and the experimental strain energy of the ternary complex for a set of host designs (AS1, AS2, AS5, AS7, and the AS1 variants, plotted as circles colored by their experimental strain energy except for AS101, AS115, AS119, and AS120 which were left out of the analysis in (c) and (d) and are colored gray—34 designs in total). The strain energy can be estimated from the observed accelerated off-rate as follows.
Making the approximation that and does not vary with (Fig. S2) simplifies this expression.
The accelerated off-rate is assumed to be the maximum off-rate observed in the facilitated dissociation experiments (Fig. S10). Since the main partner-binder interface does not change across variants, the off-rate of the unstrained interface should be a constant, , with one exception: in some variants, the switch fusion may form additional stabilizing interactions with the partner, reducing the base off-rate (also measured in the facilitated dissociation experiments). These interactions can likely still form in the strained ternary complex to reduce the accelerated off-rate by the same factor. Thus, the smaller of and is used for . For , a value of 2e–4 s−1 was used because it gave the best correlation between predicted and experimental described in panel (d). Notably, this value is quite close to the partner off-rate from the unhindered binder fusion LHD101B4, 9e–5 s−1 (Fig. S7). (c) Linear correlation between the “spring constant” (which relates the experimental strain energy to the magnitude of the predicted deformation) and the perpendicularity of this deformation to the secondary structure elements in the complex for this set of host designs (circles colored as in (b)). A linear regression on the colored points is plotted as a black line. The perpendicularity is computed as the sine of the angle between the pivot axis and the helix axis, and the spring constant is computed using Hooke’s Law as follows.
This relationship suggests that deforming in a stiff direction (against rather than around helices) deforms the partner interface in a more destabilizing direction or better localizes strain to the partner interface instead of distributing the strain throughout the entire protein. d, Agreement between the experimental strain energy and the strain energy estimated entirely from the predicted structure of the strained ternary complex using Hooke’s Law for this set of host designs (circles colored as in (b)). A linear regression on the colored points is plotted as a black line. The spring constant was assumed to depend linearly on the deformation perpendicularity to the secondary structure elements, and the parameters of this correlation (m and b) were varied to fit the following expression to the experimental strain energies.
Sources of Error in this Analysis First, in this simple energetic model of facilitated dissociation described here and in Fig. S2, when the effector binds, the energy of the partner dissociation transition state will decrease by the binding energy of the effector. When the effector and partner are uncoupled, the energy of the ternary complex intermediate will decrease by the same amount so the activation barrier for partner dissociation will not change. When strain between the partner and effector is incorporated into the ternary intermediate, its energy will decrease less upon effector binding, reducing the activation barrier for partner dissociation. This simple energetic model thus assumes that the activation barrier for partner dissociation is directly related to the global energy of the ternary complex. In reality, acceleration of partner dissociation will arise from local deformation at the partner interface. Thus, put differently, the simple energetic model assumes that the global deformation is smoothly distributed across the entire protein. This assumption allows us to directly relate the global deformation predicted by AF2 to the local deformation at the partner interface measured by the accelerated partner off-rate. In reality, the deformation is likely not smoothly distributed, and this may at least partially explain the imperfect correlation between the predicted and experimental strain energy of the ternary complex. This is exemplified by how the partner dissociates more slowly from the AS1 ternary complex with the peptide effector than with the 3hb effector (Fig. 2e,f). Despite forming the same interactions and causing the same conformational change as the 3hb, the more deformable peptide appears to less effectively localize strain to the partner once in the ternary complex. Uneven distribution of strain in the ternary complex is also one possible mechanism underlying unidirectional competition in facilitated dissociation systems. Second, our model estimating the protein stiffness anisotropy using the orientation of the secondary structure elements is likely oversimplified. Proteins have finer levels of structure than the orientation of their secondary structure elements. Much like a normal mode analysis, a more sophisticated model could estimate local spring constants for smaller regions of the protein, then compute a strain energy for each region from its predicted deformation. Third, inaccuracies in the AF2 predictions of the strained ternary complex could cause much of the variation between the experimental and predicted strain energies. Clear cases of this, variants AS101, AS115, AS119, and AS120 (gray) which do not follow this correlation were left out of this analysis. We hypothesize that these variants can adopt an alternate, less-strained ternary complex conformation than the high-energy conformation predicted by AF2.


