[Preprint]. 2024 Nov 15:2024.11.12.623187.
doi: 10.1101/2024.11.12.623187.

Unveiling epigenetic regulatory elements associated with breast cancer development

Affiliations

Unveiling epigenetic regulatory elements associated with breast cancer development

Marta Jardanowska-Kotuniak et al. bioRxiv. .

Update in

Abstract

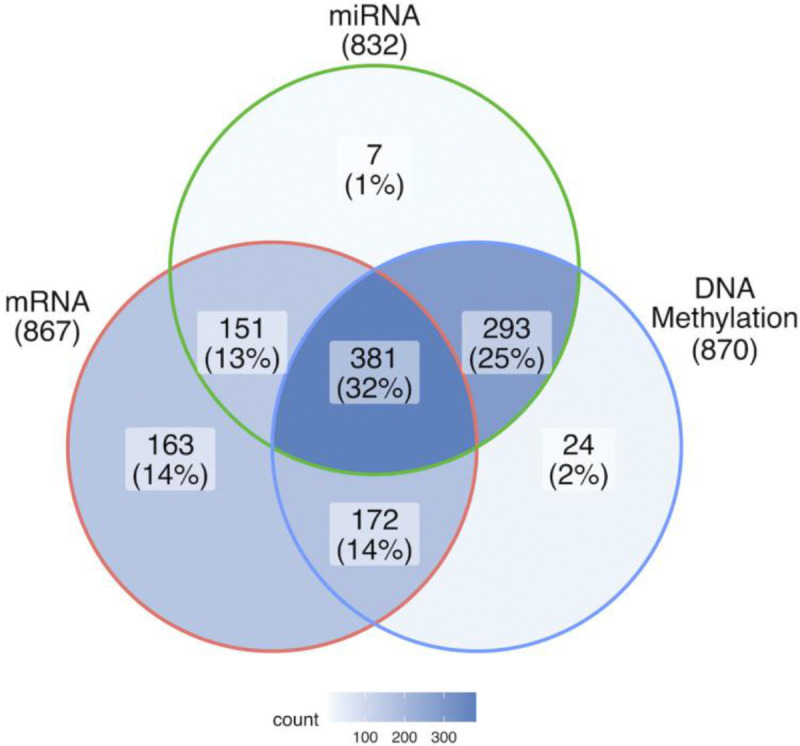
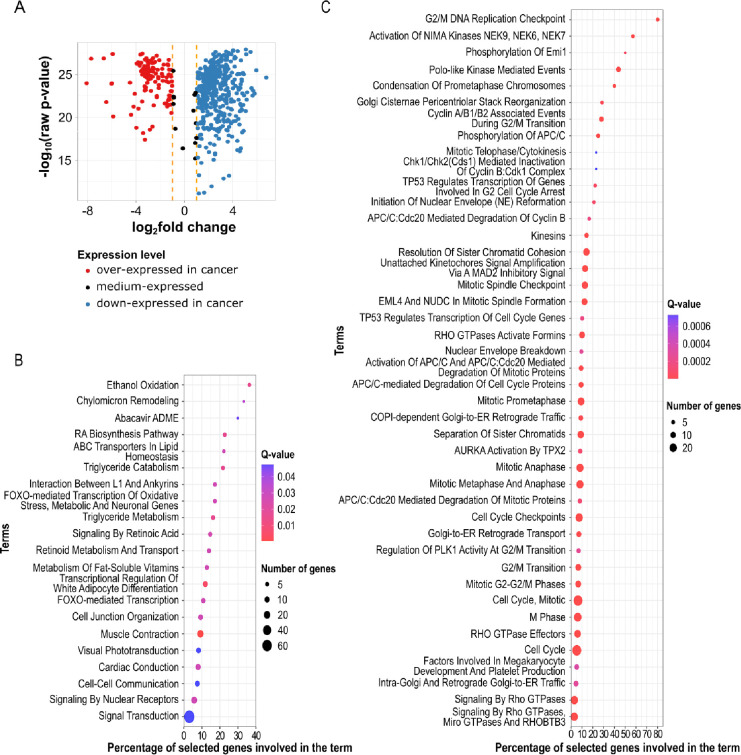
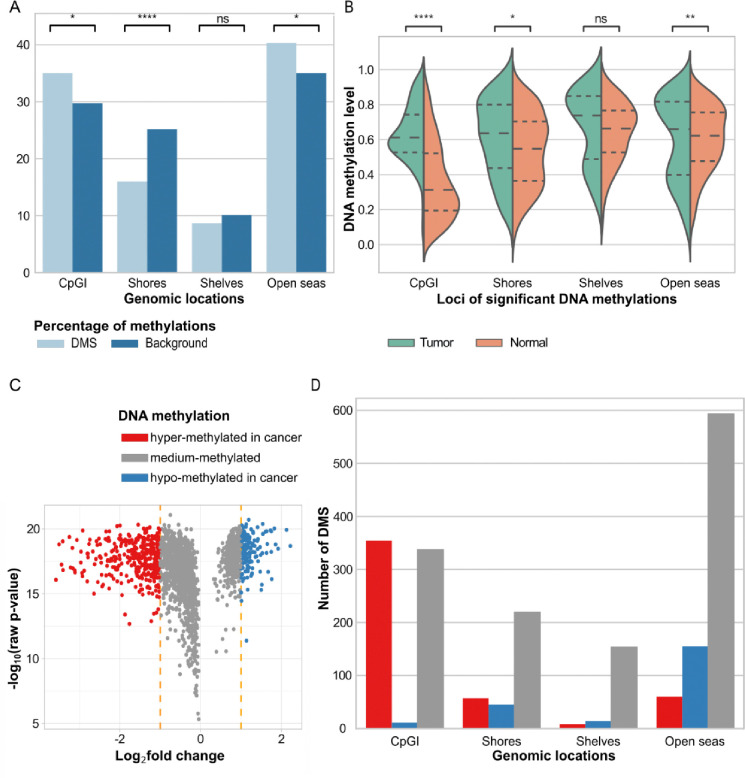
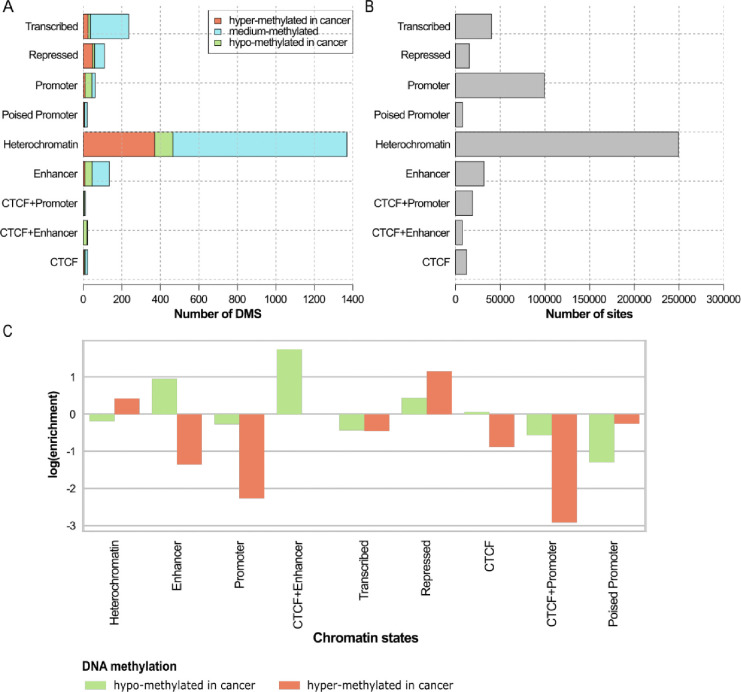
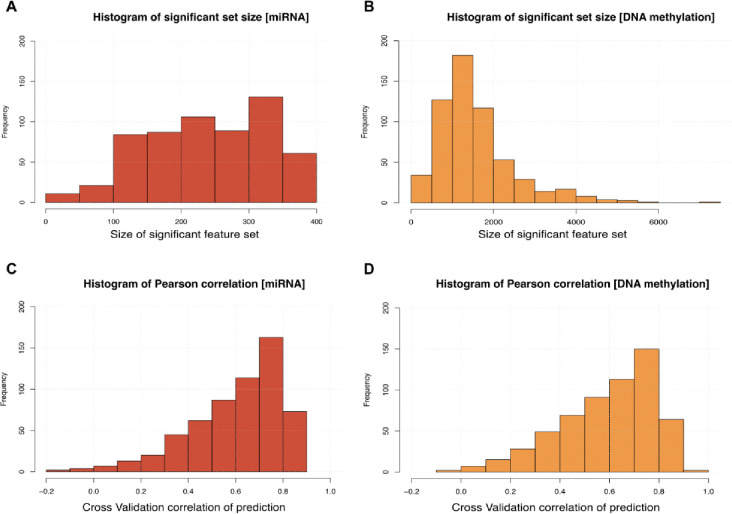
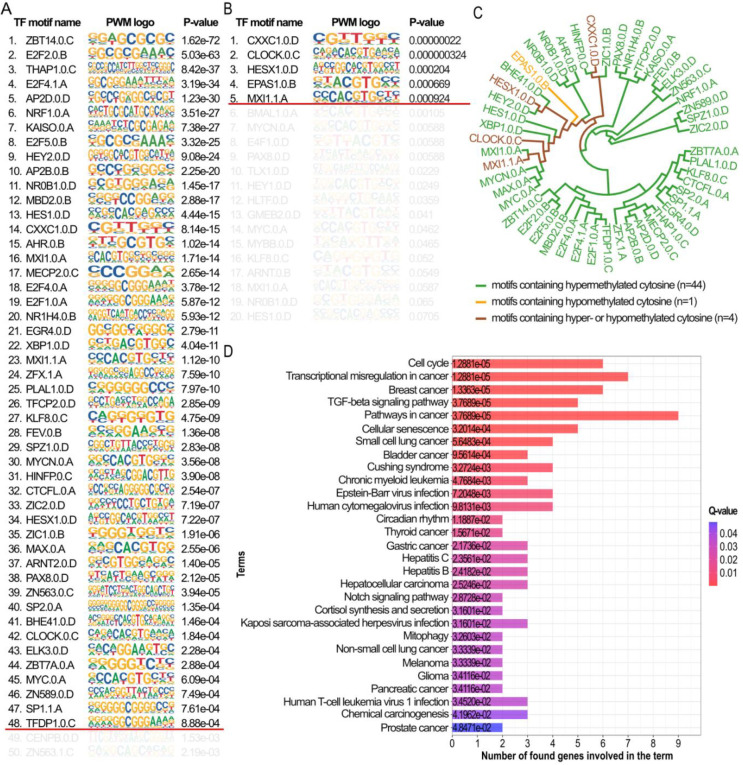
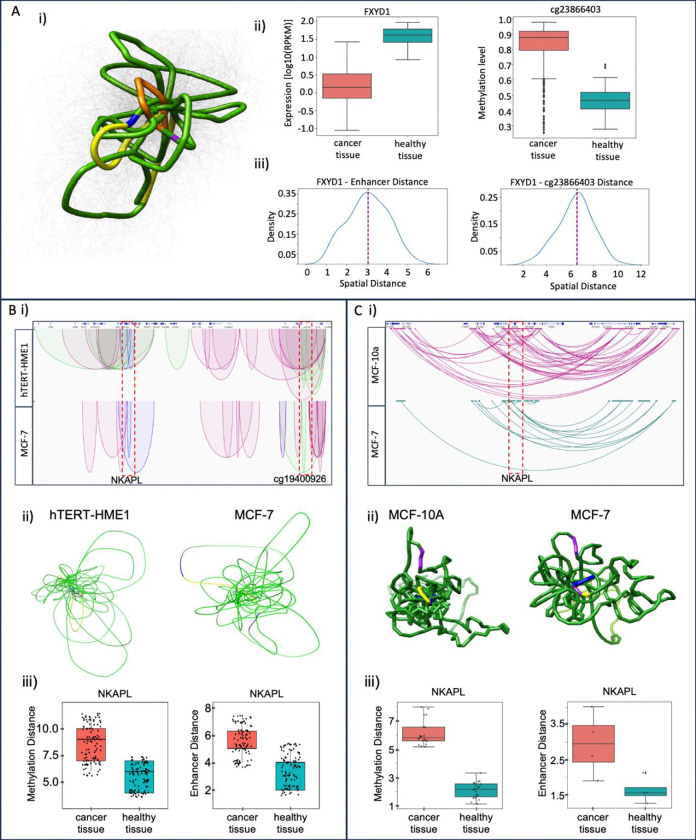
Breast cancer is the most common cancer in women and the 2nd most common cancer worldwide, yearly impacting over 2 million females and causing 650 thousand deaths. It has been widely studied, but its epigenetic variation is not entirely unveiled. We aimed to identify epigenetic mechanisms impacting the expression of breast cancer related genes to detect new potential biomarkers and therapeutic targets. We considered The Cancer Genome Atlas database with over 800 samples and several omics datasets such as mRNA, miRNA, DNA methylation, which we used to select 2701 features that were statistically significant to differ between cancer and control samples using the Monte Carlo Feature Selection and Interdependency Discovery algorithm, from an initial total of 417,486. Their biological impact on cancerogenesis was confirmed using: statistical analysis, natural language processing, linear and machine learning models as well as: transcription factors identification, drugs and 3D chromatin structure analyses. Classification of cancer vs control samples on the selected features returned high classification weighted Accuracy from 0.91 to 0.98 depending on feature-type: mRNA, miRNA, DNA methylation, and classification algorithm. In general, cancer samples showed lower expression of differentially expressed genes and increased β-values of differentially methylated sites. We identified mRNAs whose expression is well explained by miRNA expression and differentially methylated sites β-values. We recognized differentially methylated sites possibly affecting NRF1 and MXI1 transcription factors binding, causing a disturbance in NKAPL and PITX1 expression, respectively. Our 3D models showed more loosely packed chromatin in cancer. This study successfully points out numerous possible regulatory dependencies.

Keywords: MCFS-ID; MXI1; Monte Carlo Feature Selection; NKAPL; NLP; NRF1; PITX1; breast cancer; chromatin structure; differentially methylated sites; epigenetic regulation; transcription factor.


Figures

Fig 1.
Fig 1.
Number of samples with the complete data for a given dataset type. The overlap of 381 samples that contain the complete data for all three dataset types was used in the feature selection procedure.
Fig 2.
Fig 2.
A flowchart describing selection of features identified as significant in cancer prediction, including attributes that are significant within one separated type of data and significant when combining all types of data together. This procedure will be called the main MCFS-ID experiment later in the paper and features selected by the algorithm as the significant set of mRNA/miRNA genes or DNA methylation features.
Fig 3.
Fig 3.
A flowchart describing selection of miRNA genes found to be significant in prediction of mRNA gene expression levels. For each significant mRNA (selected by the main experiment described in section ”Detection of significant features using MCFS-ID algorithm”) treated as a target variable, a separate MCFS-ID experiment was performed. The same procedure was used for DNA methylation as predictors instead of miRNA expression levels.
Fig 4.
Fig 4.
Overview of mRNAs indicated as significant in distinguishing cancer from normal tissue samples (A) The volcano plot shows differences in the expression levels of 590 mRNA considered significant in the cancer/normal prediction in the feature selection set (adjusted raw p-value>0.05). (B) Enriched pathways from the Reactome pathway database for down-regulated genes. (C) Enriched pathways from the Reactome pathway database for over-expressed genes. To allow for better readability, the number of less enriched pathways in the graph was reduced with the cutoff q-value=0.001 (all terms for cutoff q-value=0.05 are available in S2 Table).
Fig 5.
Fig 5.
Characteristics of 2006 significant DNA methylation sites (DMSs). (A) Distribution of loci included in the Illumina 450K array in comparison to the distribution of DMSs. (B) DMSs β-values distribution in the tumor and normal samples with respect to the specific genomic regions. (C) DMSs assigned to hyper/medium/hypo-methylated with respect to log2 Fold Change of β-values. (D) Number of loci with hyper/medium/hypo-methylated DNA in particular types of genomic regions.
Fig 6.
Fig 6.
Distribution of cytosines across chromatin states obtained for the MCF-7 breast cancer cell line. (A) Number of DMS in individual chromatin states. (B) Illumina 450K sites assigned to individual chromatin states, representing the background distribution. (C) Differential distribution of hypo- and hyper-methylated DMS in specific chromatin states.
Fig 7.
Fig 7.
Summary of mass MCFS-ID experiments on 590 mRNA genes. (A) Distribution of the number of significant miRNA features returned across 590 experiments. (B) Distribution of the number of significant DNA methylation loci returned across 590 experiments. (C) Distribution of the Pearson correlations obtained for linear models built on significant miRNA features returned across 590 experiments (D) Distribution of the Pearson correlations obtained for linear models built on significant DNA methylations returned across 590 experiments.
Fig 8.
Fig 8.
TF motifs overlapping differentially methylated cytosines. (A) TF motifs overlapping hyper-methylated DMS. (B) TF motifs overlapping hypo-methylated DMS. In (A) and (B), the red horizontal line indicates the p-value cut-off point. (C) Hierarchical clustering of TF motifs based on their PWMs. (D) Functional analysis of genes encoding TFs whose motifs overlapped DMSs hyper-methylated in cancer (KEGG database). The list of genes related with specific terms is shown in S11 Table.
Fig 9.
Fig 9.
Target genes interactions, biological functions and graphical representation of their putative regulatory elements. (A) Visualization of interactions driven from linear models. (B) The network of gene-gene interactions created for the identified target genes visualized on A. (C) KEGG pathway analysis for 10 genes highlighted in B. (D) ID-graph for NKAPL gene.
Fig 10.
Fig 10.
Spatial Regulatory Model of chromatin – (A) (i) The most representative chromatin 3D computational model from the ensemble of 100 spatial models generated by the 3D-GNOME method for the FXYD1 gene with labeled promoter (blue), gene body (yellow) cg23866403 methylation loci (purple) and potential enhancer region (orange). (ii) The box plots show cancer and healthy samples FXYD1 expression (left) and cg23866403 loci methylation levels (right). (iii) The spatial distance distribution between the FXYD1 gene promoter and its enhancer region (left) and the cg23866403 methylation loci (right). (B) (i) Cohesin-mediated chromatin interactions around the NKAPL gene in the integrative genomics viewer for hTERT-HME1 (healthy) and MCF-7 (cancer) cell lines. Green color annotates enhancer-promoter loops, blue color promoter-promoter loops. (ii) The representative chromatin 3D model based on Cohesin ChIA-PET data for the NKAPL gene. (iii) The spatial distances between promoter-methylation (left) and promoter-enhancer (right) for cancer and healthy cell lines. (C) (i) PCHi-C interactions around the NKAPL gene in the integrative genomics viewer for MCF-10A (healthy) and MCF-7 (cancer) samples. (ii) Chromatin 3D model of the NKAPL gene in MCF-10A (left) and MCF-7 (right) cell lines. (iii) The spatial Euclidean distances between the NKAPL gene body and DMS (left); the NKAPL gene body and the enhancer (right) both for MCF-7 and MCF-10A.

Similar articles

References

    1. Sung H, Ferlay J, Siegel RL, Laversanne M, Soerjomataram I, Jemal A, et al. Global cancer statistics 2020: GLOBOCAN estimates of incidence and mortality worldwide for 36 cancers in 185 Countries. CA: a Cancer Journal for Clinicians. 2021. Feb 4;71(3):209–49. 10.3322/caac.21660 - DOI - PubMed
    1. Dumbrava EI, Meric-Bernstam F. Personalized cancer therapy—leveraging a knowledge base for clinical decision-making. Cold Spring Harb Mol Case Stud. 2018. Apr 1;4(2). 10.1101/mcs.a001578 - DOI - PMC - PubMed
    1. Chopra S, Khosla M, Vidya R. Innovations and challenges in breast cancer care: a review. Medicina. 2023. May 16;59(5):957–7. 10.3390/medicina59050957 - DOI - PMC - PubMed
    1. Bean GR, Lin CY. Breast neuroendocrine neoplasms: practical applications and continuing challenges in the era of the 5th edition of the WHO classification of breast tumours. Diagnostic Histopathology. 2021. Jan;27(4):139–47. 10.1016/j.mpdhp.2021.01.001 - DOI
    1. Cree IA, White VA, Indave BI, Lokuhetty D. Revising the WHO classification: female genital tract tumours. Histopathology. 2019. Dec 17;76(1):151–6. 10.1111/his.13977. - DOI - PubMed

Publication types

LinkOut - more resources