[Preprint]. 2024 Nov 18:2024.11.15.623837.
doi: 10.1101/2024.11.15.623837.

Single-cell epigenetic profiling reveals an interferon response-high program associated with BAP1 deficiency in kidney cancer

Affiliations

Single-cell epigenetic profiling reveals an interferon response-high program associated with BAP1 deficiency in kidney cancer

Sabrina Y Camp et al. bioRxiv. .

Abstract

Renal cell carcinoma (RCC) is characterized by recurrent somatic mutations in epigenetic regulators, which stratify patients into clinically significant subgroups with distinct prognoses and treatment responses. However, the cell type-specific epigenetic landscape of RCC-broadly and in the context of these mutations-is incompletely understood. To investigate these open questions, we integrated single nucleus ATAC sequencing data from RCC tumors across four independent cohorts. In clear cell RCC tumors, we identified four shared malignant epigenetic programs related to angiogenesis, proximal tubule-like features, interferon (IFN) signaling, and one that lacked distinct genomic regions with increased accessibility. Among the mutated epigenetic regulators, BAP1 mutation exhibited the most significant impact on chromatin accessibility in tumor cells, and the associated epigenetic changes were linked to IFN response. We identify multiple potential sources of elevated IFN signaling in these lesions, such as increased immune infiltration and increased accessibility and expression of an IFN-associated ERV, ERV3-16A3_LTR. We find that the expression of ERV3-16A3_LTR may itself be a negative prognostic biomarker in ccRCC. Our findings highlight the convergence of malignant epigenetic programs across ccRCC tumors and suggest that BAP1 loss, potentially through ERV3-16A3_LTR dysregulation, is associated with an IFN response-high epigenetic program.


Figures
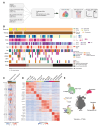
Figure 1.
Figure 1.. Multicohort snATAC-seq analysis of the epigenetics of renal cancer
A) Study overview B) Comutation plot of the clinical and genomic characteristics of the unique biopsies included in the study. Each row is a feature (clinical variable or gene) and each column corresponds to an individual biopsy. Translocation RCC sample identified via positive TFE3 FISH test. C) Heatmap of a subset of chromosome arm copy number estimates derived from CopyscAT, split by putative tumor and non-malignant cells. Displaying 10,000 cells for each identity . Histology color mapping detailed in the legend for panel B. D) Heatmap of scaled average gene activity scores across non-malignant cell types, featuring top 100 differentially accessible genes per cell type based on average log2 fold-change from logistic regression adjusting for sequencing depth (nCount_ATAC, adjusted p-value < 0.05, Bonferroni correction), with logistic regression applied to downsampled identities (1000 cells per identity) and known cell type marker genes annotated within top 100 gene sets. Legend for histology annotations from panel B. E) Visualization of UMAP dimension reduction (computed on LSI components 2 through 50) for all cells included in the study. Broad cell types are annotated, and cells depicted in light grey were excluded from the analyses.
Figure 2.
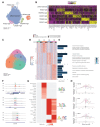
Figure 2.. Discovery and characterization of RCC epigenetic states
A) Visualization of UMAP dimension reduction (computed on LSI components 2 through 50) of putative tumor cells from all samples, colored by malignant cell state. ccRCC-balanced denotes clusters predominantly from ccRCC lesions. Other clusters shown were enriched for specific samples/subtypes and annotated with a gene showing high accessibility in that cluster compared to all other clusters. B) Heatmap of gene activity scores across malignant cell states. Top 10 (average log2FC) differentially accessible genes for each state, identified by logistic regression (LR) adjusting for sequencing depth (nCount_ATAC, adjusted p-value < 0.05, Bonferroni correction). LR on downsampled data (1000 cells/identity), displaying 100 cells/identity. C) Visualization of UMAP dimension reduction (computed on LSI components 2 through 20) of the four largest shared clusters from ccRCC-only cells, sub-clustered from ccRCC-balanced state. Excludes highly sample-specific clusters. D) Heatmap of peak accessibility across ccRCC clusters. Columns represent scaled average peak accessibility per cells from a given sample in a particular cluster (e.g., one column is cells from sample 1 in cluster 1). Includes all significant peaks from LR (Bonferroni correction, adjusted p-value < 0.05), with columns ordered by cluster, then cohort. E) Manually selected pathways enriched in significant peaks per cluster, as determined by GREAT (Binomial test, FDR q-value < 0.05). GeneFoldEnrich indicates fold enrichment of the number of genes in the test set with the set of genes in the given pathway. Pathways selected from GO biological process, disease ontology, MSigDB pathway ontologies. F) Coverage plots for selected peak-gene associations identified by GREAT that were included in significant pathways shown in Figure 2E. Coverage plots split and colored by ccRCC cluster. G) Heatmap of -log10 q-values (hypergeometric test, FDR q-value < 0.05) for TF motif enrichment in significant peak sets. Cutoff of −log10 q-value at 10. Top 10 motifs per cluster shown; position weight matrices for HNF4A, FOS, RELA to the right. H) Transcription factor footprinting plots shown for HNF4A, FOS, and RELA. Footprinting tracks split and colored by ccRCC cluster
Figure 3.
Figure 3.. BAP1 pLOF mutation associated epigenetic changes in advanced ccRCC
A) Boxplot of median ccRCC C3 peak signature score per unique biopsy, split by BAP1 mutation status. BAP1 wild type excludes pLOF and other non-silent mutations. Analysis limited to cells from ccRCC tumor states (C0,C1,C2,C3). Q-value displayed (two-sided Wilcoxen, FDR correction). B) Heatmap of scaled peak accessibility scores across BAP1 mutation status. Analysis limited to cells from ccRCC tumor states (C0,C1,C2,C3) and from patients with advanced disease. Columns represent scaled average peak accessibility per biopsy, ordered by BAP1 mutation status, disease stage, then cohort. Displaying all significant peaks from LR (Bonferroni correction, adjusted p-value < 0.05, log2 fold-change > abs(1)). Number of peaks relative to size of heatmap not to scale. C) Transcription factor motif enrichment in BAP1 pLOF mutation-associated peaks identified by hypergeometric test. Annotating all significant motifs (FDR correction, q-value < 0.05), with some excluded due to label overlap. Point color indicates fold enrichment of motif presence in input peak set versus reference set. Grey points indicate q-value > 0.05. All points ordered from smallest to largest q-value left to right. D) Top 20 GO biological process terms enriched in BAP1 pLOF significant peak set (Binomial test, FDR correction, q-value < 0.05). Dot size corresponds to GeneFoldEnrich, indicating fold enrichment of genes in test set/pathway as determined by GREAT. E) Boxplots comparing broad immune cell type proportions between biopsies with pLOF BAP1 mutation and BAP1 wild type, restricted to advanced stage disease patients. Points overlaying boxplots show per biopsy cell type proportions. Q-value for monocyte proportion comparison shown (two-sided Wilcoxen, FDR correction); other cell type comparisons not significant.
Figure 4.
Figure 4.. Identifying IFN-associated ERVs and dissecting their relationship to BAP1 mutation status in ccRCC tumor cells
A) Scatter plots of RNA-derived IFN1 signaling (CytoSig) versus ATAC-derived IFN1 signaling (signature scoring for peaks associated with CytoSig IFN1 score, Methods) for all malignant cells from multiome ATAC-RNA samples (top), and IFNG comparison (bottom). Pearson correlation coefficient and regression line (blue) included; point color indicates sample ID. B) Transcription factor motifs enriched in IFN1-associated (top) and IFNG-associated (bottom) peak sets from hypergeometric test. Top 10 motifs by q-value (FDR correction) annotated; point color shows fold enrichment; grey points indicate q-value > 0.05, ordered by q-value. C) Top five GO biological process (GO BP) and MSigDB pathway annotations enriched in IFN1-associated (top) and IFNG-associated (bottom) peak sets by q-value (Binomial test, FDR correction, q-value < 0.05). Dot size corresponds to GeneFoldEnrich from GREAT. D) Left, visualization of UMAP dimension reduction (computed on PC components 1 through 15) derived from transposable element (TE) accessibility counts of cells from ccRCC tumor biopsies that had TE quantification and passed peak-based QC. Cells colored by broad lineage designation determined from peak-based analysis. Right, boxplot comparing median HERVE.int accessibility counts in a given biopsy’s putative tumor cells to non-tumor cells. Size of dot corresponds to the number of tumor cells or non-tumor cells captured in each biopsy. Nominal p-value determined from one-sided Wilcoxen test. E) Scatter plot of mixed effects model coefficients for individual ERVs from the epigenetic IFN1 signaling outcome model (x-axis) and epigenetic IFNG signaling outcome model (y-axis), showing ERVs with estimates > 0. Point color denotes significance and comparison (FDR correction); annotated ERVs significantly associated with both IFN1 and IFNG peak set signature scores (q-value < 0.05, coefficient > 0). F) Boxplot comparing the median accessibility of ERV3-16A3_LTR in ccRCC tumor cells with pLOF BAP1 mutations, BAP1 wild-type cells, and immune cells from biopsies with known BAP1 mutation status. Immune cells are defined as cells from the myeloid or lymphoid lineage. Only stage 3 and 4 biopsies are included. Dot size represents the number of cells per biopsy. Q-value shown for BAP1 mt vs. BAP1 wt comparison (one-sided Wilcoxon test, FDR correction) and nominal p-value (one-sided Wilcoxen test) shown in parentheses; P-values (two-sided Wilcoxon test) shown for BAP1 mt vs immune and BAP1 wt vs immune comparison
Figure 5.
Figure 5.. Evaluating relationship between ERV3-16A3_LTR expression, BAP1 mutation status, and clinical outcomes in bulk ccRCC RNA-seq cohorts
A) Forest plot showing beta coefficients from a linear regression model for expression of ERV3-16A3_LTR in TCGA KIRC cohort B) Forest plot showing hazard ratios from a Cox proportional hazards model for overall survival in TCGA KIRC cohort C) Forest plot showing hazard ratios from a Cox proportional hazards model for progression-free survival in ICB-containing treatment arm of JAVELIN Renal 101 cohort

References

    1. Turajlic S. et al. Tracking Cancer Evolution Reveals Constrained Routes to Metastases: TRACERx Renal. Cell 173, 581–594.e12 (2018). - PMC - PubMed
    1. Guo G. et al. Frequent mutations of genes encoding ubiquitin-mediated proteolysis pathway components in clear cell renal cell carcinoma. Nat. Genet. 44, 17–19 (2011). - PubMed
    1. Dalgliesh G. L. et al. Systematic sequencing of renal carcinoma reveals inactivation of histone modifying genes. Nature 463, 360–363 (2010). - PMC - PubMed
    1. Nargund A. M. et al. The SWI/SNF Protein PBRM1 Restrains VHL-Loss-Driven Clear Cell Renal Cell Carcinoma. Cell Rep. 18, 2893–2906 (2017). - PMC - PubMed
    1. Miao D. et al. Genomic correlates of response to immune checkpoint therapies in clear cell renal cell carcinoma. Science 359, 801–806 (2018). - PMC - PubMed

Publication types

LinkOut - more resources