[Preprint]. 2024 Nov 23:2024.11.22.624409.
doi: 10.1101/2024.11.22.624409.

Shroom3-Rock interaction and profibrotic function: Resolving mechanism of an intronic CKD risk allele

Affiliations

Shroom3-Rock interaction and profibrotic function: Resolving mechanism of an intronic CKD risk allele

Anand Reghuvaran et al. bioRxiv. .

Abstract

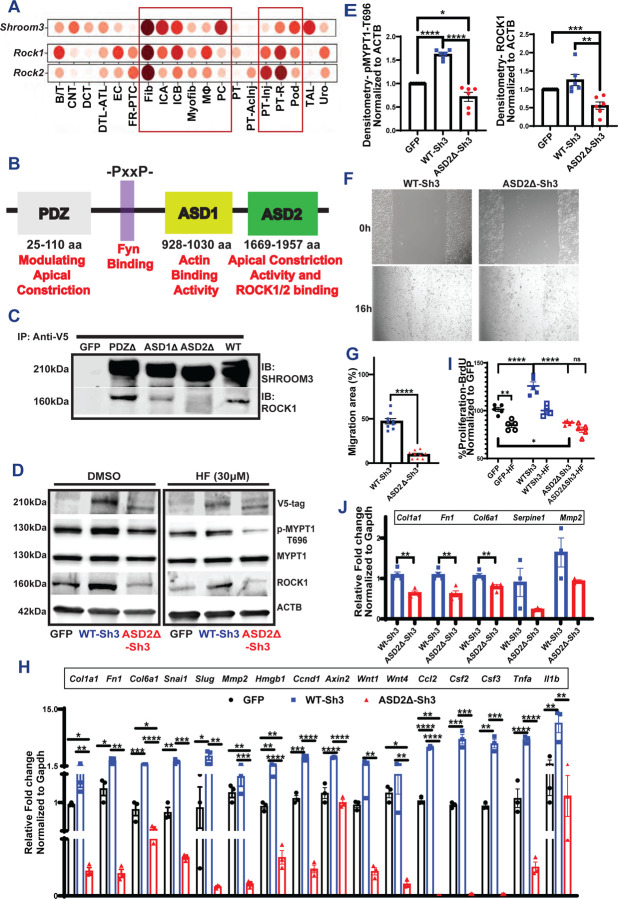
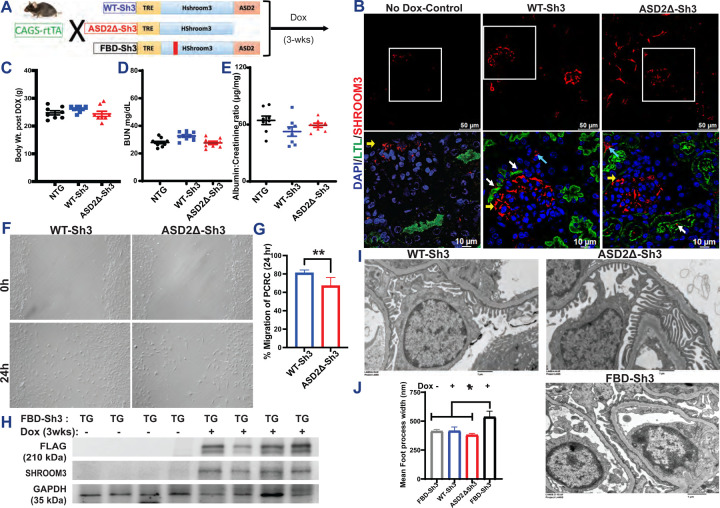
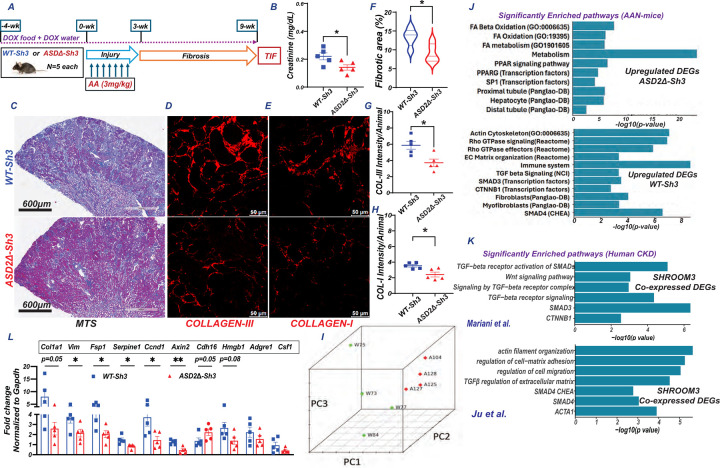
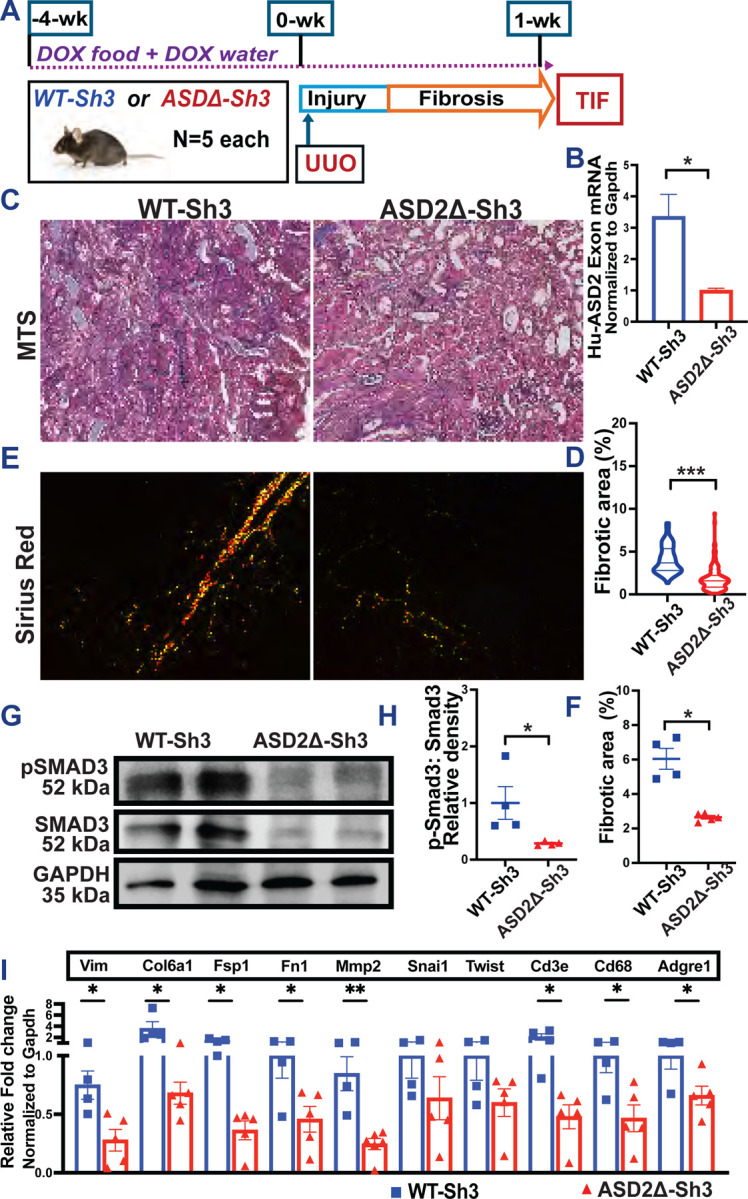
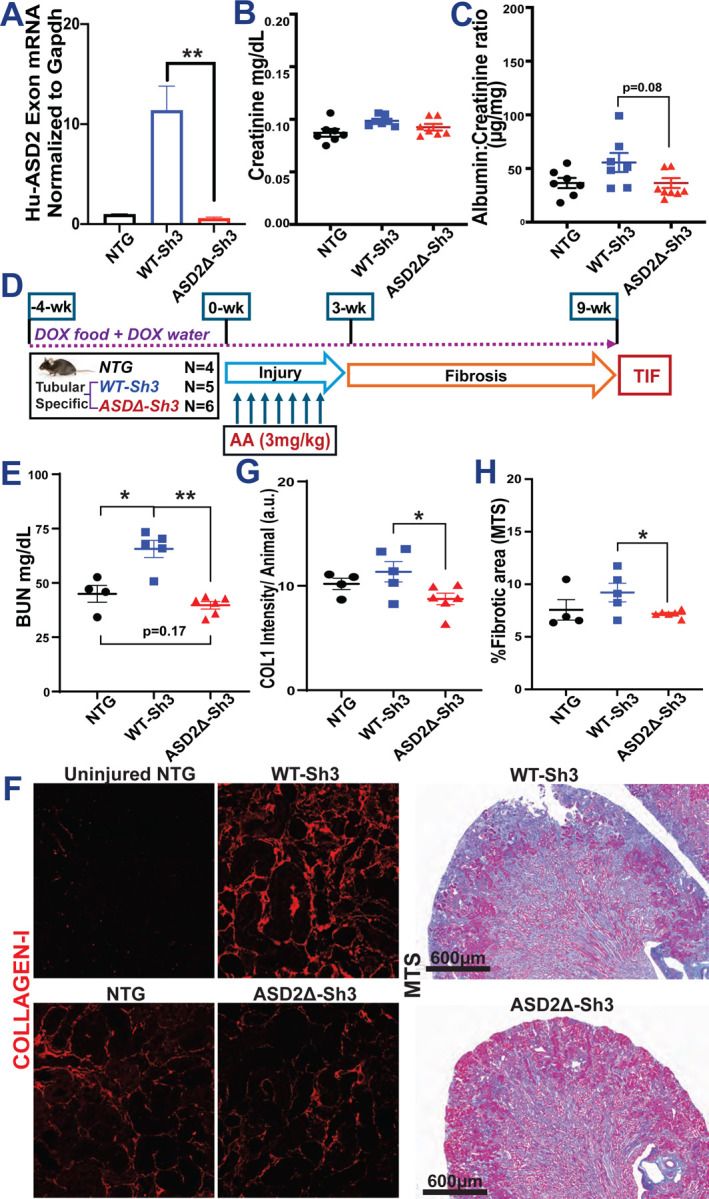
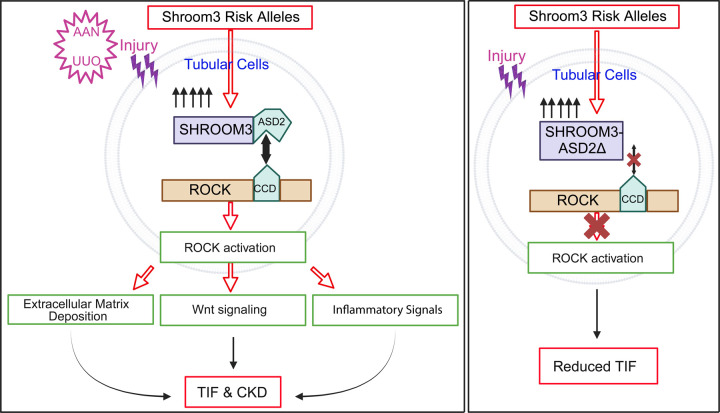
Common intronic enhancer SNPs in Shroom3 associate with CKD in GWAS, although there is paucity of detailed mechanism. Previously, we reported a role for Shroom3 in mediating crosstalk between TGFβ1- & Wnt/Ctnnb1 pathways promoting renal fibrosis (TIF). However, beneficial roles for Shroom3 in proteinuria have also been reported suggesting pleiotropic effects. Here we focused on identifying the specific profibrotic Shroom3 motif. Given known therapeutic roles for Rho-kinase inhibitors in experimental CKD, and the established interaction between Shroom3 and Rock via its ASD2 domain, we hypothesized that Shroom3-mediated ROCK activation played a crucial role in its profibrotic function in high expressors. To test this hypothesis, we developed transgenic mice and cell lines that inducibly overexpressed wild-type- (WT-Sh3) or ASD2-domain deletion- Shroom3 (ASD2Δ-Sh3). Prior scRNAseq data showed that during TIF, Shroom3 and Rock co-expression occurred in injured tubular cells and fibroblasts, highlighting cell-types where this mechanism could be involved. Using HEK293T cells, we first confirmed absent ROCK binding and inhibited TGFβ1-signaling with ASD2Δ-Sh3-overexpression vs WT-Sh3. In mIMCD cells, ASD2Δ-Sh3 overexpression, reduced Rock activation (phospho-MYPT1), pro-fibrotic and pro-inflammatory transcripts vs WT-Sh3. Fibroblast proliferation (3T3) was also reduced with ASD2Δ-Sh3. In vivo, we studied ureteric obstruction (UUO) and Aristolochic nephropathy (AAN) as TIF models. In AAN, inducible global-, or Pan-tubular specific-, WTSh3-overexpression showed increased azotemia, and TIF vs ASD2Δ-Sh3 mice. WT-Sh3 mice consistently showed significant enrichment of Rho-GTPase, TGFβ1- and Wnt/CtnnB1- signaling in kidney transcriptome, paralleling Shroom3-coexpressed genes in tubulo-interstitial transcriptomes from human CKD. In UUO, again WT-Sh3 mice recapitulated increased fibrosis vs ASD2Δ-Sh3. Importantly, ASD2Δ-Sh3 did not develop albuminuria vs WT-Sh3, while mutating a disparate Fyn-binding Shroom3 motif induced albuminuria in mice, suggesting motif-specific roles for Shroom3 in the kidney. Hence, our data show a critical role for the Rock-binding, ASD2-domain in mediating TIF in milieu of Shroom3 excess, with relevance to human CKD.


Figures

Figure 1:
Figure 1:
(A) Dot plot representing Shroom3, Rock1, Rock2 in multiple cell types identified in Injured murine kidneys (https://humphreyslab.com/SingleCell/) (B) The conserved domains of Shroom3 are shown (PDZ, ASD1, ASD2 domains and the Fyn-binding site). (C) Representative immunoblots of SHROOM3 and ROCK1 from proteins immunoprecipitated from HEK293T cells overexpressing PDZ, ASD1 and ASD2 using V5 beads. (D) Representative immunoblots of lysates from Dmso/HF-treated mIMCD cells overexpressing GFP, WT-Sh3 and ASD2Δ-Sh3 for V5 (Shroom3), phospho-MYPT, total MYPT, ROCK1 and βACTIN. (E) Dot plots of relative quantification of phospho-MYPT and ROCK1. (F) Phase contrast micrographs of wound closure in mIMCD cells expressing WT-Sh3/ASD2Δ-Sh3 and the (G) Bar graph representing the percent migrated area. (H) Bar graph representing the relative mRNA expression of markers of fibrosis, Wnt signals and pro-inflammatory chemokines in mIMCD cells (WT-Sh3- vs ASD2Δ-Sh3). (I) Dot plot showing the difference in cell proliferation in the 3T3 fibroblasts overexpressing WT-Sh3- vs ASD2Δ-Sh3/GFP-control with and without Fasudil (HF). Data is depicted as the BrdU incorporation by cells as percent of GFP-control. (J) Bar graph representing the relative mRNA expression of markers of fibrosis and EMT in 3T3 cells (WT-Sh3- vs ASD2Δ-Sh3). [Line and whiskers indicate mean ± SEM; Unpaired T-test *p < 0.05, **p < 0.01, ***p < 0.001, ****p < 0.0001].
Figure 2:
Figure 2:
(A) Schema of generation of the Tetracycline-inducible global overexpression mice for WT-Sh3, ASD2Δ-Sh3 and FBD-Sh3. (B) Validation of the overexpression histologically by immunostaining for SHROOM3 (Red) in upper panel; Scale bar: 50 mM. The insets (lower panel) show co-staining with Lotus tetragonolobus lectin [LTL], Green and the white, yellow and blue arrows marking the tissue localization; Scale bar: 10 mM. Dot plots of baseline measurements of (C) Body weights (D) blood urea nitrogen (BUN) and (E) Albumin to creatinine ratio post Doxycycline induced overexpression in Non-transgenic (NTG)/WT-Sh3/ASD2Δ-Sh3 mice (F) Phase contrast micrographs of wound closure in Primary culture renal cells (PCRCs) isolated from WT-Sh3/ASD2Δ-Sh3 transgenic (TG) mice and the (G) Bar graph representing the percent migrated area (12 hpf lengths/well & 2 wells/line). (H) Representative immunoblots of whole kidney lysates from FBD-Sh3 mice probed for SHROOM3 and FLAG confirming overexpression on DOX induction. (I) Representative electron micrographs of glomeruli of WT-Sh3/ASD2Δ-Sh3 vs FBD-Sh3 TG mice revealing the foot processes effacement in FBD-Sh3. (J) Bar graph depicting the mean foot process width [Line and whiskers indicate mean ± SEM; Unpaired T-test *p < 0.05, **p < 0.01].
Figure 3:
Figure 3:
(A) Schema of AAN injury/TIF in CAGS-rTTA/WT-Sh3 or -ASD2Δ-Sh3 [n=5 each] (B) Dot plot of serum creatinine levels in AAN mice at 9-wks. Representative images of (C) slide-wide Masson’s Trichrome staining (MTS-4x) and (D) Collagen III and (E) Collagen I immunofluorescence to evaluate fibrosis in AAI-injured kidney. Scale bar: MTS- 600 μm; IF: 50 μm. Dot plots denoting the quantification of (F) fibrotic area (10 hpf per animal) and mean fluorescence intensities (12 hpf per animal) of (G) Collagen III and (H) Collagen I. (I-K) Bulk transcriptome evaluation by RNAseq was performed at 9-wks CAGS-rtTA- WT-Sh3 or -ASD2Δ-Sh3 mice (n=4 each). (I) Principal component analyses plot shows clustering between conditions Bar graphs show significantly selected enriched pathways from these analyses in (J) DEGs upregulated in ASD2Δ-Sh3 (upper panel) or WT-Sh3 (lower), while in (K) bar graphs show analogous pathways obtained from genes co-expressed with SHROOM3 in 2 human CKD datasets. (L) Bar graph representing the relative mRNA expression (qPCR) of fibrotic/injury, inflammatory and tubular markers between transgenic lines. [Line and whiskers indicate mean ± SEM; Unpaired T-test*p < 0.05, **p < 0.01; DEGs=Differentially expressed genes].
Figure 4:
Figure 4:
(A)TIF was induced by UUO model in CAGS-rtTA/WT-Sh3 or -ASD2Δ-Sh3 [n=4 vs 5]. (B) Bar graph representing the relative mRNA expression using ASD2-domain specific primers. (C) Representative images of (C) Masson’s Trichrome staining (MTS-20X) and (E) Picrosirius red (plane polarized light 20X) to evaluate TIF in UUO kidneys. (D, F) Dot plots quantify MTS and Sirius red among all mice, respectively (>10 hpf per animal). (G) Representative immunoblots of whole kidney lysates from UUO kidneys of WT-Sh3 or -ASD2Δ-Sh3 mice probed for P-SMAD3, SMAD3, GAPDH, and (H) dot plots show respective quantification of P-SMAD3:SMAD3 ratio by densitometry. (I) Bar graph representing the relative mRNA expression (qPCR) of fibrotic/injury, inflammatory and tubular markers between UUO kidneys between transgenic lines. [Line and whiskers indicate mean ± SEM; Unpaired T-Test *p < 0.05, **p < 0.01; ***p < 0.001; DEGs=Differentially expressed genes].
Figure 5:
Figure 5:
(A) Bar graph representing the relative mRNA expression by qPCR using ASD2-domain specific primers in tubular-specific (Pax8-rtTA) WT-Sh3 overexpression mice vs. Pax8-rtTA-ASD2Δ-Sh3 mice and non-transgenic controls. Dot plots of baseline levels of (B) serum creatinine and (C) urine albumin to creatinine ratios in DOX-treated Pax8-rtTA mice and non-transgenic mice. (D) Schema of generation of Aristolochic acid nephropathy (AAN) in tubular-specific overexpression WT-Sh3/ASD2Δ-Sh3 mice entailing injury followed by recovery phase with fibrosis. (E) Dot plot showing the BUN levels in AAI-injured Pax8-Shroom3 mutant mice at 9 wk. (F) Representative fluoromicrographs (20X) of Collagen I immunostaining and slide-wide photomicrographs of Masson’s Trichrome staining (MTS) to evaluate fibrosis in AAI-injured kidney. Dot plots denoting the (G) mean fluorescence intensities (12 hpf per animal) of Collagen I immunostained sections and (H) quantification of blue-stained area (10 hpf per animal) in Trichrome-stained sections. [Line and whiskers indicate mean ± SEM; Unpaired T-test*p < 0.05, **p < 0.01]
Figure 6:
Figure 6:. Summary Schematic-
WT-Sh3 overexpressing mice mimic the Shroom3 excess in the kidneys of humans with the Shroom3 risk alleles which facilitates SHROOM3-ROCK1 and/or ROCK2 interaction in specific cell types in vivo. When kidney injury is induced (predominantly tubular injury) by either AAN or UUO the augmented ROCK1/2 activation within iPTs leads to increased TIF after injury attributable to increased Wnt/Ctnnb1 and TGFβ1 signals and downstream expression of pro-fibrotic markers, pro-inflammatory cytokines and chemokines (promoting fibro-inflammation). Together, these promote TIF. This is a mechanism that underlies faster progression to CKD in AKI patients with the Shroom3 risk alleles. Meanwhile, overexpressing ASD2Δ-Sh3 in the same cells in vivo abolishes ROCK1/2 interaction and reduces activation and reduced post-injury TIF in kidneys of ASD2Δ-Sh3 mice. Also, the data indicates a dominant negative effect of ASD2Δ-Sh3 overexpression over the endogenous Shroom3 activity. Our findings indicate the therapeutic potential of cell-specific inhibition of SHROOM3-ROCK1 and/or ROCK2 interaction for TIF and CKD progression in humans. (iPTs -injured proximal tubular cells) Created with BioRender.com

References

    1. Kottgen A, Glazer NL, Dehghan A, Hwang SJ, Katz R, Li M, et al. Multiple loci associated with indices of renal function and chronic kidney disease. Nature genetics. 2009;41(6):712–7. - PMC - PubMed
    1. Boger CA, Gorski M, Li M, Hoffmann MM, Huang C, Yang Q, et al. Association of eGFR-Related Loci Identified by GWAS with Incident CKD and ESRD. PLoS genetics. 2011;7(9):e1002292. - PMC - PubMed
    1. Trudu M, Janas S, Lanzani C, Debaix H, Schaeffer C, Ikehata M, et al. Common noncoding UMOD gene variants induce salt-sensitive hypertension and kidney damage by increasing uromodulin expression. Nature medicine. 2013;19(12):1655–60. - PMC - PubMed
    1. Zhao M, Wang L, Wang M, Zhou S, Lu Y, Cui H, et al. Targeting fibrosis, mechanisms and cilinical trials. Signal Transduct Target Ther. 2022;7(1):206. - PMC - PubMed
    1. Magee JC, Barr ML, Basadonna GP, Johnson MR, Mahadevan S, McBride MA, et al. Repeat organ transplantation in the United States, 1996–2005. American journal of transplantation : official journal of the American Society of Transplantation and the American Society of Transplant Surgeons. 2007;7(5 Pt 2):1424–33. - PubMed

Publication types

LinkOut - more resources