[Preprint]. 2024 Nov 11:2024.11.11.623001.
doi: 10.1101/2024.11.11.623001.

Ethanolamine-induced assembly of microcompartments is required for Fusobacterium nucleatum virulence

Affiliations

Ethanolamine-induced assembly of microcompartments is required for Fusobacterium nucleatum virulence

Dana S Franklin et al. bioRxiv. .

Update in

Abstract

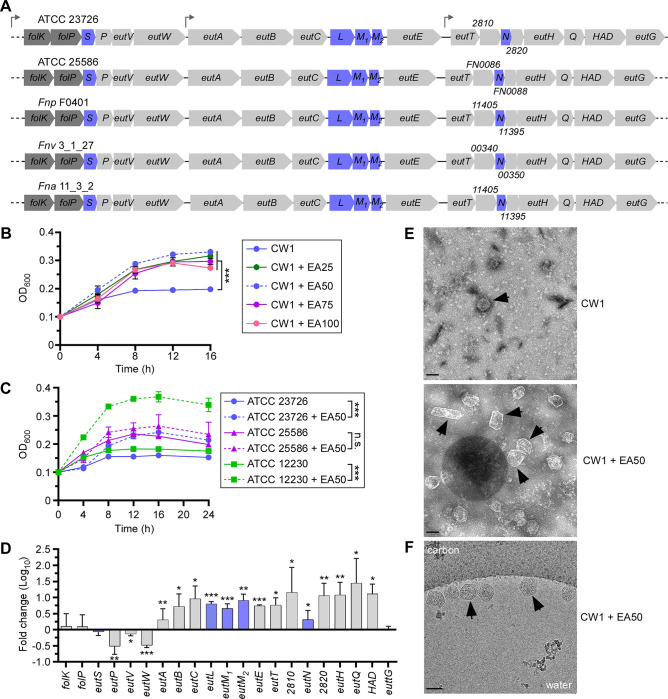
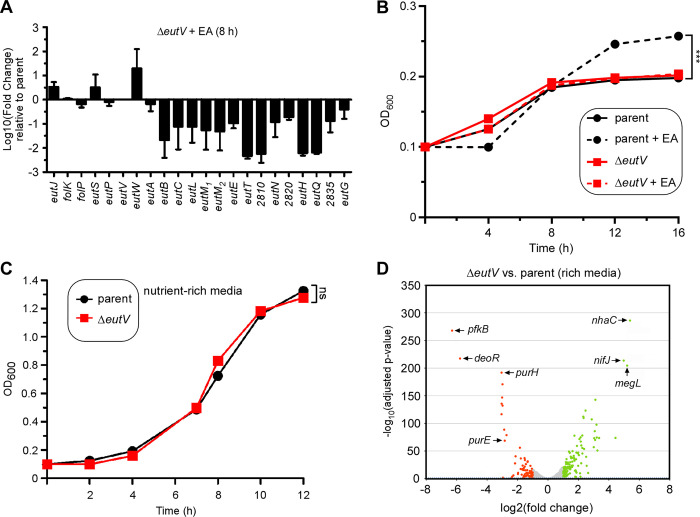
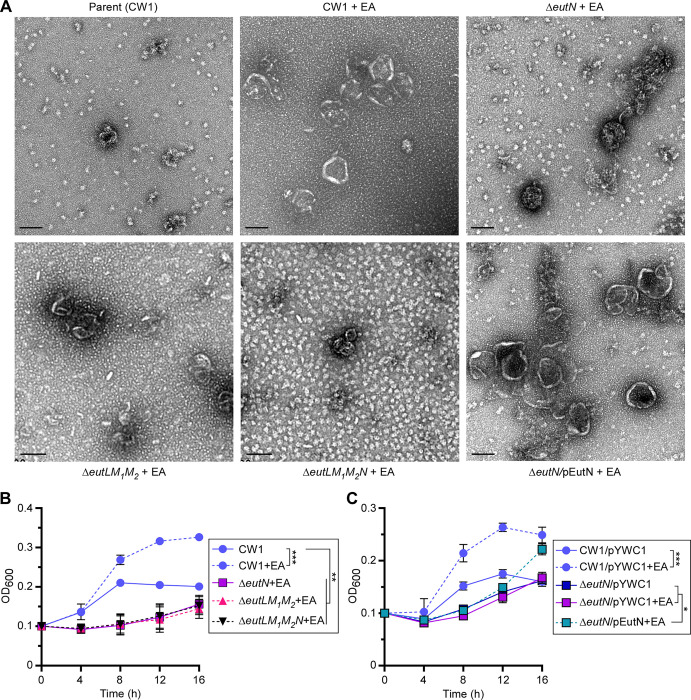
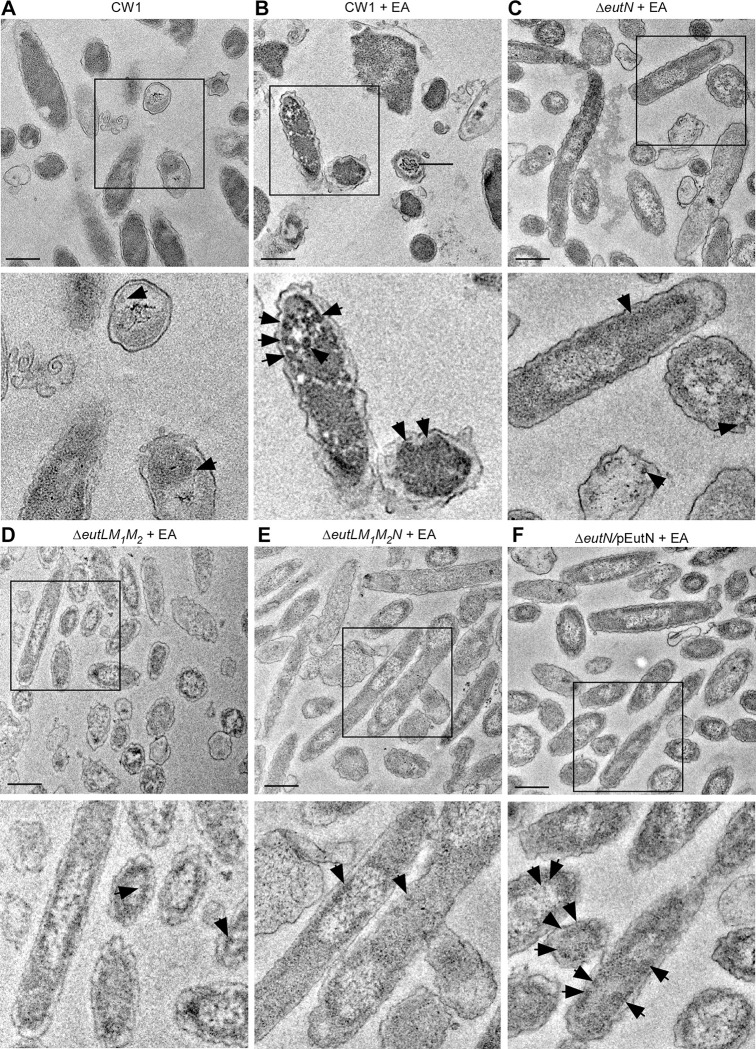
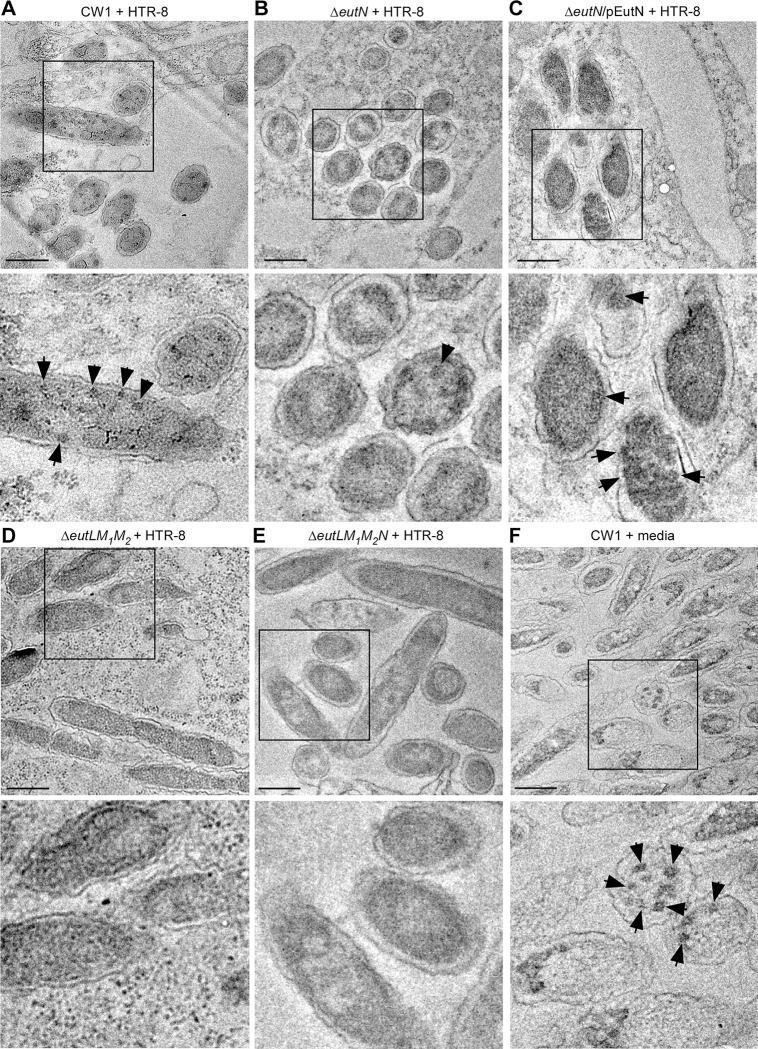
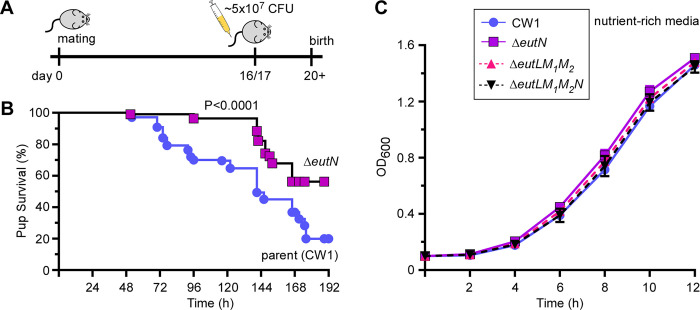
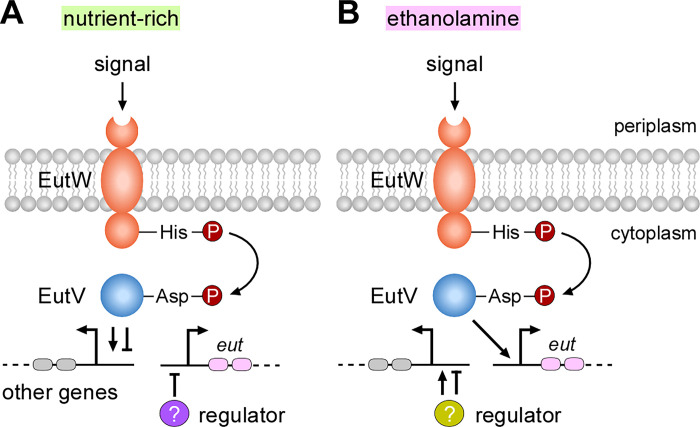
Many bacteria metabolize ethanolamine as a nutrient source through cytoplasmic organelles named bacterial microcompartments (BMCs). Here we investigated the molecular assembly, regulation, and function of BMCs in Fusobacterium nucleatum - a Gram-negative oral pathobiont that is associated with adverse pregnancy outcomes. The F. nucleatum genome harbors a conserved ethanolamine utilization (eut) locus with 21 genes that encode several putative BMC shell proteins and a two-component signal transduction system (TCS), in addition to the enzymes for ethanolamine transport and catabolism. We show that the expression of most of these genes as well as BMC formation is highly increased in wild type fusobacteria when cultured in the presence of ethanolamine as a nutrient source. Deletion of the response regulator EutV eliminated this induction of eut mRNAs and BMCs, thus demonstrating that BMC formation is transcriptionally regulated by the TCS EutV-EutW in response to ethanolamine. Mass spectrometry of isolated BMCs unveiled the identity of the constituent proteins EutL, EutM1, EutM2, and EutN. Consistent with the role of these proteins in BMC assembly and metabolism, deletion of eutN, eutL/eutM 1 /eutM 2 , or eutL/eutM 1 /eutM 2 /eutN not only affected BMC formation, but also ethanolamine utilization, causing cell growth defects with ethanolamine as nutrient. BMCs also assembled in fusobacteria cultured with placental cells or the culture media, a process that is dependent on the BMC shell proteins. Significantly, we show that the eutN mutant is defective in inducing preterm birth in a mouse model. Together, these results establish that BMC-mediated metabolism of ethanolamine is critical for fusobacterial virulence.

Keywords: Fusobacterium nucleatum; bacterial microcompartment; electron microscopy; ethanolamine utilization; preterm birth.


Conflict of interest statement

DECLARATION OF INTERESTS The authors declare no competing interests

Figures

Figure 1:
Figure 1:. The eut locus of F. nucleatum and cellular response to ethanolamine.
(A) Shown are the eut loci in F. nucleatum strains ATCC 23726 and 25586, with genes coding for presumptive BMC shell proteins highlighted in blue. (B) Cells of CW1 (derivative of ATCC 23726) were grown at 37°C in minimal media supplemented with various concentrations of EA (0, 25, 50, 75, 100 mM). Cell growth was monitored by optical density at 600 nm (OD600). Error bars indicate means and standard deviations of three biological replicates; ***, P<0.001. (C) Cells of indicated strains were grown at 37°C in minimal media supplemented with 50 mM of EA, and growth was monitored by OD600. Error bars indicate means and standard deviations of three biological replicates; ***, P<0.001; n.s., not significant. (D) CW1 cells were grown at 37°C in minimal media supplemented with 50 mM of EA for 8 h and harvested for total RNA extraction. Expression of indicated genes was determined by qRT-PCR, with 16S RNA as control. Error bars indicate means and standard deviations of three biological replicates; *, P<0.05; **, P<0.01; ***, P<0.001. (E) BMCs of the parent strain (CW1) grown in conditions described in B in the absence or present of 50 mM EA were isolated and analyzed by electron microscopy; scale bars of 100 nm. (F) Aliquots of BMCs isolated in E were analyzed by cryo-electron microscopy at the nominal magnification of 22,000 x, showing BMCs clustered along the edge of a vitreous ice hole within the holey carbon grid; scale bars of 100 nm. Black arrows in panels E and F mark representative BMC structures.
Figure 2:
Figure 2:. Gene expression modulated by the response regulator EutV.
(A) Total RNA of the parent and eutV mutant strains grown at 37°C in minimal media supplemented with 50 mM of EA for 8 h was isolated for gene expression analysis by qRT-PCR. Error bars indicate means and standard deviations of three biological replicates. (B) Growth of indicated strains in minimal media supplemented with 50 mM of EA or without at 37°C was monitored by OD600. Error bars indicate means and standard deviations of three biological replicates; ***, P<0.001. (C) Total RNA of the parent and eutV mutant strains grown in rich media at 37°C to mid-log phase was isolated for RNA-seq analysis as previously described (25). The log2 (fold change) (LFC) was plotted against the statistical significance (−log10 of the adjusted p-value). All genes above a LFC of +1.0 and below 1.0 are shown in green and red, respectively. An insert shows a detailed portion of the volcano plot for a better presentation of the position of the adjusted p-value of 0.05 (dashed blue line). Some of the highly expressed genes are marked.
Figure 3:
Figure 3:. Genetic determinants of BMC formation required for selective growth.
(A) BMCs of cells of the parent and indicated mutant strains grown in conditions described in 1E were isolated and analyzed by electron microscopy; scale bars of 100 nm. (B-C) Cell growth of indicated strains were monitored by OD600. Error bars indicate means and standard deviations of three biological replicates; *, P<0.05; **, P<0.01; ***, P<0.001.
Figure 4:
Figure 4:. BMC formation analyzed by thin-section electron microscopy.
(A-F) Cells of the parent and indicated mutant strains grown in conditions described in 1E were harvested for thin-section electron microscopy; scale bars of 200 nm. Enlargement of boxed areas is shown in below panels. Black arrows mark representative BMC structures.
Figure 5:
Figure 5:. BMC formation in placental cells.
(A-F) HTR-8/SVneo cells seeded at 3 × 10⁶ cells/ml were infected with F. nucleatum CW1 at the multiplicity of infection (MOI) of 450 for 4.5 h then embedded into resin before sectioning; scale bars of 200 nm. Black arrows in all images mark BMC structures. Images are representative of observed phenotypes.
Figure 6:
Figure 6:. Virulence attenuation of the eutN mutant.
(A-B) A group of 5 pregnant mice was infected with ~5 × 10⁷ CFU of the parent or ΔeutN strain via the tail vein on day 16 or 17 of gestation, and pup survival was recorded. This experimented was repeated independently 3x. The statistical differences were analyzed by Mantel-Cox (*** P<0.001). (C) Cell growth of indicated strains in rich media were monitored by OD600.
Figure 7:
Figure 7:. A working model of gene expression regulated by the two-component transduction system EutVW in F. nucleatum.
(A) In nutrient-rich conditions, a specific signal(s) is recognized by the sensor kinase EutW, leading to autophosphorylation at a conserved histidine residue. The phosphate is transferred to a conserved aspartate residue of the response regulator EutV. Phosphorylation of EutV triggers the transcriptional regulation response of EutV, resulting in the activation or repression of various genes. It is unclear if EutV also regulates expression of a regulator that represses expression of eut genes in these conditions. (B) In the presence of environmental ethanolamine, which may act as a signal that activates EutW, the response regulator EutV becomes activated, leading to the upregulation of eut genes. In this condition, it is unclear if EutV and/or other regulators controls expression of other genes.

References

    1. Kaval KG, Garsin DA. 2018. Ethanolamine Utilization in Bacteria. mBio 9. 10.1128/mBio.00066-18. - DOI - PMC - PubMed
    1. Luzader DH, Kendall MM. 2016. Commensal ‘trail of bread crumbs’ provide pathogens with a map to the intestinal landscape. Curr Opin Microbiol 29:68–73. 10.1016/j.mib.2015.11.005. - DOI - PMC - PubMed
    1. Tsoy O, Ravcheev D, Mushegian A. 2009. Comparative genomics of ethanolamine utilization. J Bacteriol 191:7157–64. 10.1128/JB.00838-09. - DOI - PMC - PubMed
    1. Bobik TA, Lehman BP, Yeates TO. 2015. Bacterial microcompartments: widespread prokaryotic organelles for isolation and optimization of metabolic pathways. Mol Microbiol 98:193–207. 10.1111/mmi.13117. - DOI - PMC - PubMed
    1. Ravcheev DA, Moussu L, Smajic S, Thiele I. 2019. Comparative Genomic Analysis Reveals Novel Microcompartment-Associated Metabolic Pathways in the Human Gut Microbiome. Front Genet 10:636. 10.3389/fgene.2019.00636. - DOI - PMC - PubMed

Publication types