[Preprint]. 2024 Nov 19:2024.11.19.624253.
doi: 10.1101/2024.11.19.624253.

Molecular Polymorphism of tau aggregates in Pick's disease

Affiliations

Molecular Polymorphism of tau aggregates in Pick's disease

Jiliang Liu et al. bioRxiv. .

Update in

Abstract

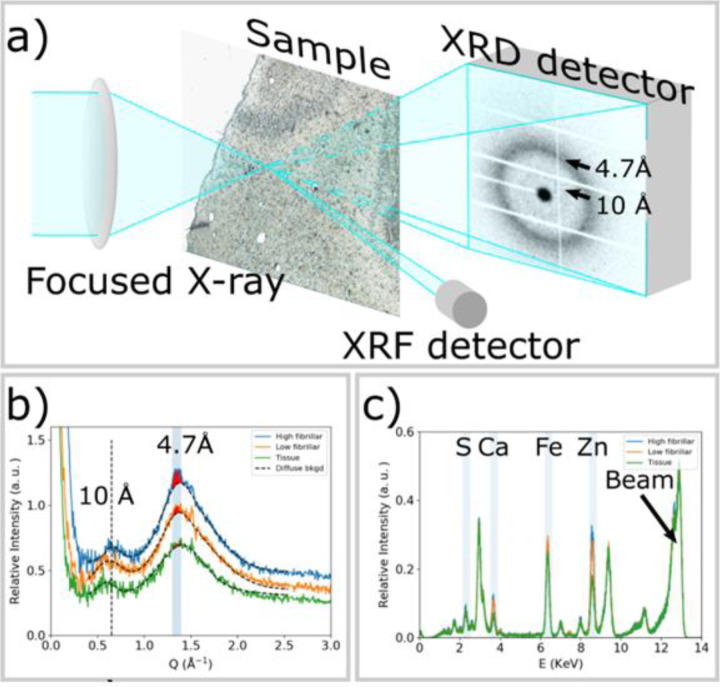
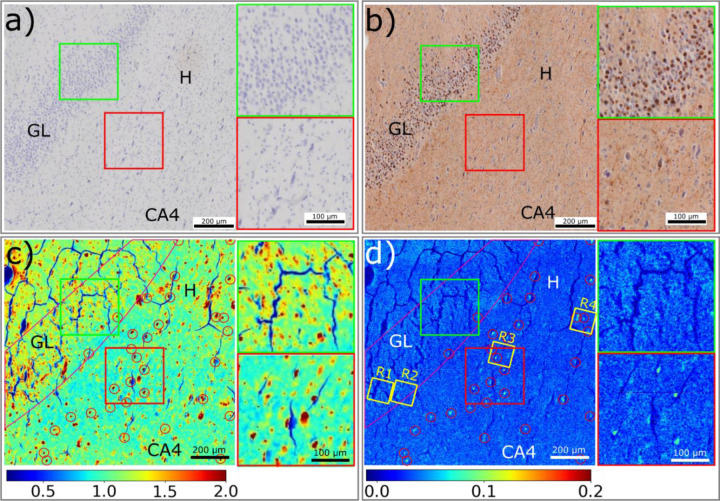
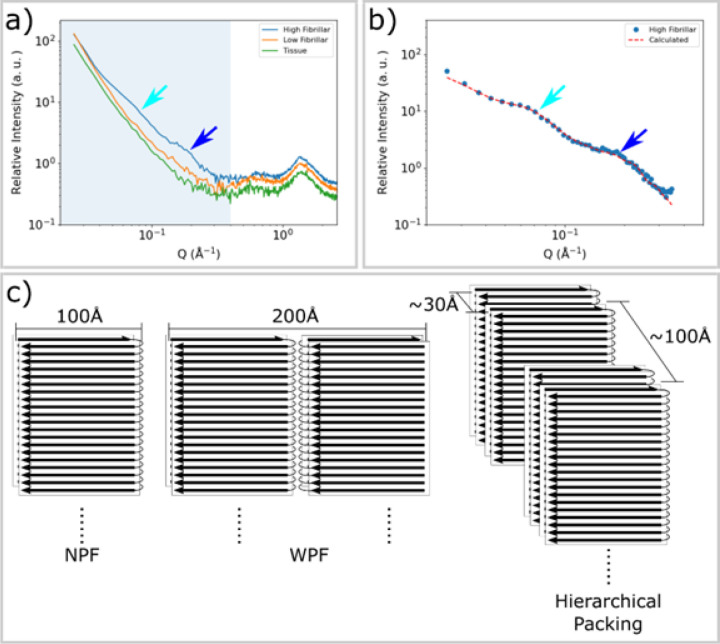
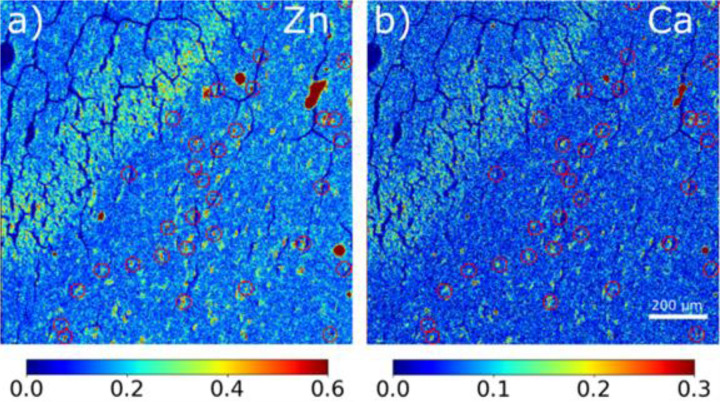
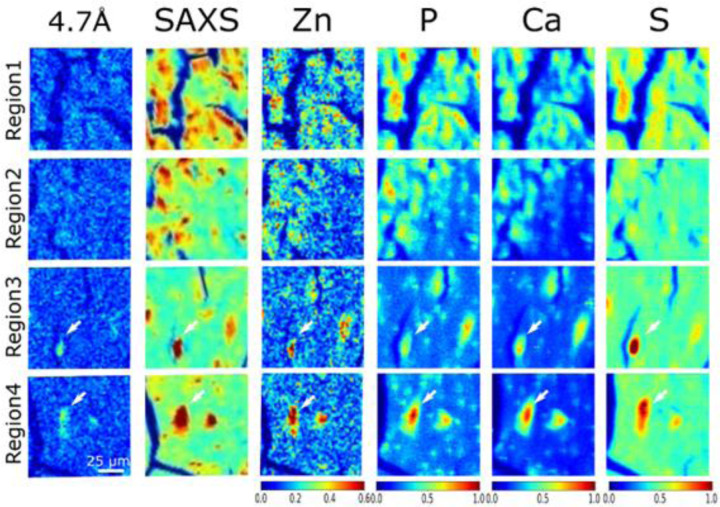
Tau protein plays a central role in many neuropathies. The trajectory by which tau spreads through neural networks is disease-specific but the events driving progression are unknown. This is due in part to the challenge of characterizing tau aggregates in situ. We address that challenge using in situ micro-x-ray diffraction (µXRD) and micro-X-ray fluorescence (μXRF) to examine tau lesions in the brain of a 79-year-old male with dementia. Neuropathological examination revealed classical forms of tau in the hippocampal formation: extensive Pick bodies in the granular layer; modest numbers of neurofibrillary tangles and dystrophic neurites in the CA4 and hilus. µXRD indicated that Pick bodies are low in fibril content, whereas neurofibrillary lesions within adjacent tissue exhibit far greater density of fibrillar tau. μXRF demonstrated elevated levels of zinc, calcium and phosphorous in all tau-containing lesions whereas sulfur deposition was greatest in lesions exhibiting high fibrillar content. Correlation of lesion morphology with anatomical localization, tau fibrillation and differential elemental accumulation suggests tau fibrils generate biochemically distinct microenvironments that influence lesion morphology, tau seed formation and spreading.

Keywords: Biological Sciences; Biophysics and Computational Biology; neurodegenerative disease; tau; x-ray fluorescence microscopy; x-ray microdiffraction.


Conflict of interest statement

Competing Interest Statement: There are no competing interests.

Figures

Figure 1.
Figure 1.
a) Experimental scheme for collecting µXRD and µXRF data simultaneously. The X-ray beam is focused to 2.5 μm by the lens and the sample is raster scanned with step size of 2.5 μm. µXRD from tau lesions gives rise to a prototypical cross-β fiber diffraction pattern, which is dominated by reflections at scattering angles corresponding to periodicities of 10 Å and 4.7 Å. An XRF detector is placed nearly perpendicular to the sample to simultaneously collect XRF signal. b) Azimuthally averaged scattering patterns from a tau lesion with significant high-fibrillar tau (blue); a tau-containing lesion containing low-fibrillar tau (orange) and a region of tissue exhibiting no tau pathology (green). High-fibrillar tau gives rise to a pronounced 4.7 Å peak, the intensity of which can be estimated by subtracting a smooth background and integrating the remaining intensity (red fill). Short fibrils, or tau aggregates that are low-fibrillar may give rise to a weak peak at 4.7 Å spacing that can also be estimated through subtraction of a smooth background. Surrounding tissue also gives rise to broad scattering peaks at ~ 10 Å and 4.7 Å spacing, but lacks the additional pronounced features at 4.7 Å. c) μXRF spectra from a tau lesion with significant high-fibrillar tau (blue); a tau-containing lesion with little or low-fibrillar tau (orange) and a region of tissue exhibiting no tau pathology (green). The spectral line exhibits patterns of chemical elements, including sulfur (S) with Kα edge at 2.31 KeV, calcium (Ca) at 3.64 KeV, iron (Fe) at 6.4 KeV and zinc (Zn) at 8.64 KeV. The peak at 13 KeV arises from Rayleigh and Compton scattering of the incident X-ray beam. The maps of elemental distributions are calculated by integrating the spectrum over a range of ± 0.1KeV around the corresponding Kα energy for each pixel. Intensity of peaks in the XRF spectrum reveal a relative degree of deposition of each element within the tissue sample.
Figure 2.
Figure 2.
µXRD analysis of a region of a Dentate Gyrus including the Granular Layer (GL), Hilus (H) and the Cornu Ammonis region 4 (CA4) of the hippocampus. a) Image of a serial section stained for Aβ corresponding to the region of the unstained section scanned by XRD. Different cell morphologies, including granule cell and pyramidal cell, are present. b) Image of a serial section stained for tau. The granular layer is dominated by Pick bodies, while tau lesions from dystrophic neurites and pyramidal cells are distributed across the hilus region. Two inserts show the distribution of tau lesions in granular layer (green box) and hilus region (red box). c) The distribution of macromolecular density is calculated by integrating the small-angle X-ray scattering intensity within the range of 0.05 – 0.25 Å−1 of Q. The distribution of macromolecular density exhibits dense features in both the granular layer, CA4 and hilus and includes features that are low in fibrillar content and those that exhibit a high concentration of fibrillar tau (indicated by red circles). d) The distribution of fibrillar tau is determined by the integral intensity of patterns after diffuse background subtraction. Regions containing oligomeric or low fibrillar aggregates appear as light blue; high fibrillar lesions as bright blue (marked by red circles). Two inserts on the right show the distribution of aggregates in the Granular layer (green box) and fibrils in the Hilus region (red box). R1-R4 are four ROIs in which high resolution XRF images were collected as detailed in Figure 5. The relative intensity of color scale for c) and d) is given in arbitrary units.
Figure 3.
Figure 3.
SAXS from fibrillar tau exhibits distinctive peaks. a) The SAXS profiles from tissue devoid of tau aggregates (green), containing low fibril content (orange) and having high levels of fibrillar tau (blue) as identified by the intensity of the pronounced WAXS reflection at 4.7 Å spacing. Patterns exhibiting strong cross-β related features in the WAXS regime (Q ~ 1.36 Å−1) also exhibit distinctive features in the SAXS regime, highlighted by cyan and blue arrows at Q ~ 0.07 Å−1 and ~ 0.2 Å−1. b) Background-subtracted SAXS intensities correspond well with those calculated from a hierarchical model of fibrillar organization exhibiting hierarchical packing with limited variation in fibril-fibril distances. c) A diagram of the narrow pick filament (NPF), the wide pick filament (WPF) and the model of hierarchical packing used to fit the observed data. Inter-fibrillar distances of 30 Å and 100 Å are representative of the polymorphic hierarchical organization indicated by the shape of the SAXS scattering as detailed in Figure S4.
Figure 4.
Figure 4.
Distribution of X-ray fluorescence signal from (a) zinc and (b) calcium. Red circles indicate the locations of fibrils as determined from µXRD. The relative intensity of color scale bars is in arbitrary units.
Figure 5.
Figure 5.
Correlation of the distribution of tau fibrils (left column), integral intensity of SAXS from macromolecular deposition (second column from left) and distribution of select elements. Regions 1–4 correspond to those highlighted as yellow boxes in Figure 2d and Extended Data Figure S6 and S8. Regions 1 and 2 are in the granular layer, where tau is low in fibrillar content as indicated by µXRD. Regions 3 and 4 are in the hilus where lesions are dominated by fibrillar tau. The white arrows in Regions 3 and 4 highlight the fibrillar tau identified by the 4.7 Å, β-strand reflection. The relative intensity of color scale bars is given in arbitrary units.

References

    1. Falcon B., Zhang W., Murzin A. G., Murshudov G., Garringer H., Vidal R., . . . Goedert M. (2018). Structures of filaments from Pick’s disease reveal a novel tau protein fold. Nature, 561(7721), 137–140. - PMC - PubMed
    1. Fitzpatrick A. W., Falcon B., He S., Murzin A. G., Murshudov G., Garringer H. J., . . . Scheres S. H. (2017). Cryo-EM structures of tau filaments from Alzheimer’s disease. Nature, 547(7662), 185–190. - PMC - PubMed
    1. Mate De Gerando A., Welikovitch L. A., Khasnavis A., Commins C., Glynn C., Chun J., . . . Hyman B. T. (2023). Tau seeding and spreading in vivo is supported by both AD-derived fibrillar and oligomeric tau. Acta Neuropathologica, 1–20. - PMC - PubMed
    1. Liu J., Costantino I., Venugopalan N., Fischetti R., Hyman B., Frosch M., . . . Makowski L. (2016). Amyloid structure exhibits polymorphism on multiple length scales in human brain tissue. Scientific reports, 6(1), 33079. - PMC - PubMed
    1. Berriman J., Serpell L. C., Oberg K. A., Fink A. L., Goedert M., & Crowther R. A. (2003). Tau filaments from human brain and from in vitro assembly of recombinant protein show cross-β structure. PNAS, 100(5), 9034–9038. - PMC - PubMed

Publication types

LinkOut - more resources