[Preprint]. 2024 Nov 15:2024.11.14.623607.
doi: 10.1101/2024.11.14.623607.

ATR safeguards replication forks against APOBEC3B-induced toxic PARP1 trapping

Affiliations

ATR safeguards replication forks against APOBEC3B-induced toxic PARP1 trapping

Pedro Ortega et al. bioRxiv. .

Update in

Abstract

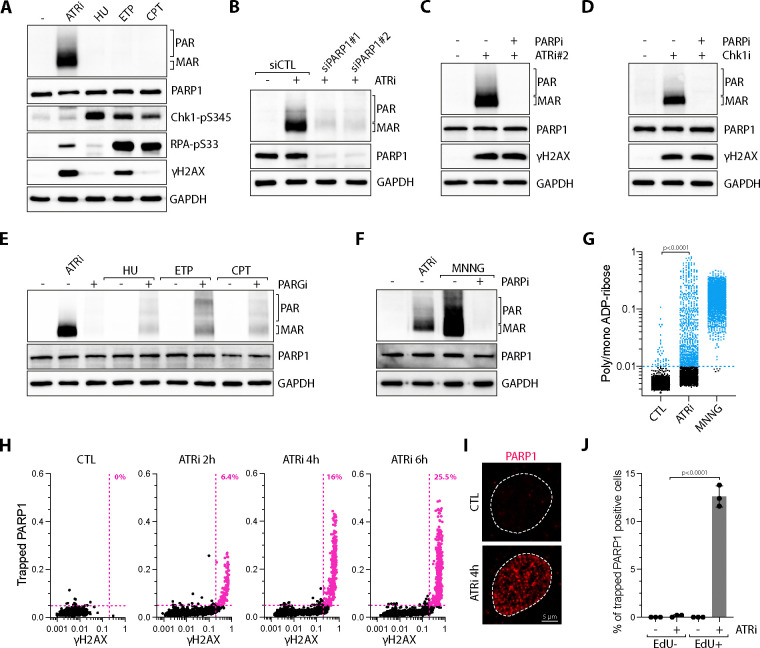
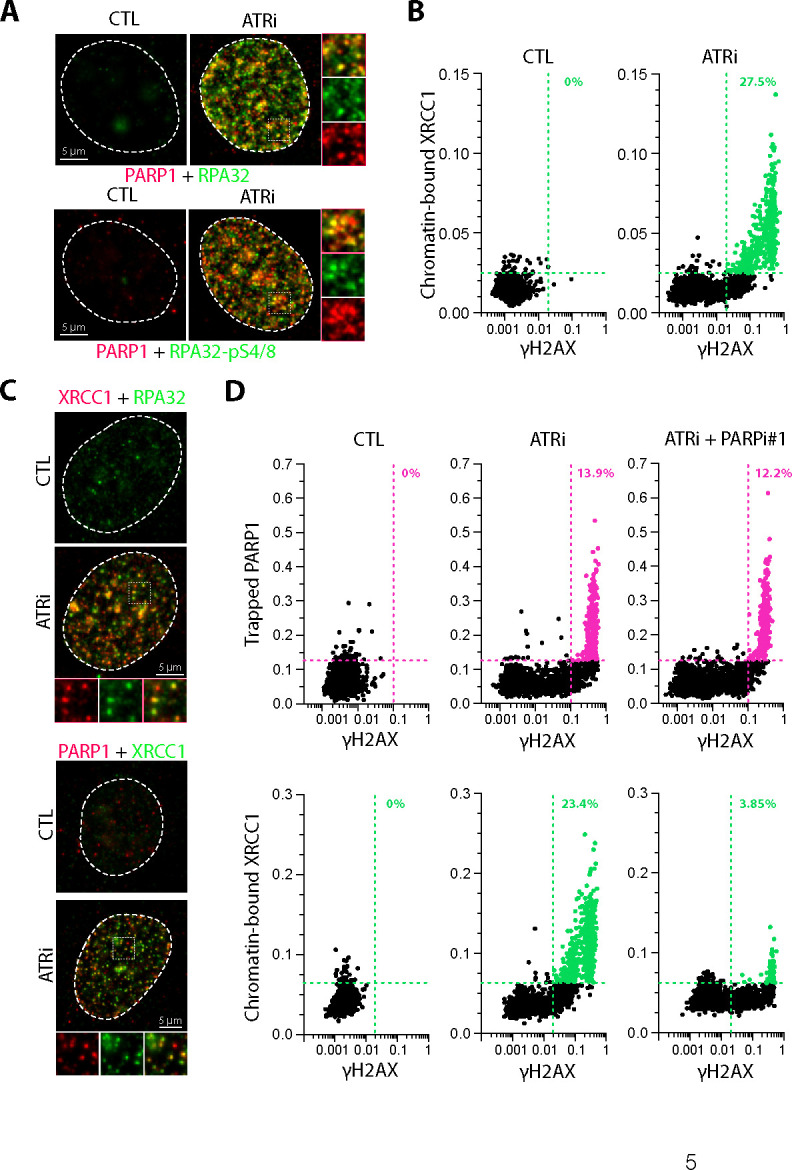
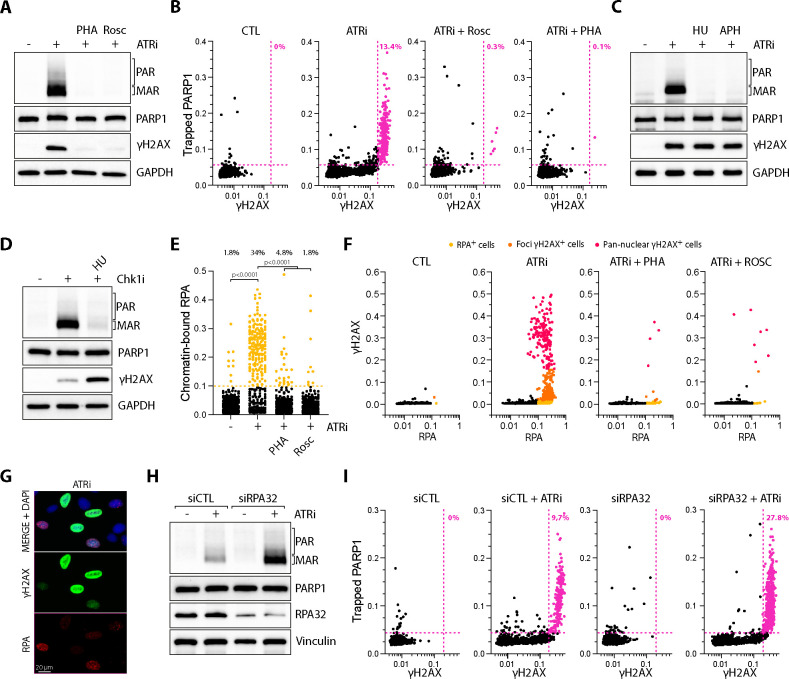
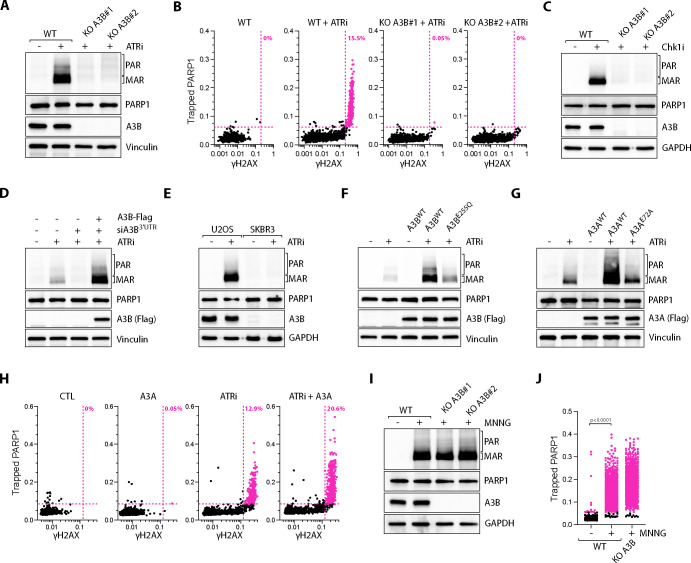
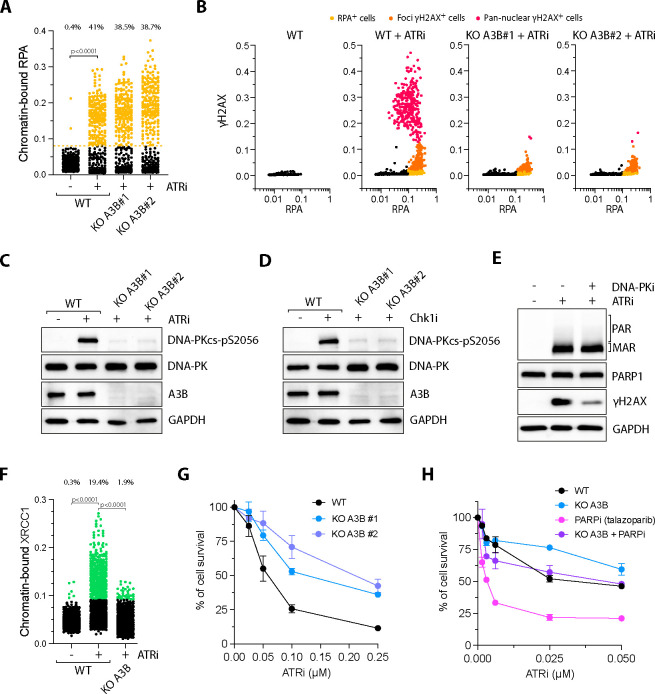
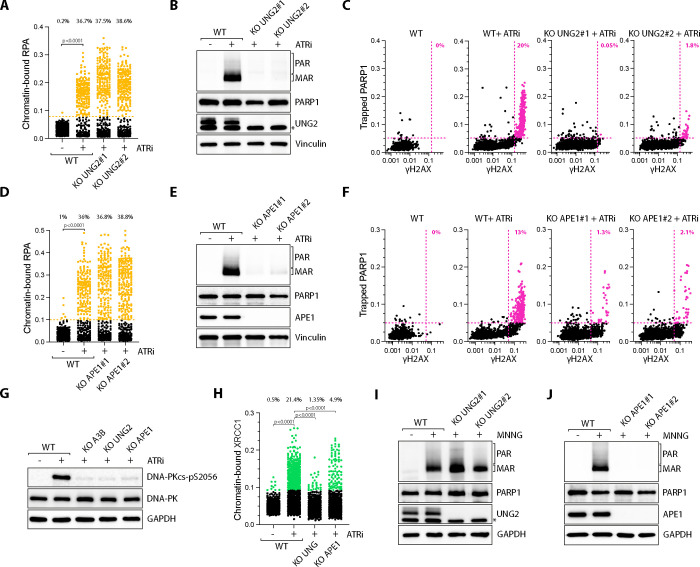
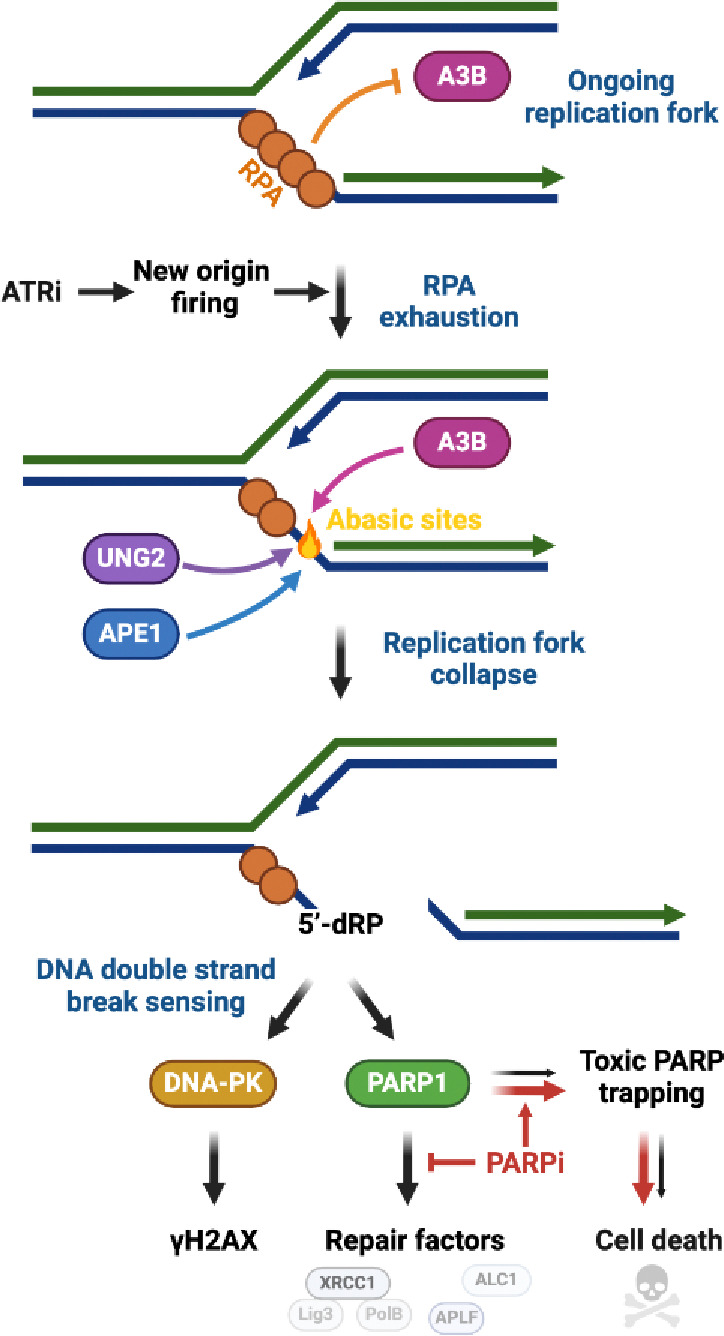
ATR is the master safeguard of genomic integrity during DNA replication. Acute inhibition of ATR with ATR inhibitor (ATRi) triggers a surge in origin firing, leading to increased levels of single-stranded DNA (ssDNA) that rapidly deplete all available RPA. This leaves ssDNA unprotected and susceptible to breakage, a phenomenon known as replication catastrophe. However, the mechanism by which unprotected ssDNA breaks remains unclear. Here, we reveal that APOBEC3B is the key enzyme targeting unprotected ssDNA at replication forks, triggering a reaction cascade that induces fork collapse and PARP1 hyperactivation. Mechanistically, we demonstrate that uracils generated by APOBEC3B at replication forks are removed by UNG2, creating abasic sites that are subsequently cleaved by APE1 endonuclease. Moreover, we demonstrate that APE1-mediated DNA cleavage is the critical enzymatic step for PARP1 trapping and hyperactivation in cells, regardless of how abasic sites are generated on DNA. Finally, we show that APOBEC3B-induced toxic PARP1 trapping in response to ATRi drives cell sensitivity to ATR inhibition, creating to a context of synthetic lethality when combined with PARP inhibitors. Together, these findings reveal the mechanisms that cause replication forks to break during replication catastrophe and explain why ATRi-treated cells are particularly sensitive to PARP inhibitors.


Conflict of interest statement

DECLARATION OF INTERESTS The authors declare no competing interests.

Figures

Figure 1:
Figure 1:. ATR inhibition induces PARP1 hyperactivation in S-phase.
A. U2OS cells were treated with ATRi (1 μM), HU (2 mM), ETP (25 μM), or CPT (1 μM) for 4h and analyzed by western blot using the indicated antibodies. B. U2OS cells were transfected with siRNA against PARP1 for 40h and subsequently treated with ATRi (1 μM) for 4h, and the levels of MAR/PAR were analyzed by western blot. C-D. The levels of MAR/PAR were monitored by western blotting in U2OS cells treated with ATRi#2 (2 μM) (C) or Chk1i (1 μM) (D) for 4h in the presence or absence of PARPi (10 μM). E. U2OS cells were treated with ATRi (1 μM), HU (2 mM), ETP (25 μM), or CPT (1 μM) for 4h in the presence or absence of PARGi (2 μM). The levels of poly/mono ADP-ribose, PARP1, and GAPDH were analyzed by western blot. F. U2OS cells were treated with ATRi (1 μM; 4h) or MNNG (10 μM; 15 min) in the presence or absence of PARPi (10 μM with 1h pre-treatment), and the level of MAR/PAR was analyzed by western blot. G. Poly/mono ADP-ribose levels in the nucleus were monitored by immunofluorescence in 2,000 U2OS cells treated with ATRi (1 μM; 4h) or MNNG (10 μM; 1h). H. Quantification of nuclear PARP1 and γH2AX in 2,000 U2OS cells treated with ATRi (1 μM) for the indicated time. Colored dots and percentages indicate cells positive for γH2AX and PARP1. I. Representative immunofluorescence pictures for PARP1 staining in U2OS cells treated with DMSO or ATRi for 4h. Scale bar: 5 μm. J. Quantification of trapped PARP1-positive cells (%) across the whole population and subsequently categorized into EdU-positive or EdU-negative cells. U2OS cells were treated with EdU (10 μM) for 15 minutes before adding ATRi for 4 hours. Mean values ± SD (Number of biological replicates, n = 3). All P-values were calculated with a two-tailed Student t-test.
Figure 2:
Figure 2:. Recruitment of PARP1 and XRCC1 to replication forks upon ATR inhibition.
A. U2OS cells were treated with ATRi (1 μM), and the cellular localization of PARP1, RPA32, or RPA32-pS4/8 was monitored by immunofluorescence. Scale bar: 5 μm. B. Quantification of chromatin-bound XRCC1 and γH2AX in 2,000 U2OS cells treated with ATRi (1 μM) for 4h. Colored dots and percentages indicate cells positive for γH2AX and PARP1. C. U2OS cells were treated with ATRi (1 μM), and the cellular localization of the indicated proteins was monitored by immunofluorescence. Scale bar: 5 μm. D. Quantification of nuclear PARP1 or XRCC1 and γH2AX in 2,000 U2OS cells treated with ATRi (1 μM) in the presence or absence of PARPi (20 μM) for 4h. Colored dots and percentages indicate cells positive for γH2AX and PARP1 or XRCC1.
Figure 3:
Figure 3:. Unprotected ssDNA mediated by aberrant origin firing leads to PARP1 hyperactivation.
A-B. U2OS cells were treated with ATRi (1 μM) ± Roscovitine (12.5 μM) or PHA-793887 (3 μM) for 4h and analyzed by western blot (A) or by with immunofluorescence (number of cells, n=2,000) (B) with indicated antibodies. Cells were pre-extracted to remove soluble proteins before performing immunofluorescence. C-D. U2OS cells were treated with the indicated drugs for 4h and analyzed by western blot with antibodies against poly/mono ADP-ribose, PARP1, γH2AX, and GAPDH. E. Quantification of chromatin-bound RPA by immunofluorescence of 500 U2OS cells treated with ATRi (1 μM) ± PHA-793887 (3 μM) or Roscovitine (12.5 μM) for 4h. Top: Percentage of RPA-positive cells. F. Immunofluorescence quantification of γH2AX and chromatin-bound RPA levels in U2OS cells treated with ATRi (1 μM) ± PHA-793887 (3 μM) or Roscovitine (12.5 μM) for 4h (number of cells, n=2,000). Cells were color-coded as follows: yellow for RPA-positive cells only, orange for RPA-positive cells with low γH2AX intensity, and red for RPA-positive cells with high γH2AX intensity. G. Representative immunofluorescence picture of U2OS cells treated with ATRi for 4h and stained for γH2AX and RPA. Scale bar: 20 μm. H-I. U2OS cells were transfected with siRNA CTL or against RPA32 (0.01 nM) for 40h and subsequently treated with ATRi (1 μM) for 4h. Cells were then analyzed by western blot with indicated antibodies (H) or by immunofluorescence against PARP1 and γH2AX (number of cells, n=2,000) (I). Colored dots and percentages indicate cells positive for γH2AX and PARP1. All P-values were calculated with a two-tailed Student t-test.
Figure 4:
Figure 4:. APOBEC3B and APOBEC3A promote PARP1 hyperactivation at replication forks.
A-B. U2OS WT or A3B KO cells were treated with ATRi (1 μM) for 4h and analyzed by western blot (A) or by immunofluorescence (number of cells, n=2,000) (B) with indicated antibodies. Colored dots and percentage indicate cells positive for γH2AX and PARP1. C. The levels of MAR/PAR were monitored by western blot in U2OS WT or A3B KO cells treated with Chk1i (1 μM) for 4h. D. U2OS-A3B-flag cells ± DOX were transfected with an siRNA targeting the 3′UTR of endogenous A3B mRNA or a control siRNA (siCTL) for 40 h and subsequently were treated with ATRi (1 μM) for 4h. The levels of poly/mono ADP-ribose, PARP1, Flag (A3B), and Vinculin were detected by western blot. E. U2OS or SKBR3 cells were treated with ATRi (1 μM) for 4h and analyzed by western blot with antibodies against poly/mono ADP-ribose, PARP1, A3B, and GAPDH. F-G. U2OS expressing indicated constructs were treated with ATRi (1 μM) for 4h. The levels of poly/mono ADP-ribose, PARP1, Flag (A3B or A3A), and /or Vinculin were analyzed by western blot. H. Quantification by immunofluorescence of chromatin-bound PARP1 and γH2AX levels of 2,000 U2OS-A3A-flag cells ± DOX treated with ATRi (1 μM) for 4h. Colored dots and percentage indicate cells positive for γH2AX and PARP1. I. U2OS WT or A3B KO cells were treated with DMSO and MNNG (10 μM) for 15 min and analyzed by western blot with antibodies against the indicated proteins. J. PARP1 trapping was monitored by immunofluorescence in 2,000 U2OS WT or A3B KO cells treated with MNNG (10 μM) for 1h. Colored dots indicate cells positive for PARP1. All P-values were calculated with a two-tailed Student t-test.
Figure 5:
Figure 5:. APOBEC3B promotes ATR-mediated replication fork collapse.
A. Quantification of chromatin-bound RPA by immunofluorescence of 500 U2OS WT or A3B KO cells treated with ATRi (1 μM) for 4h. Top: Percentage of RPA-positive cells. B. U2OS WT or A3B KO cells were treated with ATRi (1 μM) for 4h and analyzed by immunofluorescence with RPA and γH2AX antibodies (number of cells, n=2,000). Cells were color-coded as follows: yellow for RPA-positive cells only, orange for RPA-positive cells with low γH2AX intensity, and red for RPA-positive cells with high γH2AX intensity. C-D. U2OS WT or A3B KO cells were treated with ATRi (1 μM) (C) or Chk1i (1 μM) (D) for 4h and analyzed by western blot with antibodies against DNA-PKcs-pS2056, DNA-PKcs, A3B, and GAPDH. E. The levels of poly/mono ADP-ribose, PARP1, γH2AX, and GAPDH were analyzed by western blot following treatment of U2OS cells with ATRi (1 μM; 4h) or DNA-PKi (5 μM; 4h). F. Chromatin-bound XRCC1 intensity quantification by immunofluorescence of 2,000 U2OS WT or A3B KO cells treated with ATRi (1 μM) for 4h. Top: Percentage of XRCC1-positive cells. G. Cell survival of U2OS WT or A3B KO cells treated with increasing concentrations of ATRi for 24 h and then cultured in inhibitor-free media for 48 h. Mean values ± SEM. Number of biological replicates, n = 3. H. Cell survival of U2OS WT or A3B KO cells treated with increasing concentration of ATRi ± PARPi (1 μM talazoparib) for 24 h and then cultured in inhibitor-free media for 48 h. Mean values ± SEM. Number of biological replicates, n = 3. All P-values were calculated with a two-tailed Student t-test.
Figure 6:
Figure 6:. Abasic site cleavage by APE1 induces PARP1 hyperactivation.
A. Chromatin-bound RPA intensity quantification by immunofluorescence of 2,000 U2OS WT or UNG2 KO cells treated with ATRi (1 μM) for 4h. Top: Percentage of RPA-positive cells. B-C. U2OS WT or UNG2 KO cells were treated with ATRi (1 μM) for 4h and analyzed by western blot (B) or by with immunofluorescence (number of cells, n=2,000) (C) with indicated antibodies. Colored dots and percentages indicate cells positive for γH2AX and PARP1. D. Chromatin-bound RPA intensity quantification by immunofluorescence of 2,000 U2OS WT or APE1 KO cells treated with ATRi (1 μM) for 4h. Top: Percentage of RPA-positive cells. E-F. U2OS WT or APE1 KO cells were treated with ATRi (1 μM) for 4h and analyzed by western blot (E) or by immunofluorescence (number of cells, n=2,000) (F) with indicated antibodies. Colored dots and percentages indicate cells positive for γH2AX and PARP1. G. The levels of DNA-PK-pS2056, DNA-PK, and GAPDH were analyzed by western blotting following ATRi (1 μM; 4h) in the indicated U2OS cell lines. H. U2OS WT, UNG2 KO, or APE1 KO cells were treated with ATRi (1 μM) for 4h and analyzed by immunofluorescence with XRCC1 and γH2AX antibodies (number of cells, n=2,000). Top: Percentage of XRCC1-positive cells. I-J. U2OS WT, UNG2 KO or APE1 KO cells were treated with MNNG (10 μM) for 15 min and analyzed by western blot with antibodies against poly/mono ADP-ribose, PARP1, UNG, APE1, and GAPDH. All P-values were calculated with a two-tailed Student t-test.
Figure 7:
Figure 7:. Working Model.
Following ATR inhibition, the surge of origin firing leads to RPA exhaustion, rendering ssDNA at replication forks unprotected from nuclear attacks. A3B promotes the deamination of cytosine on unprotected ssDNA, which are removed by UNG2 to form abasic sites. Abasic sites are subsequently cleaved by APE1, causing forks to collapse and DNA double-strand break formation, which is recognized by DNA-PK and PARP1. PARP1 recruits repair factors such as XRCC1 to replication forks. However, PARP1 trapping increases cellular sensitivity to ATR inhibitors, a vulnerability that is further amplified by PARP inhibitors, which stabilize toxic PARP trapping.

Similar articles

References

    1. Yazinski S. A. & Zou L. Functions, Regulation, and Therapeutic Implications of the ATR Checkpoint Pathway. Annu Rev Genet (2016) doi:10.1146/annurev-genet-121415-121658. - DOI - PubMed
    1. Saxena S. & Zou L. Hallmarks of DNA replication stress. Mol Cell 82, 2298–2314 (2022). - PMC - PubMed
    1. Saldivar J. C., Cortez D. & Cimprich K. A. The essential kinase ATR: Ensuring faithful duplication of a challenging genome. Nature Reviews Molecular Cell Biology vol. 18 622–636 Preprint at 10.1038/nrm.2017.67 (2017). - DOI - PMC - PubMed
    1. Barnieh F. M., Loadman P. M. & Falconer R. A. Progress towards a clinically-successful ATR inhibitor for cancer therapy. Current research in pharmacology and drug discovery 2, (2021). - PMC - PubMed
    1. Buisson R., Boisvert J. L., Benes C. H. & Zou L. Distinct but Concerted Roles of ATR, DNA-PK, and Chk1 in Countering Replication Stress during S Phase. Mol Cell 59, (2015). - PMC - PubMed

Publication types