[Preprint]. 2024 Oct 4:2024.10.04.616580.
doi: 10.1101/2024.10.04.616580.

APOE Protects Against Severe Infection with Mycobacterium tuberculosis by Restraining Production of Neutrophil Extracellular Traps

Affiliations

APOE Protects Against Severe Infection with Mycobacterium tuberculosis by Restraining Production of Neutrophil Extracellular Traps

Dong Liu et al. bioRxiv. .

Update in

Abstract

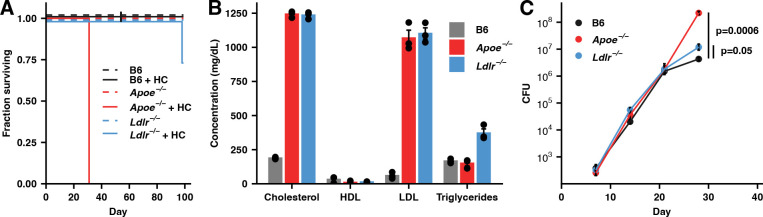
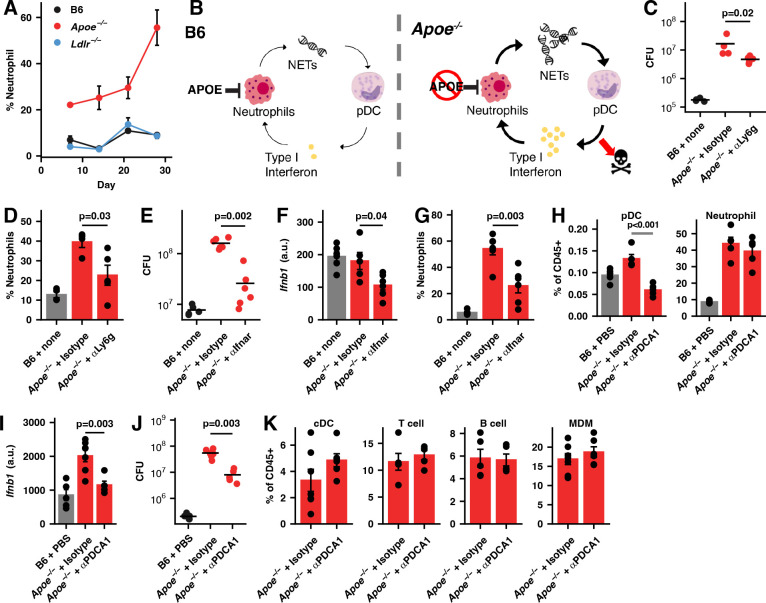
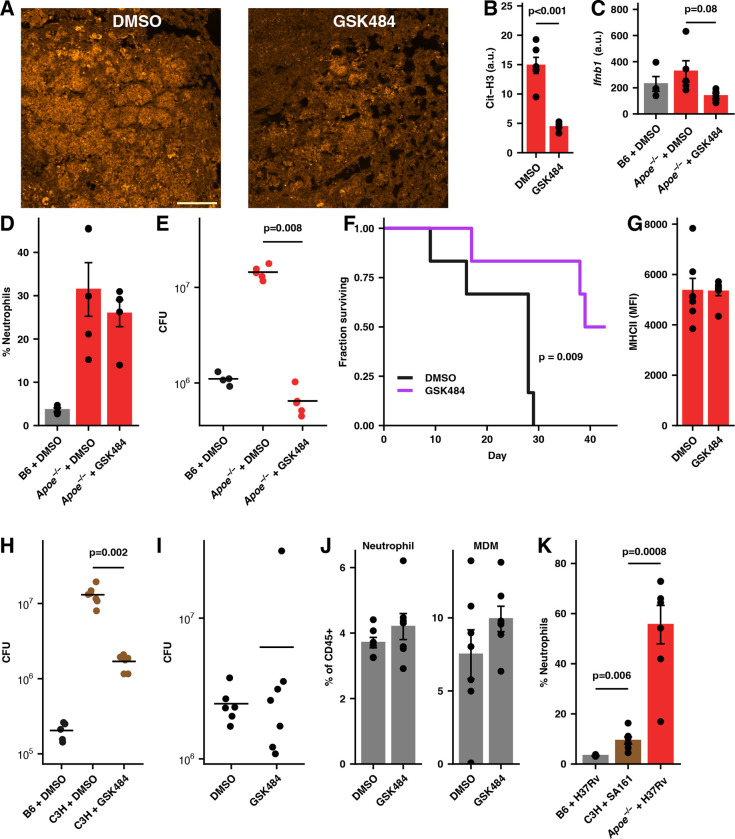
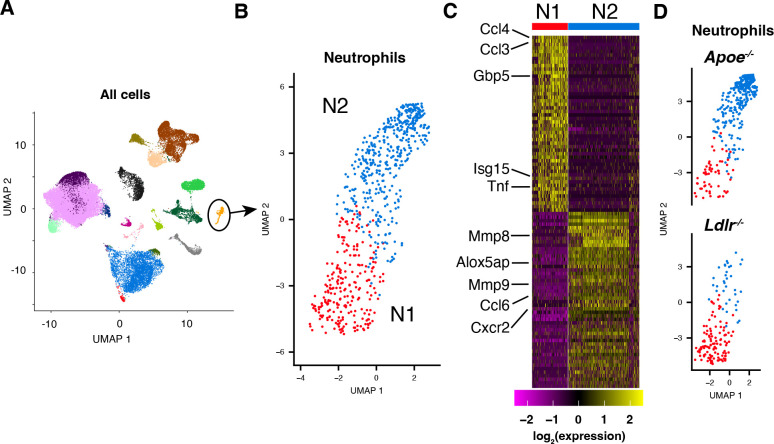
While neutrophils are the predominant cell type in the lungs of humans with active tuberculosis (TB), they are relatively scarce in the lungs of most strains of mice that are used to study the disease. However, similar to humans, neutrophils account for approximately 45% of CD45+ cells in the lungs of Apoe -/- mice on a high-cholesterol (HC) diet following infection with Mycobacterium tuberculosis (Mtb). We hypothesized that the susceptibility of Apoe -/- HC mice might arise from an unrestrained feed-forward loop in which production of neutrophil extracellular traps (NETs) stimulates production of type I interferons by pDCs which in turn leads to the recruitment and activation of more neutrophils, and demonstrated that depleting neutrophils, depleting plasmacytoid dendritic cells (pDCs), or blocking type I interferon signaling, improved the outcome of infection. In concordance with these results, we found that Mtb-infected in Apoe -/- HC mice produce high levels of LTB4 and 12-HETE, two eicosanoids known to act as neutrophil chemoattractants and showed that blocking leukotriene B4 (LTB4) receptor signaling also improved the outcome of tuberculosis. While production of NETs has been associated with severe tuberculosis in other mouse models and in humans, a causative role for NETs in the pathology has not been directly established. We demonstrate that blocking the activation of peptidylarginine deiminase 4 (PAD4), an enzyme critical to NET formation, leads to fewer NETs in the lungs and, strikingly, completely reverses the hypersusceptibility of Apoe -/- HC mice to tuberculosis.


Conflict of interest statement

Competing interests: Authors declare that they have no competing interests.

Figures

Fig. 1.
Fig. 1.. Apoe−/− HC mice are highly susceptible to infection with Mtb.
(A) Male mice of the indicated genotypes were fed either normal food or high-cholesterol food for two weeks and then infected with ~50 CFU Mtb H37Rv and maintained on their pre-infection diet. (n=3 mice/group) (B) Serum cholesterol profiles at day 28 following infection of the indicated genotypes of mice fed HC food and infected with Mtb H37Rv as in (A). HDL = high-density lipoproteins, LDL = low-density lipoproteins. (n=3 mice/group) (C) Bacterial burden in the lung measured by CFU counting for mice of the indicated genotypes at the indicated time points fed HC food and infected with Mtb H37Rv as in (A). (n=5–7 mice/group) Bars/lines indicate mean; error bars indicate SEM. Significance analysis was performed using the two-sided Student’s t-test allowing for unequal variances (C).
Fig. 2.
Fig. 2.. T cell priming is intact in Apoe−/− HC mice.
(A) Expansion of CFSE-labeled, CD8 (OT-I) or CD4 (OT-II) T cells specific for Ova peptides as measured by flow cytometry, shown as a percentage of cells dividing in the draining (mediastinal) lymph node, in mice of the indicated genotypes maintained on a HC diet at 4 days following intranasal inoculation with 2×10⁸ CFU BCG-Ova. (n=3–4 mice/group) (B, C) Expansion of CFSE-labeled, ESAT-6 specific transgenic CD4+ T cells (C7) as measured by flow cytometry, shown as a percentage of cells dividing in the draining (cervical) lymph node, in mice of the indicated genotypes maintained on a normal (B) or HC (C) diet at 5 days following inoculation with 10,000 CFU Mtb H37Rv in the dermis of the ear. (n=5 mice/group) (D) Number of CD8+ TB10.4+ T cells in the lung parenchyma (defined by lack of labeling by an intravenous anti-CD45 antibody (IV−), see Methods) at day 19 following infection with ~50 CFU Mtb H37Rv in the indicated genotypes of mice maintained on a HC diet. (n=7 mice/group) (E) Percentage CD8+ T cells in single-cell suspensions of lung tissue from mice in (D) producing both IFNG and TNF when restimulated with TB10.4 peptides assessed by intracellular staining and flow cytometry. (n=7 mice/group) Bars indicate mean; error bars indicate SEM. Data are representative of 2–4 independent experiments. See Figure S4 for gating strategies.
Fig. 3.
Fig. 3.. pDC produced Type I interferon contributes to the susceptibility of Apoe−/− HC mice.
(A) The kinetics of neutrophil infiltration into the lungs of mice of the indicated genotypes maintained on a HC diet and infected with ~50 CFU H37Rv, as assessed by flow cytometry, expressed as the percentage of total CD45+ cells in the lung. (n=5–7 mice/group) (B) Model for extreme susceptibility of Apoe−/− HC mice. (C-K) Apoe−/− or B6 mice were placed on a HC diet for two weeks, infected with ~50 CFU H37Rv via aerosol, and maintained on the diet for the entire experiment. Neutrophil depletion: (C) Pulmonary bacterial burden and (D) neutrophil fraction of CD45+ cells at day 24 PI in the indicated treatments. IFNAR blockade: (E) Pulmonary bacterial burden, (F) expression of Ifnb1 mRNA, and (G) neutrophil fractions of CD45+ cells in the lung at day 21 PI in the indicated treatments. pDC depletion: (H) Fractions of pDCs and neutrophils among pulmonary CD45+ cells, (I) expression of Ifnb1 mRNA in the lung, and (J) pulmonary bacterial burden at day 28 PI. (K) Fractions of the conventional DCs (cDCs), T cells, B cells, and monocyte-derived macrophages (MDMs) among pulmonary CD45+ cells for mice the mice in (H). Bars/lines indicate mean; error bars indicate SEM. Data are representative of 2 independent experiments (n=4–7) mice/group) (C-K). Significance analysis was performed using the two-sided Student’s t-test allowing for unequal variances (D, F-H, I) or the Wilcox rank-sum test (C,E,J). See Figure S5 for gating strategies.
Fig. 4.
Fig. 4.. Restraining NET formation protects Apoe−/− HC mice against severe tuberculosis.
(A) Representative images of lung sections from Mtb H37Rv infected Apoe−/− HC mice treated with GSK484 or vehicle daily from days 7–28 PI. Sections were labeled with anti-Cit-H3 antibody (orange) and imaged with confocal microscopy. Scale bar is 100 μm. (B) Quantification of the mean fluorescent signal of Cit-H3 labeling for 6 lesions from 3 mice from each condition in (A). (n=6 lesions/group) (C) Expression of Ifnb1 mRNA in the lung, (D) fraction of neutrophils among pulmonary CD45+ cells, (E) and bacterial burden at day 28 PI in mice treated as indicated. (n=4–5 mice/group) (F) Apoe−/− HC mice were infected and treated as in (A). The fraction of mice surviving to day 40 is plotted. (n=6 mice/group) (G) The expression of MHCII on MDM expressed as MFI assessed by flow cytometry from mice treated as in (A). (n=7 mice/group) (H) C3H mice were infected with ~50 CFU Mtb SA161 treated with GSK484 or vehicle daily starting at day 7 PI. Bacterial burden in the lung was measured by CFU at day 28 PI. (n=6–7 mice/group) (I) B6 mice were infected with ~50 CFU Mtb H37Rv and treated with GSK484 or vehicle daily starting at day 7 PI. Bacterial burden in the lung was measured by CFU at day 28 PI. (n=6–7 mice/group) (J) The percentage of neutrophils and monocyte-derived macrophages among pulmonary CD45+ cells as measured by flow cytometry at day 28 PI in mice described in (I). (K) Fraction of pulmonary neutrophils among all CD45+ cells in untreated mice in the infections described in (A), (H), and (I). Bars/lines indicate mean; error bars indicate SEM. Data are representative of two independent experiments (C-E, G). Significance analysis was performed using the two-sided Student’s t-test allowing for unequal variances (B,C,D,G,K), the Wilcox rank-sum test (E,H,I), or the Mantel-Haenszel test (F). See Figure S5 for gating strategies.
Fig. 5.
Fig. 5.. LTB4 and 12-HETE contribute to the hypersusceptibility of Apoe HC mice.
(A) Mice of the indicated genotypes were infected with ~50 CFU Mtb H37Rv and maintained on their pre-infection diet. At the indicated time points, levels of LTB4 and 12-HETE in the serum were measured by mass-spectrometry. (n=3 mice/group) (B) Apoe−/− HC mice were infected with ~50 CFU Mtb H37Rv and left untreated or treated with CP-105696 daily starting at day 7 following infection until day 28. Bacterial burden in the lung was measured at day 28 PI by CFU. (n=6–7 mice/group) (C,D) The percentage of neutrophils (C) and monocyte-derived macrophages (D) among pulmonary CD45+ cells as measured by flow cytometry at day 28 PI in mice described in (B). (n=6–7 mice/group) (E) B6 mice were infected with ~50 CFU Mtb H37Rv and left untreated or treated with CP-105696 daily starting at day 7 following infection. Bacterial burden in the lung was measured by CFU at day 28 PI. (n=6–7 mice/group) (F) The percentage of neutrophils and monocyte-derived macrophages among pulmonary CD45+ cells as measured by flow cytometry at day 28 PI in mice described in (A). (n=6–7 mice/group) Bars indicate mean; error bars indicate SEM. Significance analysis was performed using the Wilcox rank-sum test (B,E) or the two-sided Student’s t-test allowing for unequal variances (C,D,F). See Figure S5 for gating strategies.
Fig. 6.
Fig. 6.. Neutrophils in Apoe−/− HC mice have a distinct polarization state.
(A) UMAP plot of expression measurements from single-cell RNA-seq analysis of pulmonary immune cells isolated from B6, Apoe−/−, and Ldlr−/− HC mice at day 14 PI with ~50 CFU Mtb H37Rv (See Methods.). The neutrophil population, identified by comparison with the ImmGen database of transcriptional profiles (https://www.immgen.org) and confirmed by examining expression of Ly6g and S100a8, is shown in orange and circled. (B) UMAP plot of re-clustered expression measurements for the neutrophil population shown in (A). (C) Heatmap of row-normalized expression measures for the top 100 genes that distinguish the clusters labeled N1 and N2 in (B). (D) UMAP plot of neutrophils from Apoe−/− and Ldlr−/− HC mice at day 14 PI. The relative sizes of the N1 and N2 clusters are Apoe−/− log2(N2/N1) = 2.1 ± 1.5 and Ldlr−/− log2(N2/N1) = −1.8 ± 0.3 (mean ± SEM for 3 replicates). See Figure S5 for gating strategy.
Fig. 7.
Fig. 7.. Transcriptional analysis of macrophages and neutrophils isolated from B6:Apoe−/− mixed bone marrow chimeric mice.
(A) Volcano plot depicting differential expression between Apoe−/− and B6 bystander (uninfected) neutrophils isolated from B6:Apoe−/− mixed bone marrow chimeric mice, maintained on a normal diet, 28 days following infection with ~50 CFU H37Rv. Genes that are most characteristic of N1 and N2 neutrophils in Mtb-infected mice on a HC diet as determined by single-cell RNA-seq analysis are colored (See Figure 5C). Dashed line indicates FDR=0.05. (n=3 mice/group) (B) Multidimensional scaling (MDS) plot65 of gene expression in alveolar macrophages (AM), monocyte-derived macrophages (MDM), and neutrophils isolated by cell sorting from B6:Apoe−/− mixed bone marrow chimeric mice at Day 28 following infection with ~50 CFU of Mtb H37Rv expressing mCherry66. The top 500 genes with the largest standard deviations across samples were used to generate the plot. Distances on the plot represent the leading log2-fold-changes, which are defined as the root-mean-square average of the top largest log2-fold-changes between each pair of samples. (n=3 mice/group) See Figure S5 for gating strategy.

References

    1. Mahley R. W., Apolipoprotein E: cholesterol transport protein with expanding role in cell biology. Science 240, 622–630 (1988). - PubMed
    1. Sacks F. M., The crucial roles of apolipoproteins E and C-III in apoB lipoprotein metabolism in normolipidemia and hypertriglyceridemia. Curr. Opin. Lipidol. 26, 56–63 (2015). - PMC - PubMed
    1. Zhang S. H., Reddick R. L., Piedrahita J. A., Maeda N., Spontaneous hypercholesterolemia and arterial lesions in mice lacking apolipoprotein E. Science 258, 468–471 (1992). - PubMed
    1. Plump A. S., Smith J. D., Hayek T., Aalto-Setälä K., Walsh A., Verstuyft J. G., Rubin E. M., Breslow J. L., Severe hypercholesterolemia and atherosclerosis in apolipoprotein E-deficient mice created by homologous recombination in ES cells. Cell 71, 343–353 (1992). - PubMed
    1. Ishibashi S., Brown M. S., Goldstein J. L., Gerard R. D., Hammer R. E., Herz J., Hypercholesterolemia in low density lipoprotein receptor knockout mice and its reversal by adenovirus-mediated gene delivery. J. Clin. Invest. 92, 883–893 (1993). - PMC - PubMed

Publication types