[Preprint]. 2024 Nov 15:2024.11.15.623271.
doi: 10.1101/2024.11.15.623271.

Attentional failures after sleep deprivation represent moments of cerebrospinal fluid flow

Affiliations

Attentional failures after sleep deprivation represent moments of cerebrospinal fluid flow

Zinong Yang et al. bioRxiv. .

Abstract

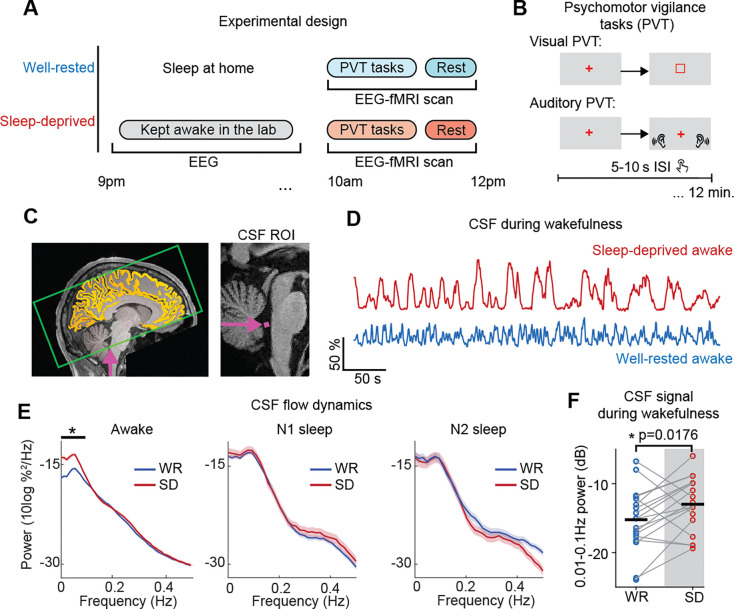
Sleep deprivation rapidly disrupts cognitive function, and in the long term contributes to neurological disease. Why sleep deprivation has such profound effects on cognition is not well understood. Here, we use simultaneous fast fMRI-EEG to test how sleep deprivation modulates cognitive, neural, and fluid dynamics in the human brain. We demonstrate that after sleep deprivation, sleep-like pulsatile cerebrospinal fluid (CSF) flow events intrude into the awake state. CSF flow is coupled to attentional function, with high flow during attentional impairment. Furthermore, CSF flow is tightly orchestrated in a series of brain-body changes including broadband neuronal shifts, pupil constriction, and altered systemic physiology, pointing to a coupled system of fluid dynamics and neuromodulatory state. The timing of these dynamics is consistent with a vascular mechanism regulated by neuromodulatory state, in which CSF begins to flow outward when attention fails, and flow reverses when attention recovers. The attentional costs of sleep deprivation may thus reflect an irrepressible need for neuronal rest periods and widespread pulsatile fluid flow.


Conflict of interest statement

Competing interests: LDL is an inventor on a pending patent application for an MRI method for measuring CSF flow.

Figures

Fig. 1.
Fig. 1.. After sleep deprivation, CSF flow exhibits large sleep-like low-frequency waves during wakefulness.
(A) Sleep-deprived (SD) visit: Subjects arrived at the laboratory at 7PM prior to the sleep-deprived night, and were monitored continuously during the night. Well-rested (WR) visit: Subjects arrived between 8:30–9am the day of the scan. For both visits, scans were performed around 10am in the morning. Scans included up to four PVT runs followed by a 25-minute resting-state run. (B) The PVT attention task: Each run used either the auditory PVT (detecting a beep) or the visual PVT (detecting a luminance-matched visual stimulus). (C) Left: Example fMRI acquisition volume position (green box) for simultaneous measurement of BOLD and CSF flow. The volume intersects the fourth ventricle, to enable upwards CSF flow detection. Yellow marks the cortical segmentation; purple indicates flow measurement ROI. Image masked to delete identifiers. Right: Example placement of CSF ROI (magenta) in the fourth ventricle in one representative subject. (D) CSF timeseries from the same subject during wakefulness shows that sleep deprivation causes large CSF waves during wakefulness, whereas the well-rested (WR) condition shows smaller CSF flow. (E) Sleep deprivation increased low frequency (0.01–0.1 Hz) CSF power during wakefulness (Awake n=486 segments in WR; 205 SD; N1 n=179 WR; n=59 SD; N2 n=57 WR; n=40 SD), black bar indicates p<0.05, permutation test with Bonferroni correction), to a magnitude similar to N1 and N2 sleep. Power spectral density (PSD) calculated on CSF signal in resting-state runs. Shading is standard error. (F) Paired analysis of CSF low-frequency power in resting-state wakefulness shows increased power after SD (n=18 subjects with artifact-free wakefulness at both sessions, paired t-test, Bonferroni corrected).
Fig. 2.
Fig. 2.. Pulsatile CSF flow dynamics increase during epochs with slower reaction times and attentional failures
(A) Reaction times (RTs) after sleep deprivation showed higher mean and a longer tail, indicating more behavioral lapses (Mann-Whitney U test, p<0.001). (B) Omission rate increased after sleep deprivation (n=26 subjects, p<0.001, paired t-test). (C) CSF flow and reaction time fluctuations during one example run, showing higher flow when reaction time slows down. (D) Low-frequency (0.01–0.1 Hz) CSF power within non-overlapping 60s segments, categorized into three different states: high attention (all RTs below 500 ms); low attention (at least one RT>500 ms), and omissions (at least one omission). Higher CSF power appears in lower attentional states (p<0.001 for main effect; one-way repeated measures ANOVA and Tukey post hoc test, n=26 subjects).
Fig. 3.
Fig. 3.. Pulsatile CSF flow is temporally coupled to pupil diameter changes and behavioral performance during wakefulness
(A) Spontaneous pupil constriction and dilation is time locked to peaks of CSF flow. Black bars indicate significant changes in z-scored pupil diameter compared to baseline (p<0.05, t-test, baseline = [−30 −28] s, Bonferroni corrected). (B) Cross correlation between pupil diameter and CSF showed strong correlation (maximal r = 0.26 at lag −4.25s; n = 709 segments, 26 participants) (C) During period with pupil constriction, reaction times also showed significant increase compared to same baseline (p<0.05, t-test, Bonferroni corrected). (D) Omission rate during task showed significant increase during pupil constriction, and significant decrease during pupil dilation (p<0.05, t-test, Bonferroni corrected). (E) Significant biphasic changes in cortical BOLD activity are locked to CSF peaks (p<0.05, t-test, Bonferroni corrected). (F) Mean CSF signal. (G) To estimate the impulse response function linking pupil size changes to BOLD and CSF activity, we convolved pupil diameter traces from each segments with a series of impulse response function (IRF). Estimated impulse response of the cortical BOLD signal to the pupil diameter shows a time-to-peak at 6.75s. Cross-correlation between pupil diameter and BOLD showed strong correlation (maximal r = 0.38 at lag 0s; n = 709 segments, 26 participants). (H) Predicting CSF flow with no additional parameter fitting, assuming that the derivative of the pupil-locked BOLD fluctuations drives CSF flow, shows significant prediction of the true CSF signals (zero lag r = 0.26; n=709 segments).
Fig. 4.
Fig. 4.. Attentional failures are coupled to pulsatile CSF flow and a series of neural and systemic physiological changes.
(A) Awake omission trials are locked to a biphasic change in CSF flow, with a downwards trough followed by an upwards peak. Time zero marks stimulus onset; omission occurs within the following seconds. (B) Omission trials are locked to a broadband drop in EEG power, including decreased alpha-beta (10–25Hz) EEG power then an increase in slow wave activity (SWA; 0.5–4 Hz) and alpha-beta power. The biphasic alpha-beta power change is widespread with centro-occipital predominance, whereas the SWA increase has occipital and frontal predominance. Spectrogram is normalized within-frequency; black bars indicate significant a change in broadband power (0.5–30Hz) compared to baseline (p<0.05, t-test, baseline=[−20 −10] s, Bonferroni corrected). (C) The aperiodic component of the EEG was subtracted to display oscillation-specific changes. The alpha-beta and SWA effects were still present (statistics in Fig. S5). (D) Pupil diameter showed a biphasic change at omissions, with a significant constriction during the omission trial followed by dilation after trial onset (9.00–12.00s). (E) Heart rate dropped during omissions and subsequently increased. (F) Respiratory rate dropped at omissions and subsequently increased. Black bars with stars indicate significant changes from baseline (n=364 trials, 26 subjects, p<0.05, paired t-test, Bonferroni corrected). Shading is standard error.
Fig. 5.
Fig. 5.. CSF flows outwards when attention drops, and back in when attention recovers.
(A) Omissions during wakefulness were categorized as isolated (Type A); onset of sustained low attention (Type B); and end of sustained low attention (Type C). Schematic made with BioRender. (B) Type A, isolated omission trials (n=127 trials, 26 subjects) were locked to a decrease in broadband EEG power, then increased power at attention recovery in the next trial. CSF showed a significant decrease followed by a significant increase. Respiratory rate and heart rate both showed significant changes from baseline after trial onset. Orange arrow points to the average timing (8.1s) of the first valid response after the isolated omission. (C) Type B: first omission of the series signifies the onset of a sustained low attentional state (n=61 trials, 20 subjects). CSF signal, respiratory rate and heart rate all decrease significantly (p<0.05, paired t-test, Bonferroni corrected). Orange arrow points to the average timing (25.1s) of the first valid response after the series of omissions. (D) Type C: last omission of the series, followed by increased attentional state (n=57 trials, 20 subjects). EEG shows heightened SWA during the omission and subsequent increase in alpha-beta power at recovery of attention. CSF signal, respiratory rate and heart rate all increase significantly (p<0.05, paired t-test, Bonferroni corrected). Orange arrow points to the average timing (9.0s after time 0) of the first valid response after the series of omission. For all panels in B-D: Black bars indicate significant (p<0.05, paired t-test, Bonferroni corrected) changes from baseline ([−10 −5] s). Shading is standard error.

Similar articles

References

    1. Jung C. M., Ronda J. M., Czeisler C. A., Wright K. P., Comparison of Sustained Attention Assessed by Auditory and Visual Psychomotor Vigilance Tasks (PVT) Prior to and During Sleep Deprivation. J. Sleep Res. 20, 348–355 (2011). - PMC - PubMed
    1. Lim J., Dinges D. F., Sleep Deprivation and Vigilant Attention. Ann. N. Y. Acad. Sci. 1129, 305–322 (2008). - PubMed
    1. Lim J., Dinges D. F., A Meta-Analysis of the Impact of Short-Term Sleep Deprivation on Cognitive Variables. Psychol. Bull. 136, 375 (2010). - PMC - PubMed
    1. Hudson A. N., Van Dongen H. P. A., Honn K. A., Sleep deprivation, vigilant attention, and brain function: a review. Neuropsychopharmacology 45, 21–30 (2020). - PMC - PubMed
    1. Durmer J. S., Dinges D. F., Neurocognitive Consequences of Sleep Deprivation. Semin. Neurol. 25, 117–129 (2005). - PubMed

Publication types

LinkOut - more resources