[Preprint]. 2024 Nov 14:2024.11.12.623215.
doi: 10.1101/2024.11.12.623215.

PrP turnover in vivo and the time to effect of prion disease therapeutics

Affiliations

PrP turnover in vivo and the time to effect of prion disease therapeutics

Taylor L Corridon et al. bioRxiv. .

Abstract

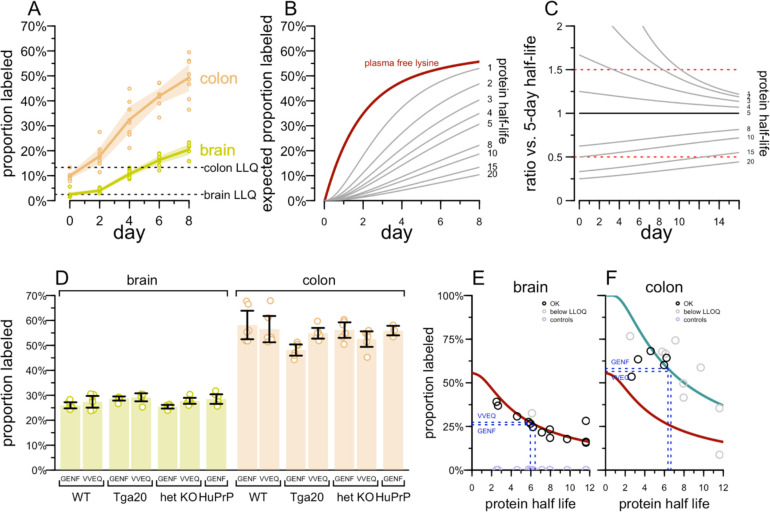
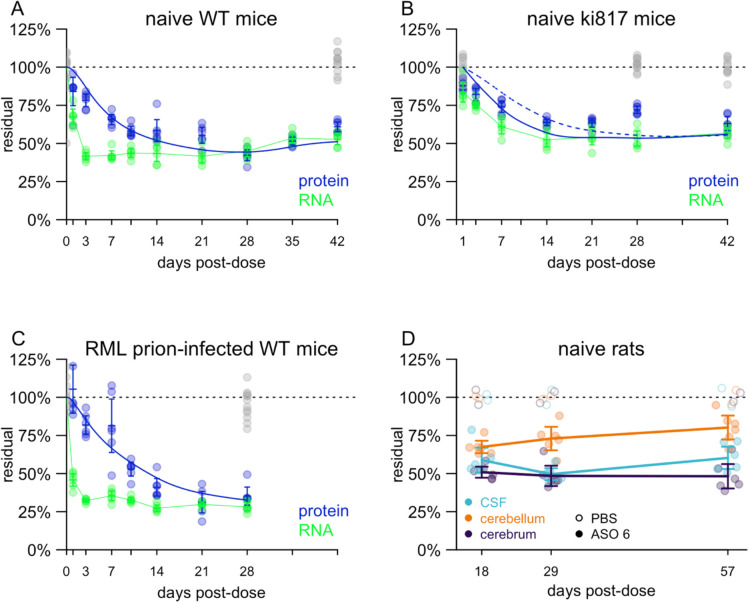
PrP lowering is effective against prion disease in animal models and is being tested clinically. Therapies in the current pipeline lower PrP production, leaving pre-existing PrP to be cleared according to its own half-life. We hypothesized that PrP's half-life may be a rate-limiting factor for the time to effect of PrP-lowering drugs, and one reason why late treatment of prion-infected mice is not as effective as early treatment. Using isotopically labeled chow with targeted mass spectrometry, as well as antisense oligonucleotide treatment followed by timed PrP measurement, we estimate a half-life of 5-6 days for PrP in the brain. PrP turnover is not affected by over- or under-expression. Mouse PrP and human PrP have similar turnover rates measured in wild-type or humanized knock-in mice. CSF PrP appears to mirror brain PrP in real time in rats. PrP is more readily quantifiable in colon than in other peripheral organs, and appears to have a shorter half-life in colon than in brain. Our data may inform the design of both preclinical and clinical studies of PrP-lowering drugs.


Conflict of interest statement

Competing interests BE and CB are employees of IQ Proteomics. ABS is an employee of Charles River Laboratories. NO is an employee and shareholder of Gate Bio. HTZ and BN are employees and shareholders of Ionis Pharmaceuticals. EVM acknowledges speaking fees from Abbvie, Eli Lilly, and Vertex; consulting fees from Alnylam and Deerfield; research support from Eli Lilly, Gate Bio, Ionis, and Sangamo. SMV acknowledges speaking fees from Abbvie, Biogen, Eli Lilly, Illumina, and Ultragenyx; consulting fees from Alnylam and Invitae; research support from Eli Lilly, Gate Bio, Ionis, and Sangamo.

Figures

Figure 1.
Figure 1.. Nomination of colon as a tissue for peripheral PrP quantification.
A) PRNP RNA expression in transcripts per million (TPM) in human tissues according to GTEx v8 public data. Each sub-tissue (e.g. brain – cerebellum) is represented by one point as the median TPM across all samples for that tissue, and each tissue (e.g. brain) is represented by one bar as the median of those medians. B) Western blot (top) and Coomassie (bottom) of organs all from the same 1 WT and 1 KO animal, 6D11 anti-PrP antibody, see Methods for details. C) Organs tested by PrP ELISA at a 1:100 final dilution (10% homogenates at a further 1:10). PrP ELISA as reported except using double the detection mAb concentration (0.5 μg/mL instead of 0.25 μg/mL). D) Organs tested by PrP ELISA at a 1:25 final dilution (10% homogenates at a further 1:2.5). PrP ELISA as reported except using double the detection mAb concentration (0.5 μg/mL instead of 0.25 μg/mL). See Figure S1 for further assay development.
Figure 2.
Figure 2.. Determination of PrP half-life by targeted mass spectrometry.
A) Accumulation of 13C6 label from chow in the VVEQ peptide in mouse brain and colon. B) The best fit to the proportion of plasma free lysine empirically found to be 13C6 labeled, as reported by Fornasiero (maroon), and the proportion of peptide expected to be labeled over time as a function of half-life (shown in days on the right side). See Methods > Labeled peptide accumulation models for details. C) The ratio of proportion labeled (B) for a peptide of each half-life compared to a peptide of 5-day half-life. Ratios of 0.5 and 1.5 are arbitrary landmarks highlighted to orient the eyes to a straight horizontal line. D) The proportion of PrP peptides VVEQ and GENF that are 13C6 labeled after 8 days as a function of mouse genotype. All differences are non-significant at Bonferroni-corrected P > 0.05, 2-sided T-test. E) Proportion labeled in brain (y axis) versus brain half-life previously reported by Fornasiero for all measured non-PrP peptides (circles); black = measured peptide signal above LLQ, gray = below LLQ. The maroon line represents the expected proportion labeled after 8 days as a function of half-life, based on the model from (B). The horizontal blue lines represent the proportion labeled observed for the two PrP peptides, and their vertical projection from the maroon curve down to the x axis represents the estimation of half-life from those proportion labeled measurements. F) As in (E), but for colon. The additional cyan curve represents the expected proportion labeled after 8 days if 100% of lysine available for protein synthesis is 13C6 labeled at all times.
Figure 3.
Figure 3.. Determination of PrP half-life by ASO administration and timed sacrifice.
A) Residual Prnp RNA and PrP protein (y axis), normalized to the mean of saline controls, at various timepoints (x axis) for wild-type mice after single ICV dose of 500 μg active ASO 6. Each point represents a whole brain hemisphere from one animal. All measurements in saline controls (both RNA and protein) are shown in gray. For each timepoint, line segments represent means and error bars represent 95% confidence intervals. The green curve represents linearly interpolated residual RNA concentration. The blue curve represents the exponential decay model fit to the data. B) As in (A) but for Ki817 human PrP 129V knock-in mice after a single dose 118 μg of ASO N. The solid blue line is the best fit model from the data in (B), while the dashed blue line represents a model using the half-life from (A) and the RNA data from (B). C) As in (A) but for wild-type mice infected with RML prions and treated with 300 μg ASO 6 at 105 dpi. D) Residual PrP in Sprague-Dawley rats treated with 1 mg of ASO 6 at day 0. Each point represents one animal, and for each timepoint, line segments represent means and error bars represent 95% confidence intervals. Long lines connect means of different timepoints.

References

    1. Minikel EV, Zhao HT, Le J, O’Moore J, Pitstick R, Graffam S, Carlson GA, Kavanaugh MP, Kriz J, Kim JB, Ma J, Wille H, Aiken J, McKenzie D, Doh-Ura K, Beck M, O’Keefe R, Stathopoulos J, Caron T, Schreiber SL, Carroll JB, Kordasiewicz HB, Cabin DE, Vallabh SM. Prion protein lowering is a disease-modifying therapy across prion disease stages, strains and endpoints. Nucleic Acids Res. 2020. Aug 10; - PMC - PubMed
    1. Raymond GJ, Zhao HT, Race B, Raymond LD, Williams K, Swayze EE, Graffam S, Le J, Caron T, Stathopoulos J, O’Keefe R, Lubke LL, Reidenbach AG, Kraus A, Schreiber SL, Mazur C, Cabin DE, Carroll JB, Minikel EV, Kordasiewicz H, Caughey B, Vallabh SM. Antisense oligonucleotides extend survival of prion-infected mice. JCI Insight. 2019. 30;5. - PMC - PubMed
    1. Nazor Friberg K, Hung G, Wancewicz E, Giles K, Black C, Freier S, Bennett F, Dearmond SJ, Freyman Y, Lessard P, Ghaemmaghami S, Prusiner SB. Intracerebral Infusion of Antisense Oligonucleotides Into Prion-infected Mice. Mol Ther Nucleic Acids. 2012;1:e9. - PMC - PubMed
    1. Prusiner SB. Prions. Proc Natl Acad Sci U S A. 1998. Nov 10;95(23):13363–13383. - PMC - PubMed
    1. Vallabh SM, Minikel EV, Schreiber SL, Lander ES. Towards a treatment for genetic prion disease: trials and biomarkers. Lancet Neurol. 2020. Apr;19(4):361–368. - PubMed

Publication types