Comprehensive analysis of molecular mechanisms underlying kidney stones: gene expression profiles and potential diagnostic markers
- PMID: 39606015
- PMCID: PMC11600312
- DOI: 10.3389/fgene.2024.1440774
Comprehensive analysis of molecular mechanisms underlying kidney stones: gene expression profiles and potential diagnostic markers
Abstract
Background: The study aimed to investigate the molecular mechanisms underlying kidney stones by analyzing gene expression profiles. They focused on identifying differentially expressed genes (DEGs), performing gene set enrichment analysis (GSEA), weighted gene co-expression network analysis (WGCNA), functional enrichment analysis, and screening optimal feature genes using various machine learning algorithms.
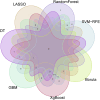
Methods: Data from the GSE73680 dataset, comprising normal renal papillary tissues and Randall's Plaque (RP) tissues, were downloaded from the GEO database. DEGs were identified using the limma R package, followed by GSEA and WGCNA to explore functional modules. Functional enrichment analysis was conducted using KEGG and Disease Ontology. Various machine learning algorithms were used for screening the most suitable feature genes, which were then assessed for their expression and diagnostic significance through Wilcoxon rank-sum tests and ROC curves. GSEA and correlation analysis were performed on optimal feature genes, and immune cell infiltration was assessed using the CIBERSORT algorithm.
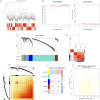
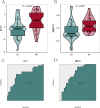
Results: 412 DEGs were identified, with 194 downregulated and 218 upregulated genes in kidney stone samples. GSEA revealed enriched pathways related to metabolic processes, immune response, and disease states. WGCNA identified modules correlated with kidney stones, particularly the yellow module. Functional enrichment analysis highlighted pathways involved in metabolism, immune response, and disease pathology. Through machine learning algorithms, KLK1 and MMP10 were identified as optimal feature genes, significantly upregulated in kidney stone samples, with high diagnostic value. GSEA further elucidated their biological functions and pathway associations.
Conclusion: The study comprehensively analyzed gene expression profiles to uncover molecular mechanisms underlying kidney stones. KLK1 and MMP10 were identified as potential diagnostic markers and key players in kidney stone progression. Functional enrichment analysis provided insights into their roles in metabolic processes, immune response, and disease pathology. These results contribute significantly to a better understanding of kidney stone pathogenesis and may inform future diagnostic and therapeutic strategies.
Keywords: gene expression; gene expression profiles; kidney stones; machine learning; molecular mechanism.
Copyright © 2024 Aji, Aikebaier, Abula and Song.
Conflict of interest statement
The authors declare that the study was carried out without any commercial or financial relationships that may be served as a potential conflict of interest.
Figures


References
-
- Bentéjac C., Csörgő A., Martínez-Muñoz G. (2021). A comparative analysis of gradient boosting algorithms. Artif. Intell. Rev. 54, 1937–1967. 10.1007/s10462-020-09896-5 - DOI
-
- Chen T., Guestrin C. (2016). “Xgboost: a scalable tree boosting system,” in Proceedings of the 22nd acm sigkdd international conference on knowledge discovery and data mining.
-
- Devetzi M., Goulielmaki M., Khoury N., Spandidos D. A., Sotiropoulou G., Christodoulou I., et al. (2018). Genetically-modified stem cells in treatment of human diseases: tissue kallikrein (KLK1)-based targeted therapy (Review). Int. J. Mol. Med. 41 (3), 1177–1186. 10.3892/ijmm.2018.3361 - DOI - PMC - PubMed
LinkOut - more resources
Full Text Sources

