. 2024 Nov 7:11:1386930.
doi: 10.3389/fmolb.2024.1386930. eCollection 2024.

Dynamics simulations of hypoxia inducible factor-1 regulatory network in cancer using formal verification techniques

Affiliations

Dynamics simulations of hypoxia inducible factor-1 regulatory network in cancer using formal verification techniques

Hafiz Muhammad Faraz Azhar et al. Front Mol Biosci. .

Abstract

Hypoxia-inducible factor-1 (HIF-1) regulates cell growth, protein translation, metabolic pathways and therefore, has been advocated as a promising biological target for the therapeutic interventions against cancer. In general, hyperactivation of HIF-1 in cancer has been associated with increases in the expression of glucose transporter type-1 (GLUT-1) thus, enhancing glucose consumption and hyperactivating metabolic pathways. The collective behavior of GLUT-1 along with previously known key players AKT, OGT, and VEGF is not fully characterized and lacks clarity of how glucose uptake through this pathway (HIF-1) probes the cancer progression. This study uses a Rene Thomas qualitative modeling framework to comprehend the signaling dynamics of HIF-1 and its interlinked proteins, including VEGF, ERK, AKT, GLUT-1, β-catenin, C-MYC, OGT, and p53 to elucidate the regulatory mechanistic of HIF-1 in cancer. Our dynamic model reveals that continuous activation of p53, β-catenin, and AKT in cyclic conditions, leads to oscillations representing homeostasis or a stable recovery state. Any deviation from this cycle results in a cancerous or pathogenic state. The model shows that overexpression of VEGF activates ERK and GLUT-1, leads to more aggressive tumor growth in a cancerous state. Moreover, it is observed that collective modulation of VEGF, ERK, and β-catenin is required for therapeutic intervention because these genes enhance the expression of GLUT-1 and play a significant role in cancer progression and angiogenesis. Additionally, SimBiology simulation unveils dynamic molecular interactions, emphasizing the need for targeted therapeutics to effectively regulate VEGF and ERK concentrations to modulate cancer cell proliferation.

Keywords: cellular myelocytomatosis oncogene (C-MYC); extracellular single regulated kinase (ERK); glucose transporter-1 (GLUT-1); hypoxia-inducible factor-1 (HIF-1); oglycosylation transferase (OGT); vascular endothelial growth factor (VEGF).


Conflict of interest statement

The authors declare that the research was conducted in the absence of any commercial or financial relationships that could be construed as a potential conflict of interest.

Figures

FIGURE 1
FIGURE 1
This workflow demonstrates the comprehensive research methodology employed in this study. Step 1: Represents the extraction of the knowledge driven HIF-1 signaling pathways from KEGG database and creating interaction graphs from experimental data to construct a BRN by using reduction rules. Step 2: Computation Tree Logic (CTL) formula is generated based on experimental data and parameters are assigned using SMBioNet, it uses NuSMV for model checking to verify the experimental observation in (Supplementary Material S1). Step 3: Shows the methodology steps for the dynamics simulation of the BRN using the GINSim tool, generating state graphs for the analysis of normal and pathogenic conditions. The resulting state graphs are visualized in Cytoscape, emphasizing the maximum betweenness centrality of states to analyze and identify crucial trajectories, cycles and deadlock states. Step 4: Represents the flow chart of concentration analysis of finally selected entities in SimBiology using Matlab.
FIGURE 2
FIGURE 2
Activating insulin growth factors and energy deprivation triggers the HIF signaling pathway. It is divided into three steps: (A) When insulin binds with the epidermal growth factor, it starts signal transduction through auto-phosphorylation. It phosphorylates the ongoing genes RKT, GRB2, IRS1 and PI3k, which converts PIP2 to PIP3, then phosphorylation of PDK1. Additionally, PDK1 phosphorylates mTORC2, which is involved in regulating actin cytoskeleton. On the other hand, GRB2 phosphorylates RAS and activates the MAPK signaling pathway, which starts the phosphorylation of AKT and ERK, directly involved in Angiogenesis through VEGF and HIF-1. Furthermore, AKT is a central pathway regulator that inhibits β-catenin, p53 and TSC1/2, which dephosphorylate RHEB and, through GTPase, activate mTORC1. (B) During the energy deficit condition, the AMP/ATP ratio is maintained through AMPK, which dephosphorylates the mTORC1 and is involved in the process of autophagy and activates HIFs. (C) In the nucleus, HIF-1 stabilizes, binds VHL/PHD HIF1-α and reaches the target gene with the help of P300, which acts as a coactivator. The HIF-1α/HIF-1β complex binds to the HRE region of the target gene, triggering the hypoxia response and activating various up-signaling genes, including VEGF and GLUT-1, and they activate associated genes.
FIGURE 3
FIGURE 3
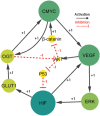
The HIF- one linked BRN reduces the signaling cascade highlighted in Figure 1. Particularly, the sign “+1”indicates a positive (activating) interaction, while the sign '-1′ indicates a negative (inhibiting) interaction.
FIGURE 4
FIGURE 4
The Heatmap generated from the logical parameters computed on SMBioNet reveals the presence of eight distinct parameter sets. Among these, a preferred set of parameters was determined via model checking, and the results are visually depicted in the form of a heatmap, accompanied by their respective resources labeled as M1 through M8. Each column in this heatmap represents a distinct set of logical parameters, with green denoting moderate expression, red denoting overexpression, and yellow denoting under expression of an entity.
FIGURE 5
FIGURE 5
The highest betweenness and centrality cycle is retrieved at the outermost layer. The top layer entities show arrows (red and green) representing a specific entity’s production and degradation. Furthermore, the neighboring entities of the pathogenic state (111,110,111) show continuous activation of HIF, GLUT-1, and OGT, whereas the neighboring entities of the normal state (000,001,000) show continual degradation of C-MYC and OGT.
FIGURE 6
FIGURE 6
(A) The subgraph depicts the entities starting from the state (101,111,001), showing blue and inducing step-by-step changes of the path that goes towards the normal or pathogenic state. Green entities show that the path goes towards the recovery state from different bifurcation points (pink color), and red indicates that the path goes towards the pathogenic state. Moreover, red circles show important critical trajectories at different points. (B) This path derived from the network shown in part (A), clearly illustrates the critical trajectories as they transition from the bifurcation point toward normal and pathogenic states.
FIGURE 7
FIGURE 7
(A) The subgraph depicts the same entities as Figure 6, starting from the state (101,111,001) showing blue and inducing step-by-step path changes towards the normal or pathogenic state. Green entities show that the path goes towards the recovery state from different bifurcation points (pink color), and red indicates that the path goes towards the pathogenic state. Moreover, red circles show important critical trajectories at different points. (B) This path extracted from the larger network as they transition from the bifurcation point toward normal and pathogenic states.
FIGURE 8
FIGURE 8
Simulation of the dynamic response of a cellular system: (A) It shows perturbations in p53, β-catenin, and AKT levels, with all other entities starting at zero concentration. (B) This graph shows the average value of VEGF, ERK, and HIF-1 over time. (C) It shows the initial high concentration of GLUT-1 and ERK, followed by a decrease in concentration in (D). This decrease in concentration inhibits the concentration of other entities, such as OGT, HIF-1, and C-MYC.

References

    1. Ahmad J., Niazi U., Mansoor S., Siddique U., Bibby J. (2012). Formal modeling and analysis of the MAL-associated biological regulatory network: insight into cerebral malaria. PLoS One 7 (3), e33532. 10.1371/JOURNAL.PONE.0033532 - DOI - PMC - PubMed
    1. Amann T., Maegdefrau U., Hartmann A., Agaimy A., Marienhagen J., Weiss T. S., et al. (2009). GLUT1 expression is increased in hepatocellular carcinoma and promotes tumorigenesis. Am. J. Pathol. 174 (4), 1544–1552. 10.2353/AJPATH.2009.080596 - DOI - PMC - PubMed
    1. Asano T., Yao Y., Zhu J., Li D., Oncogene J. A.- undefined (2004). The PI 3-kinase/Akt signaling pathway is activated due to aberrant Pten expression and targets transcription factors NF-kappaB and c-Myc in pancreatic cancer cells. Nat. Com. 23, 8571–8580. 10.1038/sj.onc.1207902 - DOI - PubMed
    1. Baltazar P., Chadha R., Mateus P. (2011). Quantum computation tree logic — model checking and complete calculus. Int. J. Quantum Inf. 6 (2), 219–236. 10.1142/S0219749908003530 - DOI
    1. Banf M., Rhee S. Y. (2017). Computational inference of gene regulatory networks: approaches, limitations and opportunities. Biochim. Biophys. Acta - Gene Regul. Mech. 1860 (1), 41–52. 10.1016/J.BBAGRM.2016.09.003 - DOI - PubMed

LinkOut - more resources