. 2024 Nov 13:15:1465448.
doi: 10.3389/fimmu.2024.1465448. eCollection 2024.

Longitudinal mitochondrial bioenergetic signatures of blood monocytes and lymphocytes improve during treatment of drug-susceptible pulmonary tuberculosis patients Monocyte/lymphocyte bioenergetic signatures post-TB treatment

Affiliations

Longitudinal mitochondrial bioenergetic signatures of blood monocytes and lymphocytes improve during treatment of drug-susceptible pulmonary tuberculosis patients Monocyte/lymphocyte bioenergetic signatures post-TB treatment

Bridgette M Cumming et al. Front Immunol. .

Erratum in

Abstract

The impact of human pulmonary tuberculosis (TB) on the bioenergetic metabolism of circulating immune cells remains elusive, as does the resolution of these effects with TB treatment. In this study, the rates of oxidative phosphorylation (OXPHOS) and glycolysis in circulating lymphocytes and monocytes of patients with drug-susceptible TB at diagnosis, 2 months, and 6 months during treatment, and 12 months after diagnosis were investigated using extracellular flux analysis. At diagnosis, the bioenergetic parameters of both blood lymphocytes and monocytes of TB patients were severely impaired in comparison to non-TB and non-HIV-infected controls. However, most bioenergetic parameters were not affected by HIV status or glycemic index. Treatment of TB patients restored the % spare respiratory capacity (%SRC) of the circulating lymphocytes to that observed in non-TB and non-HIV infected controls by 12 months. Treatment also improved the maximal respiration of circulating lymphocytes and the %SRC of circulating monocytes of the TB patients. Notably, the differential correlation of the clinical and bioenergetic parameters of the monocytes and lymphocytes from the controls and TB patients at baseline and month 12 was consistent with improved metabolic health and resolution of inflammation following successful TB treatment. Network analysis of the bioenergetic parameters of circulating immune cells with serum cytokine levels indicated a highly coordinated immune response at month 6. These findings underscore the importance of metabolic health in combating TB, supporting the need for further investigation of the bioenergetic immunometabolism associated with TB infection for novel therapeutic approaches aimed at bolstering cellular energetics to enhance immune responses and expedite recovery in TB patients.

Keywords: Seahorse XF96; TB treatment; bioenergetic metabolism; cytokines; lymphocytes; monocytes; tuberculosis.


Conflict of interest statement

The authors declare that the research was conducted in the absence of any commercial or financial relationships that could be construed as a potential conflict of interest.

Figures

Figure 1
Figure 1
Measurement of the bioenergetic parameters from the Cell Mito Stress Test profiles. (A) Flow diagram of the workflow for the processing of each blood sample. (B) Schematic representation of the electron transport chain and OXPHOS demonstrating targets of the compounds used in the Cell Mito Stress Test (CMST). (C) OCR profile showing measurement of respiratory bioenergetic parameters. (D) ECAR profile demonstrating measurement of ECAR bioenergetic parameters. (E, F) Representative (E) OCR profile and (F) ECAR profiles of a TB patient at baseline (Month 0), Month 2 and Month 6 following initiation of treatment. Anti-A, antimycin-A; FCCP, carbonyl cyanide-4-(trifluoromethoxy)phenylhydrazone; MACS, magnetic activated cell sorting; Non-mito, non-mitochondrial; Oligo, oligomycin; PBMC, peripheral blood mononuclear cells; Rot, rotenone; XF, extracellular flux.
Figure 2
Figure 2
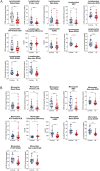
Baseline measurements of the bioenergetic parameters of the (A) lymphocytes and (B) monocytes of TB patients (n = 39) in comparison to those of asymptomatic HIV negative individuals (n = 32). TB patients and healthy controls were recruited from the same study site. Significant differences are observed in most of the bioenergetic parameters of both the monocytes and lymphocytes, with a few exceptions: %Spare Respiratory Capacity (%SRC) in the lymphocytes, and ATP-linked OCR in the monocytes. Comp, compensatory; Max, maximum; Non-mito, non-mitochondrial; Resp, respiration. *P<0.05; **P<0.01; ***P<0.001; ****P<0.0001; ns, not significant.
Figure 3
Figure 3
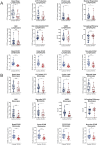
Baseline measurements of the bioenergetic parameters of the (A) lymphocytes and (B) monocytes of the asymptomatic HIV negative individuals (n = 30) and TB HIV-negative patients (n = 17). TB HIV-negative patients and asymptomatic HIV-negative individuals were recruited from the same study site. In the lymphocytes, significant differences are observed in basal respiration, proton leak, maximal respiration and ECAR parameters. In the monocytes, significant differences were observed in most of the bioenergetic parameters of both the monocytes, except for basal respiration and %Coupling Efficiency. Comp, compensatory; Max, maximum; Non-mito, non-mitochondrial; Resp, respiration. *P<0.05; **P<0.01; ***P<0.001; ****P<0.0001: ns, not significant.
Figure 4
Figure 4
Longitudinal measurement of the %SRC and maximal respiration of circulating immune cells of nine TB patients with data at all four timepoints during and after TB treatment. (A–C) Changes in %SRC (A) and Max Resp (B) of the circulating lymphocytes, and (C) %SRC of the monocytes of nine TB patients during and after treatment. Dotted line represents the median of non-TB infected, HIV-negative control levels. (D–F) Individual line plots of the %SRC (D) and Max Resp (E) of the circulating lymphocytes, and (F) %SRC of the monocytes, of each of the nine TB patients during and after treatment; individual comparisons of the %SRC at diagnosis (0 months) and 12 months (6 months after completion of TB treatment) are also shown. KW, Kruskal–Wallis statistic.
Figure 5
Figure 5
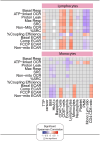
Correlation of the bioenergetic parameters with the clinical parameters. The heatmaps shows statistically significant correlations (p <0.05) between bioenergetic markers measured at baseline and clinical parameters. Each square represents a positive (red) or negative (blue) Spearman correlation, with the color varying according to correlation intensity. Gray square represents a not significant correlation. BMI, body mass index; cxrscor, chest X-Ray score; Mono, monocytes; Lym, lymphocytes; PMN, polymorphonuclear neutrophils; TTP, time to positivity.
Figure 6
Figure 6
Network analysis of the bioenergetic parameters of the monocytes and lymphocytes of controls and TB patients reveals distinct interactions. The network analysis (interactome) shows statistically significant correlations, p <0.05 between all the bioenergetic parameters of the circulating monocytes (mono) and lymphocytes (lympho) measured in control and TB patients at baseline and month 6. Each node represents a biomarker, and edges represent strong Spearman correlations between markers, defined as |rho| >0.6. Blue lines indicate negative correlations and red lines indicate positive correlations. Network density was established calculating the known number of connections by potential connections. Mono, monocytes; Lympho, lymphocytes.
Figure 7
Figure 7
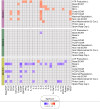
Bioenergetic markers are differently correlated with cytokines during anti-TB treatment. The heatmap shows statistically significant correlations (p <0.05) between bioenergetic and inflammatory markers measured across times. Each square represents a positive (red) or negative (blue) Spearman correlation, with the color varying according to correlation intensity. Gray square represents a non-significant correlation. L, lymphocyte.
Figure 8
Figure 8
Network analysis of the inflammatory profile and bioenergetic parameters of lymphocytes reveals distinct changes induced by anti-TB treatment. (A) The network analysis (interactome) shows statistically significant correlations, p <0.05) between all the parameters measured across times. Each node represents a parameter, and edges represent strong correlations between parameters, defined as |rho| >0.6. (B) Data of network densities were compared between the indicated timepoints using the permutation test (56). (C) Histogram shows the parameters in descending order of the number of connections, for each time point, for the top 15 most connected markers. (D) Number of connections by parameter and timepoint. The scale variates from blue (lower number of connections) to yellow (higher number of connections). L, lymphocytes.

References

    1. Cheng G, Zielonka J, McAllister D, Tsai S, Dwinell MB, Kalyanaraman B. Profiling and targeting of cellular bioenergetics: inhibition of pancreatic cancer cell proliferation. Br J Cancer. (2014) 111:85–93. doi: 10.1038/bjc.2014.272 - DOI - PMC - PubMed
    1. Ferreira FM, Palmeira CM, Seica R, Moreno AJ, Santos MS. Diabetes and mitochondrial bioenergetics: alterations with age. J Biochem Mol Toxicol. (2003) 17:214–22. doi: 10.1002/jbt.10081 - DOI - PubMed
    1. Moncada S, Bolanos JP. Nitric oxide, cell bioenergetics and neurodegeneration. J Neurochem. (2006) 97:1676–89. doi: 10.1111/j.1471-4159.2006.03988.x - DOI - PubMed
    1. Sansbury BE, Jones SP, Riggs DW, Darley-Usmar VM, Hill BG. Bioenergetic function in cardiovascular cells: the importance of the reserve capacity and its biological regulation. Chem Biol Interact. (2011) 191:288–95. doi: 10.1016/j.cbi.2010.12.002 - DOI - PMC - PubMed
    1. Xu W, Koeck T, Lara AR, Neumann D, DiFilippo FP, Koo M, et al. . Alterations of cellular bioenergetics in pulmonary artery endothelial cells. Proc Natl Acad Sci U.S.A. (2007) 104:1342–7. doi: 10.1073/pnas.0605080104 - DOI - PMC - PubMed

MeSH terms

Substances

LinkOut - more resources