. 2024 Oct 31:15:1394965.
doi: 10.3389/fimmu.2024.1394965. eCollection 2024.

Transcriptomics profiling of the non-small cell lung cancer microenvironment across disease stages reveals dual immune cell-type behaviors

Affiliations

Transcriptomics profiling of the non-small cell lung cancer microenvironment across disease stages reveals dual immune cell-type behaviors

Marcelo Hurtado et al. Front Immunol. .

Abstract

Background: Lung cancer is the leading cause of cancer death worldwide, with poor survival despite recent therapeutic advances. A better understanding of the complexity of the tumor microenvironment is needed to improve patients' outcome.

Methods: We applied a computational immunology approach (involving immune cell proportion estimation by deconvolution, transcription factor activity inference, pathways and immune scores estimations) in order to characterize bulk transcriptomics of 62 primary lung adenocarcinoma (LUAD) samples from patients across disease stages. Focusing specifically on early stage samples, we validated our findings using an independent LUAD cohort with 70 bulk RNAseq and 15 scRNAseq datasets and on TCGA datasets.

Results: Through our methodology and feature integration pipeline, we identified groups of immune cells related to disease stage as well as potential immune response or evasion and survival. More specifically, we reported a duality in the behavior of immune cells, notably natural killer (NK) cells, which was shown to be associated with survival and could be relevant for immune response or evasion. These distinct NK cell populations were further characterized using scRNAseq data, showing potential differences in their cytotoxic activity.

Conclusion: The dual profile of several immune cells, most notably T-cell populations, have been discussed in the context of diseases such as cancer. Here, we report the duality of NK cells which should be taken into account in conjunction with other immune cell populations and behaviors in predicting prognosis, immune response or evasion.

Keywords: cell deconvolution; immune landscape; lung adenocarcinoma; natural killer cells; transcription factor activity.


Conflict of interest statement

The authors declare that the research was conducted in the absence of any commercial or financial relationships that could be construed as a potential conflict of interest. The author(s) declared that they were an editorial board member of Frontiers, at the time of submission. This had no impact on the peer review process and the final decision.

Figures

Figure 1
Figure 1
An overview of the Lung Predict cohort. A description of the cohort is presented on the left with some summary graphics on the right specifically detailing tumor stages in male and female patients, RNAseq batches, presence of the most frequent somatic mutations as detected by a gene panel assay (STK11, EGFR, KRAS), smoking status, metastasis occurrence, age category, type of sample (primary or metastatic sample), location of the sample.
Figure 2
Figure 2
Overview of patient sample clustering based on immune deconvolution subgroups. Our immune deconvolution features after being processed identified three clusters of patients corresponding to “cold/intermediate”, “hot” and intermediate tumors. Heatmap showing patients within the 3 clusters identified by hierarchical clustering. The gray scale at the top corresponds to the stage of the disease: the darker the color, the later the stage. The orange to brown scale corresponds to the immune-scores (see Methods): the darker the color, the higher the immune scores.
Figure 3
Figure 3
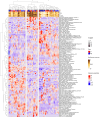
Annotation of the three patient clusters from ( Figure 2 ) using TFs module scores, pathways scores, and values of Boruta selected immune deconvolution features. (A) Three feature groups (in rows) are identified from the deconvolution features (values shown on scale red to blue from high to low). The panel also shows as column annotations of each sample the immuno-score (brown to white from high to low), the TF module scores (red to green from high to low, see composition of each module in ( Supplementary Table 4 ) and the pathway scores (yellow to blue from high to low). (B) Heatmap showing significant Pearson correlation between pathway activities and TF modules scores shown in panel A (denoted by the colors at the top of the columns: blue, cyan, yellow, brown, red, black, green, pink from left to right). Heatmap colors represent levels of correlation (darker red implies high positive correlation, darker blue implies high negative correlation). Statistics are shown as text only for significant correlations (p value < 0.05).
Figure 4
Figure 4
Overview of the deconvolution and TF activity integration pipeline. Immune cell deconvolution features and modules of TFs sharing inferred activity profiles are integrated together using a combination of clustering methods in order to reduce the dimensionality of the results (see Methods). The output are groups of immune cells characterized by the same TF activities.
Figure 5
Figure 5
Selected cell type group features reveal two profiles in the Lung Predict early stage cohort. (A) Hierarchical clustering dendrogram of early stage patient samples using the 14 cell type group scores. (B) Feature selection based on importance for predicting the two patient clusters in 5A using a Boruta algorithm, showing confirmed features (green) and rejected features (red) after 100 repeats (see Methods). (C) Heatmap showing the 10 cell groups selected after feature selection. The panel also shows as column annotations of each sample the immuno-score (brown to white from high to low), the TF module scores (red to green from high to low, see composition of each module in Supplementary Table 5 ) and the pathway scores (yellow to blue from high to low). (D) Contribution of cell type groups to the PCA variation in the classification of patient clusters.
Figure 6
Figure 6
Selected cell type groups features found in LP cohort projected in early stage samples of validation cohort. (A) Dendrogram obtained by hierarchical clustering revealed two groups of patients based on the cell type groups values. (B) Cell type groups feature contribution to the PCA variation in the classification of patient clusters. (C) Early stage patient samples from the validation cohort are divided in two main clusters based on the values of the selected cell type groups from LP analysis.
Figure 7
Figure 7
Supervised analysis of the patient groups identified in Figure 6A . (A) Volcano plot summarizing the 665 differentially expressed genes (DEGs) (padj < 0.05, abs(log2FoldChange) > 1) identified by comparing the green and red clusters from Figure 6A (B) Top results from the KEGG pathway enrichment analysis (p value < 0.01) on the DEGs summarized in the volcano plot. (C) Network plot of immunological pathways showing the genes involved in each pathway and overlapping among pathways. Node colors communicate the log2FoldChange of the genes between the two patient groups.
Figure 8
Figure 8
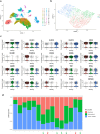
Single-cell RNAseq characterization of natural killer (NK)-cell clusters in LUAD samples from the Vanderbilt cohort. (A) Graph-based UMAP clustering. (B) UMAP of cluster 8 identified as NK cells after automatic annotation showing the 3 NK subclusters. (C) Characterization of the three NK subclusters using several cell surface markers. (D) Proportions of each NK cluster, labeled according to the marker analysis. The numbers at the bottom correspond to the patient cluster to which the corresponding bulk RNAseq sample belongs (Cluster 1= green, Cluster 2 = red) according to ( Figure 6A) .
Figure 9
Figure 9
Reference-based deconvolution of primary cohort using BayesPrism method. (A) Deconvolution proportions from early stage samples from the LungPredict cohort. NK cells are subdivided into the three subgroups considered above: dysfunctional, peripheral and tissue resident. (B) NK subtypes proportions in early stage samples using the cell-type annotations from the scRNAseq object of the validation cohort.
Figure 10
Figure 10
Multivariate cox proportional hazards (Cox PH) models were developed across all selected 10 cell type groups ( Figure 5B ). (A) Survival curves based on high and low risk groups using linear predictors after fitting Cox PH model using as covariates cell type groups corresponding to Dendrogram_red_turquoise_black_brown.group_3, Dendrogram_red_turquoise_black_brown.group_9 and Dendrogram_red_turquoise_black_brown.group_combined_1 (p value = 0.007). (B) Survival curves based on high and low risk groups using linear predictors after fitting Cox PH model using as covariates cell type groups corresponding to Dendrogram_red_turquoise_black_brown.group_3, Dendrogram_yellow_blue_green.group_2 and Dendrogram_yellow_blue_green.group_3 (p value = 0.0068).
Figure 11
Figure 11
TCGA analysis using selected cell type groups from Figure 9A . (A) Heatmap showing cell type groups scores after projection using the computed deconvolution and the inferred TF activity. (B)Samples dendrogram using hierarchical clustering based on the cell type groups scores (C). Dotplot showing KEGG pathways (p value < 0.05) related to the enrichment of DEG (padj < 0.05, abs(log2FoldChange) > 1) after comparison between patient Cluster 1 and 3 (red and blue in panel B, respectively).
Figure 12
Figure 12
Survival curves corresponding to the analysis done for TCGA-LUAD (393 early stage patients). (A) Survival curves showed a significant difference (p value = 0.0063) of survival using formula 1 (Surv(time, status) ~ dendrogram_red_turquoise_black_brown.group_3) when comparing high-risk patients (yellow) and low-risk (blue) patients defined based on the risk scores. (B) Survival curves showed a significant difference (p value = 0.0027) of survival using formula 2 (Surv(time, status) ~ dendrogram_red_turquoise_black_brown.group_4) when comparing high-risk patients (yellow) and low-risk (blue) patients defined based on the risk scores.
Figure 13
Figure 13
TF module characterisation based on association with grouped deconvolution features in early stage Lung Predict samples. The heatmap shows Pearson correlation between TF module scores and deconvolution features, highlighting cancer-related features. Colors represent levels of correlation (darker red implies high positive correlation, darker blue implies high negative correlation). Statistics are shown only for significantly correlated pairs (p value < 0.05).

References

    1. Mazieres J, Drilon A, Lusque A, Mhanna L, Cortot A, Mezquita L, et al. . Immune check- point inhibitors for patients with advanced lung cancer and oncogenic driver alterations: results from the IMMUNOTARGET registry. Ann Oncol. (2019) 30:1321–8. doi: 10.1093/annonc/mdz167 - DOI - PMC - PubMed
    1. Zhang C, Zhang Z, Zhang G, Zhang Z, Luo Y, Wang F, et al. . Clinical significance and inflammatory landscapes of a novel recurrence-associated immune signature in early-stage lung adenocarcinoma. Cancer Lett. (2020) 479:31–41. doi: 10.1016/j.canlet.2020.03.016 - DOI - PubMed
    1. Sturm G, Finotello F, Petitprez F, Zhang JD, Baumbach J, Fridman WH, et al. . Comprehensive evaluation of transcriptome-based cell-type quantification methods for immuno-oncology. Bioinformatics. (2019) 35:i436–45. doi: 10.1093/bioinformatics/btz363 - DOI - PMC - PubMed
    1. Avila Cobos F, Alquicira-Hernandez J, Powell JE, Powell JE, Mestdagh P, Preter De K. Benchmarking of cell type deconvolution pipelines for transcriptomics data. Nat Commun. (2020) 11:5650. doi: 10.1038/s41467-020-19015-1 - DOI - PMC - PubMed
    1. Merotto L, Zopoglou M, Zackl C, Finotello F. Next-generation deconvolution of transcriptomic data to investigate the tumor microenvironment. In: International review of cell and molecular biology. Academic Press; (2023). - PubMed

MeSH terms