[Preprint]. 2024 Nov 15:2024.11.03.24316599.
doi: 10.1101/2024.11.03.24316599.

Integrative multi-omics profiling of colorectal cancer from a Hispanic/Latino cohort of patients

Affiliations

Integrative multi-omics profiling of colorectal cancer from a Hispanic/Latino cohort of patients

B Waldrup et al. medRxiv. .

Abstract

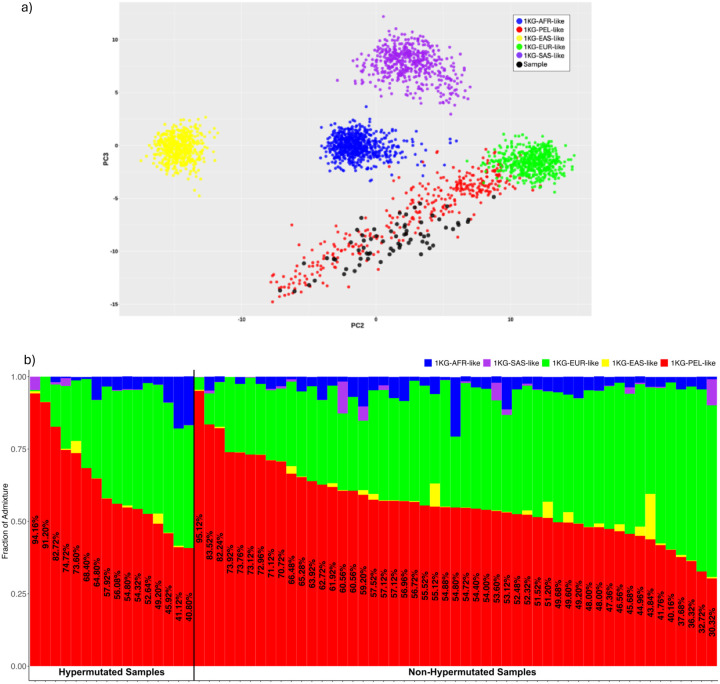
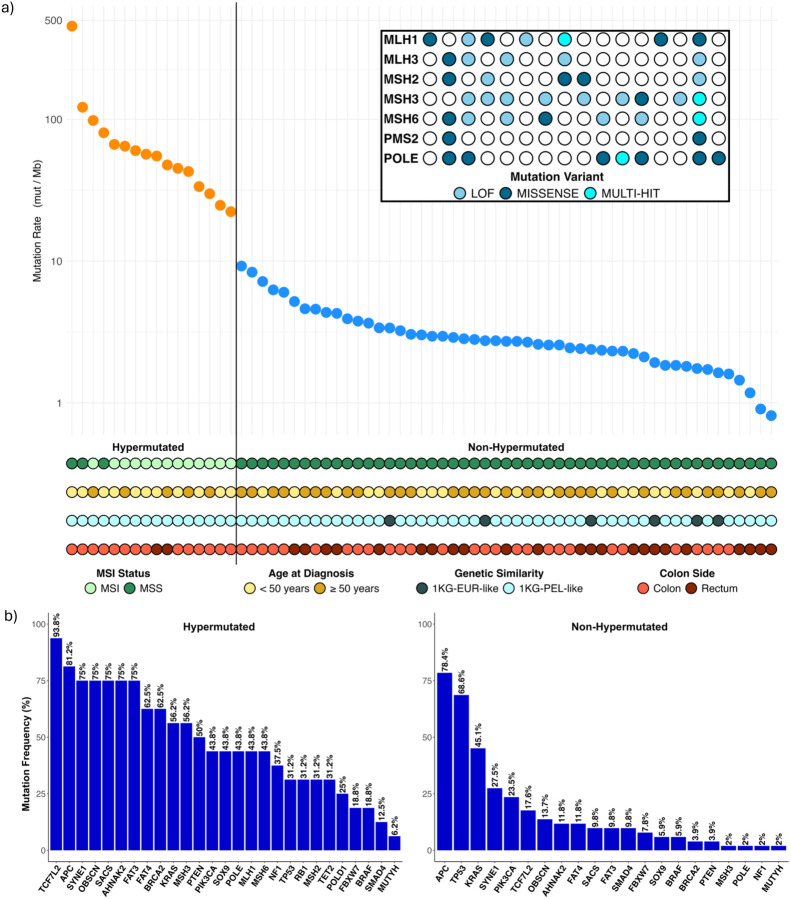
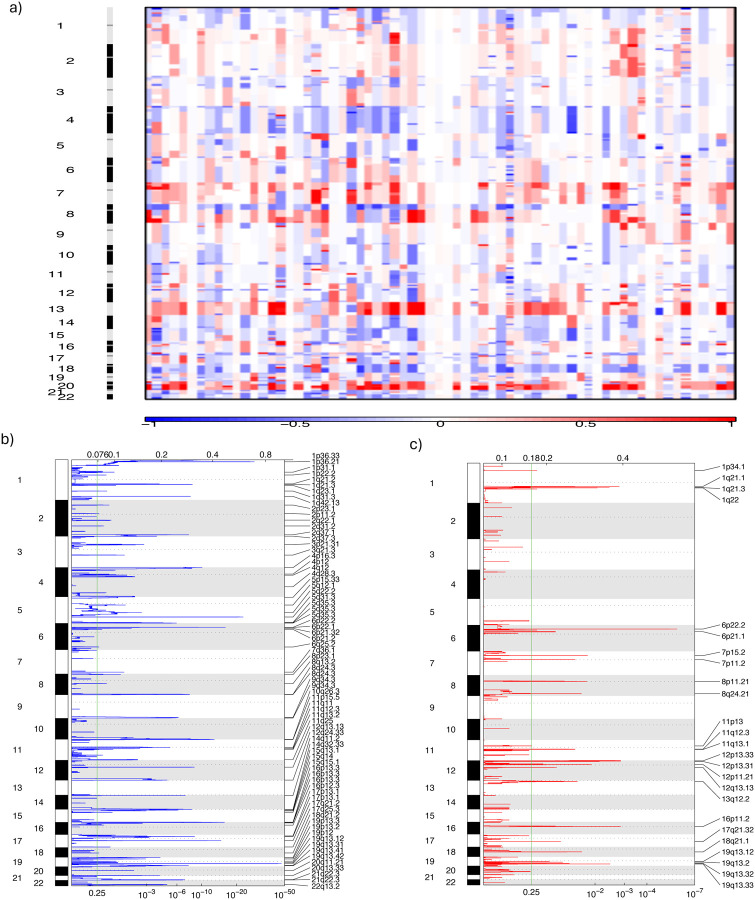
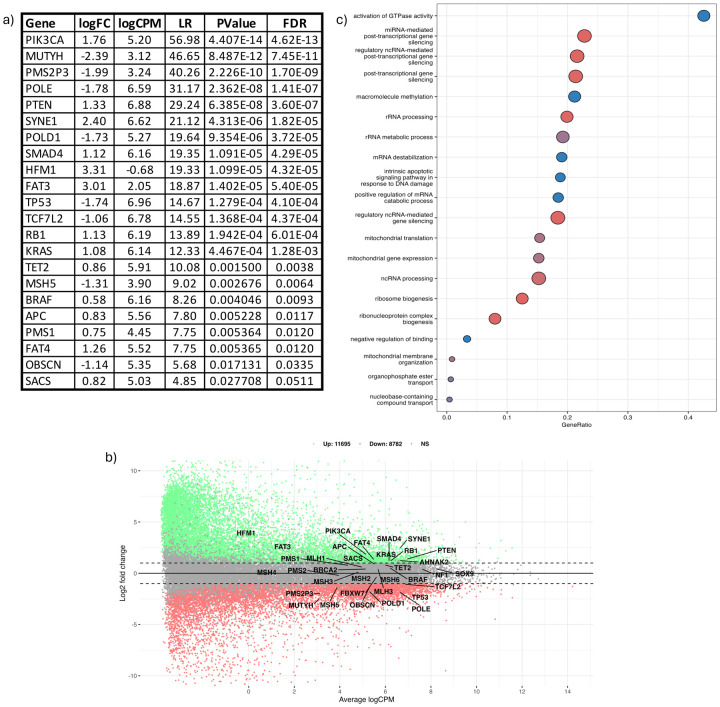
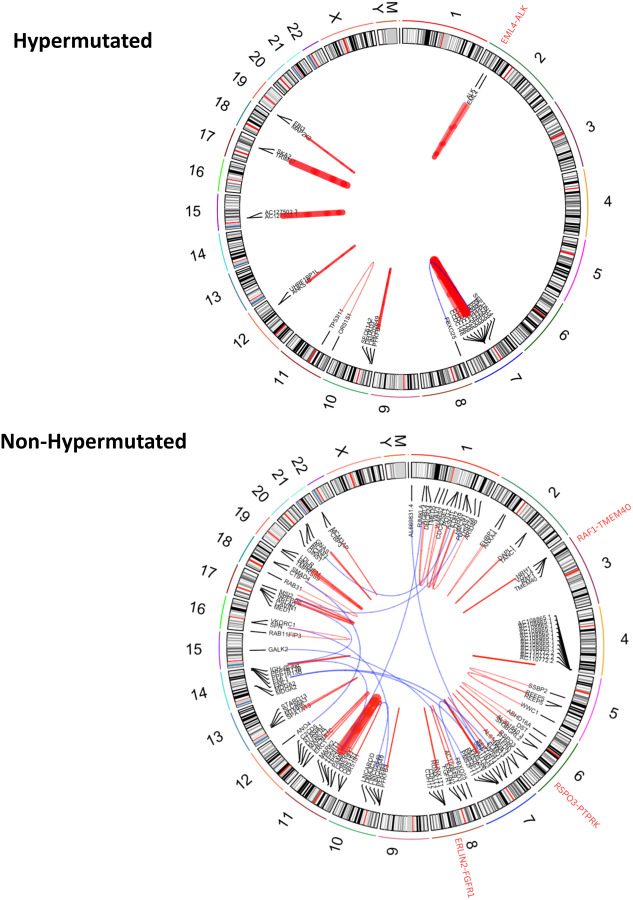
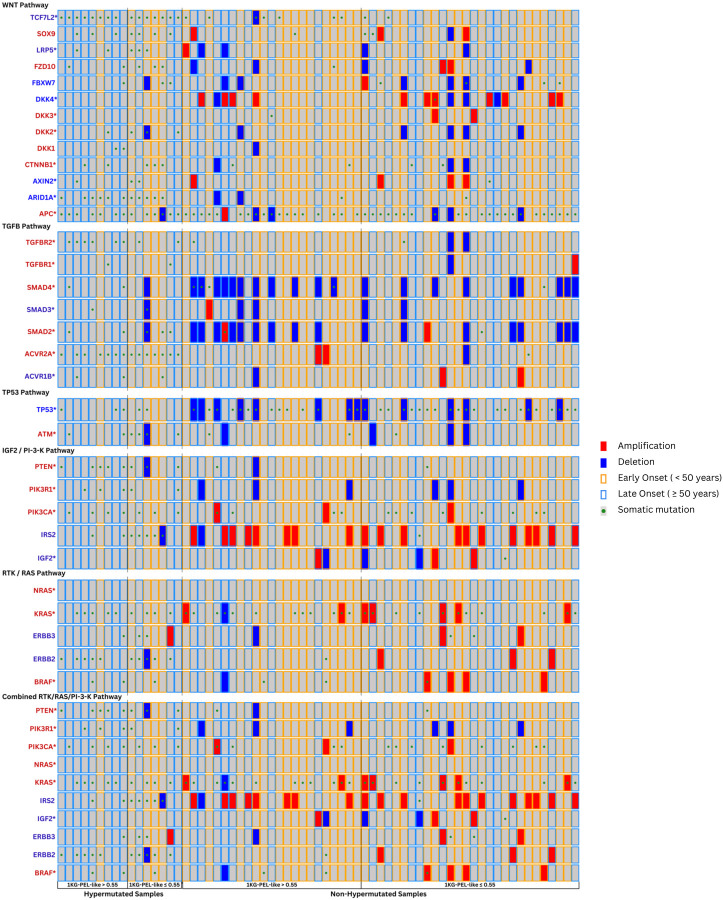
Colorectal cancer contributes to cancer-related deaths and health disparities in the Hispanic and Latino community. To probe both the biological and genetic bases of the disparities, we characterized features of colorectal cancer in terms of somatic alterations and genetic similarity. Specifically, we conducted a comprehensive genome-scale analysis of 67 Hispanic and Latino samples. We performed DNA exome sequencing for somatic mutations, somatic copy number alterations, and genetic similarity. We also performed RNA sequencing for differential gene expression, cellular pathways, and gene fusions. We analyzed all samples for 22 important CRC gene mutations, 8 gene amplifications, and 25 CRC gene fusions. Then, we compared our data from the Hispanic and Latino samples to publicly available, Non-Hispanic White (NHW) cohorts. According to our analyses, twenty-four percent of colorectal carcinomas were hypermutated when patients were of Peruvians-from-Lima-like (1KG-PEL-like) genetic similarity population from the 1000 genome project. Moreover, most of these cases occurred in patients who were less than fiay years old age at diagnosis. Excluding hypermutated tumors, approximately 55% of colon cancers and 58% of rectum cancers exhibited two similar features: 1) the paderns of genomic alterations; 2) percentage of 1KG-PEL-like. We analyzed all samples -- which had a median 1KG-PEL-like proportion of 55% -- for 22 important CRC gene mutations, 8 gene amplifications, and 25 CRC gene fusions. One notable example of a frequently observed gene mutation was SMAD4. Samples with SMAD4 alterations, which are known to support tumor growth and progression, had the highest 1KG-PEL-like proportion (63%). According to our results from risk association analyses and differential gene expression, SMAD4 alterations were significant when we compared Hispanic and Latino samples to NHW cohorts. Of the 8 drug-targetable amplifications, PIK3CA and PI3K exhibited an average 1KG-PEL-like of over 55%. Of the 25 relevant CRC gene fusions, targetable genes included ALK, FGFR1, RAF1, and PTPRK; PTPRK was observed in a sample with the highest 1KG-PEL-like proportion (95%). Using Integrative analysis, we also detected recurrent alterations in the WNT, TGFB, TP53, IGF2/PI3K, and RTK/RAS pathways. Importantly, these alterations mostly occurred in young patients with high 1KG-PEL-like. These findings highlight the potential for tailoring precision medicine therapeutics to an underrepresented population. Our study advances the molecular profiling of CRC in Hispanics and Latinos. In toto, genetic similarity appears to be an important component in understanding colorectal carcinogenesis and has the potential to advance cancer health disparities research.


Figures

Figure 1:
Figure 1:. Genetic Similarity and Chromosome-Level Patterns.
a) Genetic similarity principal component analysis (PCA) plot. This PCA plot illustrates the genetic similarity of our Hispanic/Latino colorectal cancer cohort of 67 individuals, represented by black points, in the context of five super populations: 1000 Genomes Project African-like (1KG-AFR-like, blue), 1000 Genomes Project Peruvian-in-Lima-like (1KG-PEL-like, red), 1000 Genomes Project East-Asian-like (1KG-EAS-like, yellow), 1000 Genomes Project European-like (1KG-EUR-like, green), and 1000 Genomes Project South-Asian-like (1KG-SAS-like, purple). The plot displays the distribution of these samples along two principal components, PC2 and PC3, which capture the majority of the variance in the genetic data. This visualization helps to contextualize the genetic similarity composition of our cohort relative to these major global populations. b) This figure illustrates the frequencies in each tumor sample from a cohort of 67 Hispanic/Latino (H/L) colorectal cancer (CRC) patients. The genomes are categorized into five super populations, same as section a.Samples are stratified into hypermutated and non-hypermutated groups, with the proportion of 1KG-PEL-like similarity included.
Figure 2:
Figure 2:. Mutation Frequencies in CRC Tumors from H/L Patients.
a) This panel shows the mutation frequencies in each of the tumor samples from 67 Hispanic/Latino colorectal cancer patients. The samples are categorized as hypermutated or non -hypermutated. The color codes represent diLerent attributes: light green for MSI, dark green for MSS, light yellow for age at diagnosis < 50 years, brown for age at diagnosis > 50 years, light blue for highest 1KGPEL-like similarity proportions, dark blue for highest 1KG-EUR-like similarity proportions, light red for colon tumors, and dark red for rectum tumors. The inset highlights mutations in mismatch-repair genes and POLE among the hypermutated samples, with the sample order consistent with the main graph. b) This panel depicts the significantly mutated genes in hypermutated and non-hypermutated tumors.
Figure 3:
Figure 3:. Somatic Copy Number Alterations (SCNAs) Analysis of Genomic Changes in 67 Hispanic/Latino Colorectal Cancer Patients.
a) Heatmap of SCNAs: This panel displays SCNAs at both chromosomal and sub-chromosomal levels across 67 tumor samples from Hispanic/Latino colorectal cancer patients. Deletions (losses) are indicated in blue, while insertions (gains) are shown in red. b) Focal Deletions: This figure highlights the focal deletions identified across all 67 tumor samples. c) Focal Amplifications: This figure presents the focal amplifications observed in the same set of tumor samples.
Figure 4:
Figure 4:. Differential gene expression (DGE) analysis among CRC tumors from 67 Hispanic/Latino patients and 67 Non-Hispanic White patients.
DGE analysis identified unique gene expression patterns in our Hispanic/Latino (H/L) CRC cohort compared to Non-Hispanic White (NHW) CRC cases. The NHW cases were individually matched to our CRC cohort using demographic, clinical, and genomic data from two publicly available databases: TCGA-COAD and TCGA-READ. a) Differentially expressed CRC-related genes: This table shows the genes that are differentially expressed when comparing H/L and NHW CRC cases. b) Mean-Average (MA) plot: This scatter plot shows the upregulated and downregulated CRC-related genes according to the log2 fold change. c) Pathway analysis: This graph presents the distinct cellular pathways identified through pathway analysis by comparing H/L and NHW CRC cases. The graph displays the names of the pathways, adjusted p-values, and the number of genes altered in each pathway.
Figure 5:
Figure 5:. Gene Fusion Analysis stratified by Tumor Mutational Burden (TMB) in CRC Tumors from 67 Hispanic/Latino Patients.
This circle plot illustrates the gene fusions detected across all samples from our Hispanic/Latino (H/L) colorectal cancer (CRC) cohort, stratified by hypermutated and non-hypermutated tumors. Clinically actionable gene fusions are highlighted in red, providing insights into potential therapeutic targets for this patient population.
Figure 6:
Figure 6:. Integrative Genomic Alteration Patterns in Selected Pathways Among CRC Tumors from 67 Hispanic/Latino Patients.
This grid represents integrative genomic alteration patterns in the WNT, TGFB, TP53, IGF2/PI3K, RTK/RAS, and combined RTK/RAS/PI3K pathways among colorectal cancer (CRC) tumors from 67 Hispanic/Latino patients. Each column corresponds to an individual case, and each row represents a gene. The grid is divided into hypermutated and non-hypermutated samples, further subdivided by high (>55%) or low (≤55%) 1KG-PEL like similarity proportion. The color codes represent diLerent attributes: red for amplifications, blue for deletions, a yellow border for early onset (<50 years), a blue border for late onset (≥50 years), and a green dot for somatic mutations.

References

    1. Sung H, Ferlay J, Siegel RL, Laversanne M, Soerjomataram I, Jemal A, Bray F. Global Cancer Statistics 2020: GLOBOCAN Estimates of Incidence and Mortality Worldwide for 36 Cancers in 185 Countries. CA Cancer J Clin. 2021. May;71(3):209–249. doi: 10.3322/caac.21660. Epub 2021 Feb 4. - DOI - PubMed
    1. Keum N, Giovannucci E. Global burden of colorectal cancer: emerging trends, risk factors and prevention strategies. Nat Rev Gastroenterol Hepatol. 2019. Dec;16(12):713–732. doi: 10.1038/s41575-019-0189-8. Epub 2019 Aug 27. - DOI - PubMed
    1. World Health Organization (2024), International Agency for Research on Cancer. Global Cancer Observatory: Cancer Today. [Accessed on July 04, 2024. Available at: https://gco.iarc.who.int/media/globocan/factsheets/cancers/8-colon-fact-... and https://gco.iarc.who.int/media/globocan/factsheets/cancers/9-rectum-fact...]
    1. Siegel RL, Miller KD, Jemal A. Cancer statistics, 2020. CA Cancer J Clin. 2020;70(1):7–30. - PubMed
    1. Siegel RL, Miller KD, Jemal A. Cancer statistics, 2018. CA Cancer J Clin. 2018; 68:7–30. 10.3322/caac.21442. - DOI - PubMed

Publication types