[Preprint]. 2024 Nov 22:2024.11.20.24317557.
doi: 10.1101/2024.11.20.24317557.

Molecular convergence of risk variants for congenital heart defects leveraging a regulatory map of the human fetal heart

Affiliations

Molecular convergence of risk variants for congenital heart defects leveraging a regulatory map of the human fetal heart

X Rosa Ma et al. medRxiv. .

Abstract

Congenital heart defects (CHD) arise in part due to inherited genetic variants that alter genes and noncoding regulatory elements in the human genome. These variants are thought to act during fetal development to influence the formation of different heart structures. However, identifying the genes, pathways, and cell types that mediate these effects has been challenging due to the immense diversity of cell types involved in heart development as well as the superimposed complexities of interpreting noncoding sequences. As such, understanding the molecular functions of both noncoding and coding variants remains paramount to our fundamental understanding of cardiac development and CHD. Here, we created a gene regulation map of the healthy human fetal heart across developmental time, and applied it to interpret the functions of variants associated with CHD and quantitative cardiac traits. We collected single-cell multiomic data from 734,000 single cells sampled from 41 fetal hearts spanning post-conception weeks 6 to 22, enabling the construction of gene regulation maps in 90 cardiac cell types and states, including rare populations of cardiac conduction cells. Through an unbiased analysis of all 90 cell types, we find that both rare coding variants associated with CHD and common noncoding variants associated with valve traits converge to affect valvular interstitial cells (VICs). VICs are enriched for high expression of known CHD genes previously identified through mapping of rare coding variants. Eight CHD genes, as well as other genes in similar molecular pathways, are linked to common noncoding variants associated with other valve diseases or traits via enhancers in VICs. In addition, certain common noncoding variants impact enhancers with activities highly specific to particular subanatomic structures in the heart, illuminating how such variants can impact specific aspects of heart structure and function. Together, these results implicate new enhancers, genes, and cell types in the genetic etiology of CHD, identify molecular convergence of common noncoding and rare coding variants on VICs, and suggest a more expansive view of the cell types instrumental in genetic risk for CHD, beyond the working cardiomyocyte. This regulatory map of the human fetal heart will provide a foundational resource for understanding cardiac development, interpreting genetic variants associated with heart disease, and discovering targets for cell-type specific therapies.


Conflict of interest statement

Conflict of Interest Statement J.M.E. has received materials from 10x Genomics unrelated to this study.

Figures

Figure 1.
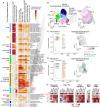
Figure 1.. A gene regulation map of the human fetal heart.
A. Single-cell multiomic data (10x Multiome) was collected from 41 hearts spanning post-conception weeks 6 to 22. B. Multiome data was used to create a gene regulation map, linking genetic variants to regulatory elements (enhancers), their target genes, and associated gene programs in each of 90 cell types with sufficient depth. The schematic illustrates the components of this map and how it can be used to interpret the molecular and cellular functions of coding (purple) and noncoding (orange) variants associated with disease. The middle panel shows cell-type-specific enhancer-gene interactions: arrows represent genes, with highlighted arrows indicating expression in a particular cell type; circles represent predicted enhancers, with size indicating activity level, and arcs show predicted enhancer-gene interactions. Coding variants can be annotated based on the cell types in which the gene is expressed (purple). Noncoding variants can be annotated based on the cell types in which the enhancer is active, and the target gene(s) of that enhancer (orange). Right panel depicts gene programs, which are defined as sets of genes that are co-expressed across single cells that are likely to have related functions. Both coding and noncoding variants can be annotated based on how their target genes work together in gene programs (colored genes). C. Uniform manifold approximation and projection (UMAP) embedding of scRNA-seq of all major cell types. ACM: Atrial cardiomyocytes. VCM: ventricular cardiomyocytes. Tz: transitional. D. UMAP embedding of subset of scRNA-seq data from endothelial cells. E. Dot plot showing the expression of marker genes of endothelial cell types. The size of the circle represents the percentage of cells within a given cell type that express the gene of interest, and the color represents the normalized expression level of that gene across all cell types shown. F. Global similarity of predicted enhancers across major cell types. Color scale: Percentage of enhancer overlap between pairs of major cell types, with the total number of enhancers in the major cell type on the y-axis as the denominator (see Methods). Core cond. cells: core conduction cells. Tz cond. cells: transitional conduction cells. G. Global similarity of predicted enhancers across endothelial cell types. Color scale: Percentage of enhancer overlap, as in F. H. Example locus: MEF2A is regulated by distinct combinations of enhancers in endothelial cells, VICs, and VCMs. Signal tracks: pseudobulk scATAC-seq within each cell type. Red arcs: Elements predicted by scE2G to act as enhancers to regulate MEF2A. Gray arcs: Elements predicted to regulate other genes. Coordinates (hg38) of highlighted enhancers: chr15:99425061–99426373 (left), chr15:99454858–99455373 (right). I. Compendium of TF motifs and predicted effects on chromatin accessibility across 90 cell types, as learned by ChromBPNet and TF-MoDISCO. Color scale: Z-score normalized effects of predicted motifs learned as average differences in predicted accessibility into 100 random sequences in each cell type. Core cond. cells: core conduction cells. Tz cond. cells: transitional conduction cells. J. Predicted occurrences of selected TF motifs in cell types relevant to MEF2A enhancers (see panel K). Color scale: motif occurrences in the corresponding cell type. K. ChromBPNet contribution scores highlight TF motif instances with cell-type-specific contributions to chromatin accessibility at two selected enhancers for MEF2A. Height of each nucleotide in the genomic sequence represents the predicted importance of that nucleotide to chromatin accessibility (by DeepLIFT). Coordinates (hg38) of the two example regions: chr15: 99425308–99425388 (left), chr15:99455071–99455122 (right). L. Expression patterns of 253 gene programs across cell types. Gene programs were inferred using cNMF in groups of related cell types. Color scale: average gene program usage per cell type. M. Average expression of endothelial cell programs in each of the fine-grained endothelial cell types. N. Projection of Endothelial program 23 expression onto the endothelial cell UMAP. Color scale: gene program usage per cell. O. Feature plots illustrating the expression of known arteriolar endothelial marker genes identified in Endothelial program 23 and the expression of predicted TF regulators of Endothelial program 23. Color scale: normalized gene expression level.
Figure 2.
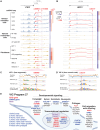
Figure 2.. Regulatory wiring and neural adhesion molecules in cardiac conduction cells
A. Schematic and UMAP representations of cell types in the cardiac conduction system (CCS). SAN: Sinoatrial node. AVN: Atrioventricular node. PF: Purkinje fibers. B. Dot plot of known marker genes for major cell types in the CCS. The size of the circle represents the percentage of cells within a given cell type that express the gene of interest, and the color represents the normalized expression level of that gene across all cell types shown. C. Feature plots showing the expression of marker genes. Color scale: normalized gene expression level. D. Percentage of enhancer overlap between the cell types on the y-axis and cell types on the x-axis. Includes 5 cell types in the CCS and a population of capillary endothelial cells as an outgroup for comparison. Color scale: Percentage of enhancer overlap between pairs of cell types, with the total number of enhancers in the cell type on the y-axis as the denominator (see Methods). E. scE2G predictions and normalized ATAC-seq signals for ISL1. Predicted enhancers and the ISL1 promoter are highlighted in shaded regions. Arcs represent the predicted enhancer-gene regulatory interactions. Side color bars show the transcripts per million (TPM) expression of the target genes in each cell type (blue) and the corresponding scE2G scores (red, and white for scores below the threshold). F. Per-base DeepLIFT contribution score profiles of two selected regulatory regions from subpanel E. Gray highlights indicate predicted TF motif instances, including for GATA, NF-Y, and TBX family TFs. Note that GATA motif instances have higher predicted contribution scores in SAN. The left panel shows a subregion of the ISL1 promoter (chr5:51,383,321–51,383,428). The right panel shows a subregion of an enhancer regulating ISL1 (chr5:51,475,542–51,475,802). All coordinates in hg38. G. Representative enriched gene ontology (GO) terms in gene programs characterizing the CCS cell types, showing enrichment for genes related to axon development across all CCS cell types. H. I. J. Feature plot showing the expression of selected neural adhesion ligands or receptors in the CCS. K. L. M. Predicted cell-cell interactions between CCS components and surrounding cell types. Nodes represent cell types, with CCS components highlighted in bold text and colored according to A. Arrows point from ligand-producing cells to receptor-expressing cells. Arrow color intensity reflects the interaction strength.
Figure 3:
Figure 3:. Congenital Heart Disease (CHD) Genes are enriched in cardiac fibroblast cells.
A. Enrichment for cardiovascular disease and CHD causal genes in cardiac cell types of the fetal heart map. Color scale: −Log10-transformed p-values. One-sided fisher exact test with Benjamini-Hochberg correction (*FDR < 0.05, **FDR < 0.01, ***FDR < 0.001). # High-confidence genes: the number of CHD genes expressed in any cell type in the heatmap (TPM>1). B. UMAP embedding of scRNA-seq of all fibroblast cells and UMAP embedding of scRNA-seq of VICs. DMP: dorsal mesenchymal protrusion; OFT: outflow tract. C. Ranked importance scores of genes associated with VIC program 27; The top 300 genes by importance scores in VIC program 27 were considered as program genes. Black: Top 5 genes associated with VIC program 27; Orange: high-confidence CHD genes from CHDgene in the top 300 genes; Blue: CHD genes carrying two or more de novo variants identified in the PCGC cohort. TBX5 is both a high-confidence CHD gene and a gene carrying two or more de novo variants. Inset: Projection of VIC program 27 expression on the VIC UMAP, showing expression in VIC_4 and other VIC populations. Color scale: gene program usage per cell. D. Ranked importance scores of genes associated with FB program 6. Labels denote selected program genes (among the 300 by importance score, see Methods). Black: Top 5 genes associated with FB program 6. Orange: high-confidence CHD genes from CHDgene. Blue: CHD genes carrying two or more de novo variants identified in the PCGC cohort. Inset: Projection of FB program 6 expression on the fibroblast UMAP, showing high expression in cardiac fibroblast progenitors and some cell cycling fibroblasts. E. Z-score normalized TPM values of 27 CHD genes highly expressed in VICs and/or cardiac fibroblast progenitors (CFB). Bold genes (MEIS2 and LTBP2) are discussed in the text. *: the gene is considered to be highly expressed in the corresponding cell types (see Methods).
Figure 4:
Figure 4:. Convergence of rare and common variants on VIC pathways
A,B. scE2G predictions and normalized ATAC-seq signals are shown for LTBP2 (A) and LMCD1 (B), showing that GWAS variants associated with valve diseases or traits (red downward arrows) overlap enhancers linked to these genes in VICs. Enhancer predictions overlapping variants are highlighted in red. Arcs represent the predicted enhancer-gene regulatory interactions. Side color bars show the TPM expression of the target genes in each cell type (blue) and the corresponding scE2G scores (red; white for scores below the threshold). CFB: cardiac fibroblasts. The hg38 coordinates of the highlighted enhancer regions are as follows: LTBP2 Enh 1: chr14:74621382–74622571; LTBP2 Enh 2: chr14:74630908–74631785; LMCD1: chr3:8560989–8562461. C,D. For selected variants, predicted impact on chromatin accessibility by ChromBPNet. Top: Predicted ATAC-seq counts for the reference (blue) and alternative (orange) alleles. Middle: Importance scores from ChromBPNet in VIC_1 (free segments) and VIC_4 (VICs derived from neural crest). Bottom: Motif from TF-MoDiSCO predicted to be altered by the variant. The alternative allele at rs989909 (G) creates a motif for TAL as part of a GATA/TAL heterodimer, which is predicted to have a small impact on local chromatin accessibility, consistent with previous studies of TAL factors, and is expected to have a larger effect on enhancer activity. The alternative allele at rs165177 (C) creates an SP-like motif that is predicted to increase chromatin accessibility. E. Annotation of genes in VIC Program 27, which contains many CHD genes (red), genes linked to noncoding GWAS variants for valve or aortic traits (blue), or genes with both types of evidence (purple). Black genes represent other genes in VIC Program 27 with related functions.
Figure 5:
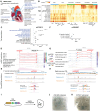
Figure 5:. Noncoding variants affect enhancers with cell type and spatially restricted activities
A. Selected GWASs of quantitative measurements of the heart (gray) and cardiac diseases (blue) included in this analysis. B. Heritability enrichment (S-LDSC) of quantitative measurements of the heart and cardiac diseases in scE2G predicted enhancers of each cell type. Representative cell types are shown. See also Table S12. C. Trait associations for rs6701619. Beta: Per unit change in the outcome associated with the alternative allele. The alternative allele increases the risk for aortic and aortic valve related diseases, and increases the quantitative measurement of aortic traits except for aortic valve area. D. rs6701619 overlaps an enhancer (hg38: chr1:99580436–99581202) predicted to regulate PALMD in valvular cells (red highlight and arcs). Signal tracks represent chromatin accessibility from ATAC-seq. Gray arcs represent other predicted enhancer-gene regulatory interactions in the locus. The side color bars show the TPM expression of PALMD in each cell type (blue), scE2G scores (red, and white for scores below the threshold), and ChromBPNet predicted log2 fold changes in chromatin accessibility upon substitution of the reference allele (T) with the alternative allele (G) (green indicates reduced accessibility, brown indicates increased accessibility). IF: inflow. E. ChromBPNet predictions for rs6702619 in (IF) inflow valvular endocardial cells. The alternative allele is predicted to lead to a decrease in chromatin accessibility across the element (top). Middle and bottom tracks show contribution scores for the reference and alternative alleles. Inset: NFATC1 motif learned de novo by TF-MoDISCO, and contribution scores for the reference and alternative alleles. F. Trait associations for rs35006907. Beta: Per unit change in the outcome associated with the alternative allele. The alternative allele increases LV ejection fraction, and decreases both the maximum LV volume and the minimum LV volume. G. rs35006907 overlaps an enhancer (hg38: chr8:124846865–124849334) predicted to regulate MTSS1 in VCMs (red highlight and arcs). Similar to E. H. ChromBPNet predictions for rs35006907 in right trabecular VCMs. The alternative allele is predicted to lead to a decrease in chromatin accessibility across the element (top). Middle and bottom tracks show contribution scores for the reference and alternative alleles. Inset: Motif learned de novo by TF-MoDISCO (similar to USF1 and MITF motifs), and contribution scores for the reference and alternative alleles. I. Schematics for the mouse transgenic assay. The predicted enhancer is cloned to drive the expression of LacZ. J. The enhancer overlapping rs6702619 is active in the outflow tract of the developing mouse heart at E11.5. K. The enhancer overlapping rs35006907 is active in the interventricular septum of the mouse heart at E11.5.

References

    1. Bruneau B. G. The developing heart: from The Wizard of Oz to congenital heart disease. Development 147, dev194233 (2020). - PMC - PubMed
    1. Morton S. U., Quiat D., Seidman J. G. & Seidman C. E. Genomic frontiers in congenital heart disease. Nat. Rev. Cardiol. 19, 26–42 (2022). - PMC - PubMed
    1. Buijtendijk M. F. J., Barnett P. & van den Hoff M. J. B. Development of the human heart. Am. J. Med. Genet. C Semin. Med. Genet. 184, 7–22 (2020). - PMC - PubMed
    1. Ameen M. et al. Integrative single-cell analysis of cardiogenesis identifies developmental trajectories and non-coding mutations in congenital heart disease. Cell 185, 4937–4953.e23 (2022). - PMC - PubMed
    1. Nees S. N. & Chung W. K. The genetics of isolated congenital heart disease. Am. J. Med. Genet. C Semin. Med. Genet. 184, 97–106 (2020). - PMC - PubMed

Publication types