

This is a preprint.
Neuroimaging Insights into Brain Mechanisms of Early-onset Restrictive Eating Disorders
- PMID: 39606373
- PMCID: PMC11601758
- DOI: 10.1101/2024.11.12.24317128
Neuroimaging Insights into Brain Mechanisms of Early-onset Restrictive Eating Disorders
Update in
-
Neuroimaging insights into brain mechanisms of early-onset restrictive eating disorders.Nat Ment Health. 2025;3(7):780-788. doi: 10.1038/s44220-025-00447-x. Epub 2025 Jun 24. Nat Ment Health. 2025. PMID: 40655158 Free PMC article.
Abstract
Background: Early-onset restrictive eating disorders (rEO-ED) encompass a heterogeneous group of conditions, including early-onset anorexia nervosa (EO-AN) and avoidant restrictive food intake disorders (ARFID). Almost nothing is known about the consequences of rEO-ED on brain development.
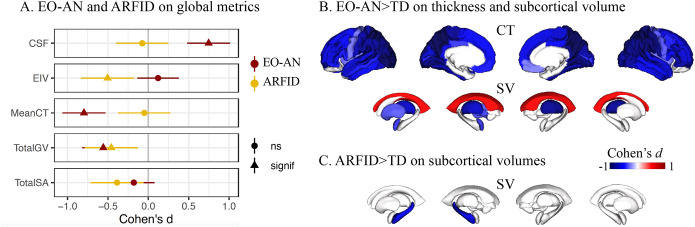
Methods: We performed the largest comparison of MRI-derived brain features in children and early adolescents (<13 years) with EO-AN (n=124), ARFID (n=50), and typically developing individuals (TD, n=112).
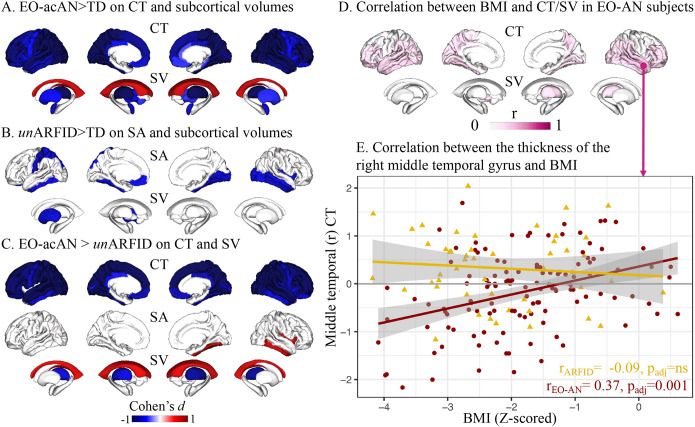
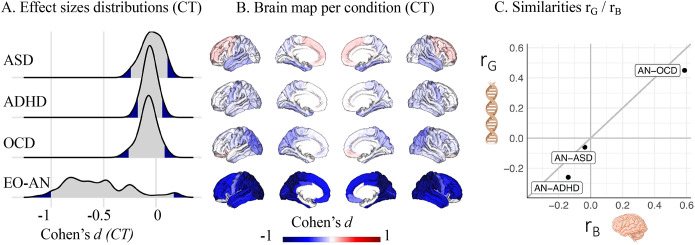
Results: Despite similar body mass index (BMI) distributions, EO-AN and ARFID showed divergent structural patterns, suggesting independent brain mechanisms. Half the regional brain measures were correlated with BMI in EO-AN and none in ARFID, indicating a partial mediation of EO-AN signal by BMI. EO-AN was associated with a widespread pattern of thinner cortex, while underweight ARFID patients exhibited smaller surface area and subcortical volumes than TD.
Conclusion: Future studies will be required to partition the contribution of low BMI vs. ED mechanisms in neurodevelopmental disorders.
Keywords: Avoidant restrictive food intake disorder; Body Mass Index; Cortical Thickness; Early-onset anorexia nervosa; Structural MRI; Transdiagnostic approaches.
Conflict of interest statement
Financial Disclosure CAM, AA, RB, AM, CS, PB, NT, LT, DG, MA, MEB, SE, TB, and RD reported no biomedical financial interests or potential conflicts of interest.
Figures
References
-
- Pinhas L. et al. Classification of childhood onset eating disorders: A latent class analysis. Int. J. Eat. Disord. 50, 657–664 (2017). - PubMed
-
- Pinhas L., Morris A., Crosby R. D. & Katzman D. K. Incidence and age-specific presentation of restrictive eating disorders in children: a Canadian Paediatric Surveillance Program study: A Canadian paediatric surveillance program study. Arch. Pediatr. Adolesc. Med. 165, 895–899 (2011). - PubMed
-
- Nicholls D. E., Lynn R. & Viner R. M. Childhood eating disorders: British national surveillance study. Br J Psychiatry 198, 295–301 (2011). - PubMed
-
- Madden S., Morris A., Zurynski Y. A., Kohn M. & Elliot E. J. Burden of eating disorders in 5–13-year-old children in Australia. Med. J. Aust. 190, 410–414 (2009). - PubMed
Publication types
Grants and funding
LinkOut - more resources
Full Text Sources